Category Aerodynamics of V/STOL Flight

Boundary layer control by suction

Boundary layer control (BLC) may be utilized for several different reasons and can be accomplished in several different ways. High-energy air can be injected into the boundary layer at different positions along the airfoil with the purpose of increasing the energy of the slower-moving air in the boun­dary layer and thereby delaying separation. On the other hand, the boundary layer can be removed by sucking it off through spanwise slots or a porous surface. This may be done for one of two reasons. The first may be to stabilize the laminar boundary layer in order to delay transition to a turbulent boundary layer. This can significantly reduce the skin friction drag. The second may be to delay or prevent the separation of the turbulent boundary layer or the laminar layer.

Drag Reduction through Stabilization of the Laminar Boundary Layer

A comparison between the skin friction drag coefficients for laminar and turbulent boundary layers was given in Fig. 2-20 as a function of the Reynolds number. Depending on the particular shape of the body and the resulting static pressure distribution, the laminar boundary layer will under­go transition to a turbulent layer at some critical Reynolds number. For a flat plate, for example, with a zero pressure gradient the critical Reynolds number is about 3 x 10⁵. If the laminar boundary layer can be maintained to higher values of the Reynolds number, then from Fig. 2-20 it can be seen that a significant reduction in the skin-friction drag can be realized.

It is well known that the stability of a laminar boundary layer, that is, its tendency to become turbulent, depends both on its thickness and the shape of its velocity profile. Removal of a portion of the boundary layer by suction therefore has a twofold beneficial effect. It thins the boundary layer and, possibly even more important, it produces a more stable velocity profile.

261

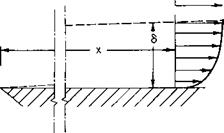
The exact analysis of the laminar boundary layer is accomplished by using the Navier-Stokes equations of motion for a Newtonian viscous fluid. A boundary layer velocity profile is shown in Fig. 10-1. If we assume that the boundary layer is thin (S « x), that the у-component of velocity is small (v « U), and that и changes gradually with x, compared with its gradient with y, Prandtl’s boundary layer equations are obtained.

ди 8u 1 dp d2u

dx dy pdx dy2 (1(M)

du dv fa + dy = ‘

In (10-1), the pressure gradient is written dp/dx rather than dp/dx, for the assumptions just listed result in the fact that the pressure does not vary with

У

Boundary layer control by suction

Fig. 10-1. The boundary layer.

у through the boundary layer; v is the kinematic viscosity and can be found in the standard atmosphere table in the Appendix.

A classic solution of (10-1) is Blasius’ solution for the flat plate. In this case dp/dx = 0. If we let

(10-2)

and define a stream function ф by

ф = ^/vxUrj, f(r]),

(10-3)

Eq. (10-1) reduces to

ff" + If" = 0.

(10-4)

At a solid wall the velocity components must vanish as у -> oo, Hence the boundary conditions are

и -» U„.

П = 0:/= 0,/’ = 0, ц = oo:/’ = 1,

(10-5)

where a prime indicates differentiation with respect to rj. This follows because
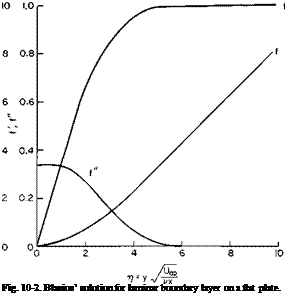
Подпись: Fig. 10-2. Blasius’ solution for laminar boundary layer on a flat plate.

The nonlinear, third-order differential equation (10-4) can be solved in several ways: by expanding / in a power series in t and numerically on a

digital or an analogue computer; f /’, and /" are given in Fig. 10-2 as a function of?/.

Подпись: 5 ~ 5.0 Подпись: vxV'2 uj Подпись: (10-7)

It is difficult to define a boundary layer thickness, for the velocity approaches asymptotically to Ux as у increases. If we arbitrarily define the thickness S shown in Fig. 10-1 as the value of у at which и = 0.99Ux, then from Fig. 10-2

A more positive measure of the boundary layer thickness is the displace­ment thickness 5*; 5* is defined such that if the wall were displaced out-

Boundary layer control by suction

UX(S – S*) = J и dy,

<5*

f00 / vx 1/2

1У p-™*

/vx 1/2

(тг)lim ~ fW)]-

UaoJ 4-°°

ward into the flow a distance of with no boundary layer over it the same amount of flow would pass by the wall at the particular x-location. Mathematically, this can be expressed by


(10-8)


or in the limit, as S -> oo,


From Fig. 10-2 it can be seen that, for large approaches a straight line given by


M = n – 1.73.


Hence for large rj


1/2


~ U3(,£


Notice that is about a third of d.

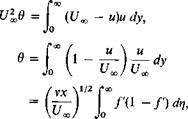
Still another thickness used to characterize the boundary layer is the momentum thickness в, which is defined such that if the flow were displaced outward from the body a distance of в with a uniform velocity of Ux the momentum deficiency in the displaced flow would equal the momentum deficiency in the original boundary layer. Mathematically,


Boundary layer control by suction

1/2


(10-9)


or


в = 0.664f-^


(10-10)


Boundary layer control by suction

Boundary layer control by suction

The ratio of S* to в is an important parameter, Я, used to define the shape of the boundary layer. For the Blasius profile

5*

8* >8.

Boundary layer control by suction

(10-11)


Boundary layer control by suction

<compare^>


Boundary layer control by suction

/7777777/7/7 more stable


777777777777 less stable


Boundary layer control by suction

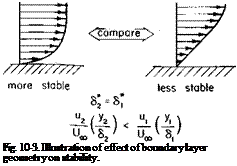
Подпись: Fig. 10-3. Illustration of effect of boundary layer geometry on stability.

Ль) ^

small perturbation velocities. Conditions are then investigated that will cause these disturbance velocities to grow with increasing x-distance down­stream. Generally, the thinner the boundary layer and the fuller the velocity profile, the more stable the boundary layer. This is perhaps better understood by reference to Fig. 10-3.

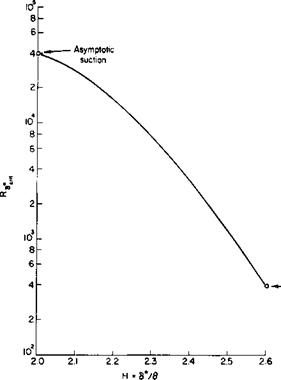
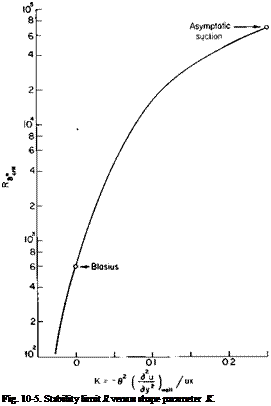
From numerous calculations and some experimental results the curves of Figs. 10-4 and 10-5 have been obtained. These curves which should give

Boundary layer control by suction

Fig. 10-4. Stability limit Ra*ril versus shape parameter Я.

comparable results give the maximum allowable boundary layer thickness in the dimensionless form of Rg,, which will maintain stability as a function of the shape of the velocity profile defined by H or K. Rg. is the Reynolds number based on and the local which may be a function of x.

UJx)S*(x)
Подпись: Fig. 10-5. Stability limit R versus shape parameter K.

By applying suction to the boundary layer we can thin the layer and make the velocity profile more stable. This can be readily shown for the simple case of uniform suction over a flat plate, where the suction velocity is

assumed large enough to prevent the velocity profile from changing with x. If such exists, then du/dx = 0. From (10-1) so that v = constant = — v0, the suction velocity. Further, from (10-1)

du d2u – Vod~y = Vdf’ which integrates immediately to

Подпись: (10-13)u(y) = UJl – e-^) v(x, y) = – v0.

Boundary layer control by suction Подпись: (10-14)

The above is referred to as the asymptotic suction profile and is obtained on a flat plate with uniform suction a distance x downstream of the leading edge of approximately

5* = —,

Boundary layer control by suction Подпись: (10-15)

The displacement and momentum thickness for the asymptotic profile are

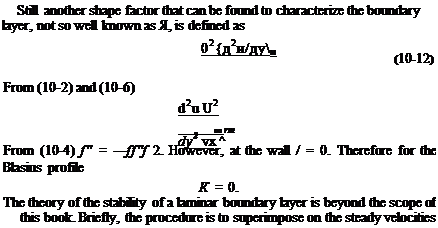
From Figs. 10-4 and 10-5 the asymptotic profile is seen to be considerably more stable than the Blasius profile, although the two criteria differ some­what in the allowable values of Rjt.

A suction flow coefficient, Cq, is defined as

Подпись:■ _ Q

Q tj c

In (10-16), Q is the flow rate being removed by suction, U0 is the free-stream velocity, and Sw is the wetted area. For uniform suction Q = v0Sw so that CQ becomes

Подпись: и о(10-17)

For the asymptotic profile U0 = Ux, and using Fig. 10-4 as being more conservative,

Rs, = 4 X 10⁴.

"crit

Подпись: 104
Boundary layer control by suction

Therefore

Boundary layer control by suction Подпись: 1 Co Подпись: 4 x 10⁴,

or, from Eqs. (10-15) and (10-17),

so that CQ = 0.000025. This is a surprisingly low suction rate to stabilize the boundary layer. Actually, the asymptotic profile does not exist over the whole plate but develops gradually from the leading edge. The intermediate
profiles are not so stable as the asymptotic and, for this reason more detailed calculations have shown that a CQ = 0.000118 is required to ensure that transition does not occur before the asymptotic profile is established. From the standpoint of using minimum power, we would apply the higher CQ value near the leading edge of the plate and reduce it toward the trailing edge.

Certain problems exist in attempting to stabilize a laminar layer. The wetted surface must be free from any roughness or at least from roughness greater than the displacement thickness of the boundary layer. Hence insects or rain impacting on the leading edge of a laminar flow wing could cause premature transition. Also vibration transmitted through the structure may be of sufficient magnitude to trip the layer. Finally, in attempting to suck off the flow, disturbances may be introduced that will cause transition.

One of the most promising schemes for sucking off the boundary layer to maintain laminar flow is to use rows of continuous narrow slots running along the surface and normal to the direction of flow (see Fig. 10-6). These

Boundary layer control by suction

Fig. 10.6. Boundary layer control by suction through slots.

slots are flush with the surface and are very thin. In order not to disturb the flow unduly, the width of the slots must be of the same order as the displace­ment thickness. Typically, this is about three to seven thousandths of an inch. The streamwise spacing of the slots depends on just how the boundary layer develops between slots. Current practice is to calculate the boundary layer growth on the basis of a continuous suction and to distribute the slots in accordance with the required CQ distribution. If the slots are all vented to a common internal manifold, we must relate the velocity through the slot to the difference between the external static pressure and the manifold pressure. If vs is the average suction velocity through a slot and t and s are the slot thickness and spacing, respectively, as shown in Fig. 10-6, the CQ will be

Cq = – JJ— (10-18)

Typically, s is of the order of one or two inches. Although still not completely proved with regard to practical application, laminar boundary layers have been maintained on aircraft wings to Reynolds numbers based on the chord – wise distance as high as 46 x 106.

Fan-in-Wing Configuration

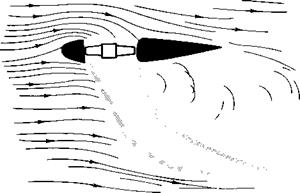
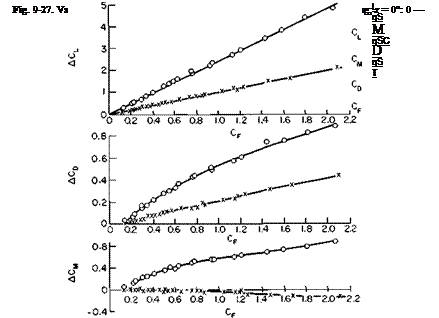
The fan-in-wing configuration consists of a fan submerged in the plane of a wing. The combined flow shown in Fig. 9-25 is sketched from a photo­graph taken from Ref. 13 of streak lines from water-tunnel data. The effect of the fan on the wing is somewhat similar to the section of a jet flap. The efflux from the fan is discharged in a direction normal to the plane of the wing and then turns in the downstream direction. In so doing a circula­tion is induced around the wing. We would expect, therefore, that the dimensionless coefficients of the fan-wing combination could be expressed as functions of the angle of attack and a “momentum coefficient ” of the fan.

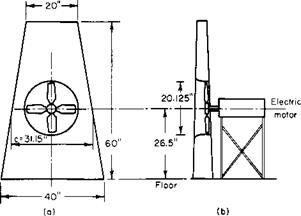
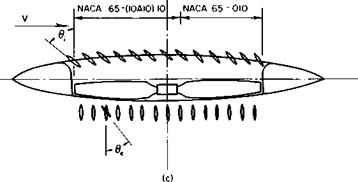
The semiwing and fan combination shown in Fig. 9-26 was tested in

Fan-in-Wing Configuration

Fig. 9-25. Flow through a fan-in-wing configuration.

Ref. 14. The principal results are given in Fig. 9-27. In this figure, for example, ACL is the CL of the fan-wing combination minus CL for the wing without the fan rotating. The curves labeled “fan only” signify the forces on the fan when operating in the plane of the wing. By definition, ACL for the fan only is equal to CF. Notice that the induced lift on the wing is about 1.5

Fan-in-Wing Configuration

Fan-in-Wing Configuration

Fig. 9-26. Fan-in-wing configuration: (a) planform; (b) front view; (c) fan-in-wing configuration.
times larger than the thrust of the fan; that is, the lift of the combination is 2.5 times the thrust of the fan. However, this ratio is not so great for the static case. According to the data of Ref. 14, the static thrust coefficient of the propeller above is 0.30, whereas CT of the combination is 0.5; CT is defined according to Eq. (4-57).

The static power coefficient, defined according to (4-57), is quoted in Ref. 14 as Cp = 0.59. The value seems rather high, yet it is in line with the

results of Ref. 13. In terms of the standard propeller coefficients, the figure of merit becomes

J3/2

ДрАР

or, in terms of CT and Cp,

Fan-in-Wing Configuration

For this particular case, therefore, M = 0.475 for the combination.

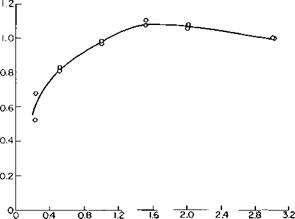
The effect of ground proximity on the static lift of the fan-wing com­bination is shown in Fig. 9-28. Below a height of approximately one fan diameter the static lift of the combination is seen to decrease significantly with decreasing height.

The configuration shown in Fig. 9-26 has both inlet and exit vanes for directing the flow entering and leaving the fan. The test results show that

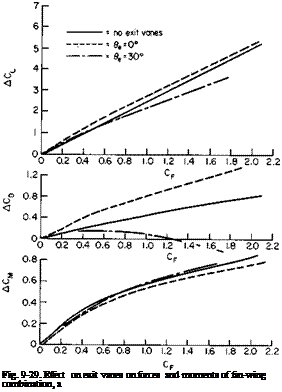
from the standpoint of lift and drag little is to be gained by using inlet vanes. In fact, for most of the angles and CF values tested the use of inlet vanes was detrimental to both the lift and the drag. The exit vanes, on the other hand, appear to offer some advantages. As shown in Fig. 9-29, the lift and pitching moment are only slightly affected by deflecting the exit vanes. The drag, however, is reduced appreciably at the high CF values by directing the fan efflux 20 or 30° rearward.

The effect of forward speed on the power required by the fan is shown in Fig. 9-30. Here the ratio of power required at a forward speed to the static

Fan-in-Wing Configuration

h/D

Fig. 9-28. Effect on ground proximity on total static lift: h = distance above ground,

D = fan diameter.

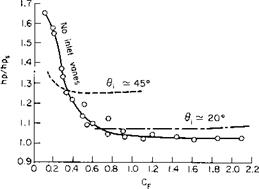
power required at the same fan rpm is plotted as a function of the propeller force coefficient. As can be seen, the power is relatively unaffected for values of CF above approximately 0.7. Below this value, however, the induced effects of the fan are not strong enough to prevent the flow from separating from the upstream lip of the duct; the result is a poor inflow to the fan. This power increase can be alleviated by deflecting the inlet vanes forward, as shown in the figure.

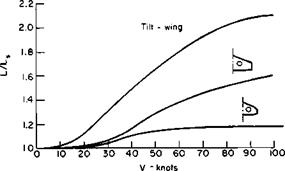
The lift augmentation provided to the wing by the fan in forward flight is not nearly so great as that for a tilt-wing aircraft where wing is sub­merged in the slipstream. For this reason the fan-in-wing configuration does not look promising as a STOL aircraft. This is shown quantitatively in Fig. 9-31 taken from Ref. 16 for three hypothetical aircraft, all with the same wing loading and wing area.

There is still no acceptable theory for predicting the performance of a fan-in-wing configuration. At best we will probably have to resort to a

Fan-in-Wing Configuration

Fig. 9-30. Ratio of power to static power for constant fan rpm.

Подпись:

numerical solution such as that presented in Ref. 15. Here a lattice of horseshoe vortices replaces the wing-fan combination and the strength of the vortices is adjusted so that the induced velocities normal to the wing surface are zero and equal to a desired nonzero value at the fan location. Reference 17 follows the same procedure but includes a vortex tube that simulates the slipstream below the fan.

Fan-in-Wing Configuration

Fig. 9-31. Ratio of lift to static lift for fan-in-wing configurations compared with the tilt-wing.

Problems

1. Given a straight tapered duct with an entrance diameter of 6 ft. a length of 8 ft. and an exit diameter of 4 ft. Calculate the velocity along the centerline at the mid-chord using the approximation of fig. 9—5 for a free-stream velo­city of 100 fps. What is the value of Г?

2. A propeller is installed in the duct of problem one at mid-chord. If the thrust of the propeller is 1000 lbs., what is now the value of Г? What is the value of of the shroud thrust? What is the ideal HP required by the propulsor-shroud combination? For the same total thrust, what diameter of an open-propeller would give the same ideal power?

3. Design the rotor for problem 2 (pitch angle and chord) for a ten-bladed rotor having a constant section C/ of 0.5 and a tip speed of 600 fps.

The Ducted Propeller at an Angle of Attack

At the present time no particular method exists for predicting the aero­dynamic behavior of a ducted propeller at extreme angle of attack. The problem is a difficult one because of the dominant role of real fluid effects. About the best that can be done is to examine in a qualitative sense the experimental results that have been obtained to date.

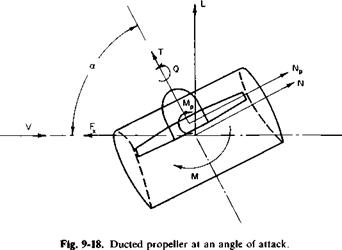
Figure 9-18 shows the system of forces and moments acting on a ducted propeller at an angle of attack taken from Ref. 8. Consider what might be expected for the behavior of this force system as a. is increased from zero. The duct behaving as a ring airfoil would produce a lift. Solutions of the ring airfoil appear in the literature based on various mathematical models. For example, Ref. 9 presents a theory comparable to lifting line theory for planar wings and predicts that the lift of a ring airfoil is twice the lift of an elliptic wing with a midchord equal to the chord of the ring airfoil and a span equal to the diameter of the ring airfoil. Hence, if CL for the ring airfoil
is based on its projected planform area, then dCJda is predicted to be

dCL _ 2 nDC/4 /dCL da DC da /elliptic

or

Подпись:dCL = n /ЛСЛ da. 2da /elliplic’

The Ducted Propeller at an Angle of Attack

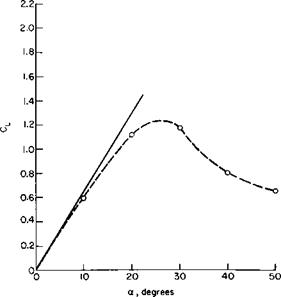
(dCL/da)eUiptic is the slope of the lift curve of an elliptic wing with an aspect ratio equal to 4D/nC and can be obtained from Fig. 3-17 or Eq. (3-55). A comparison between (9-32) and the experimental results of Ref. 8 is pre­

sented in Fig. 9-19 by using Eq. (3-55) and a section lift curve slope of 0.1C,/degree. It can be seen that the performance of the ring wing is pre­dicted closely by Eq. (9-32).

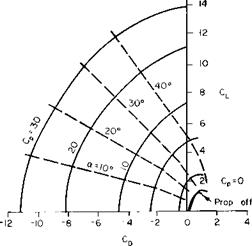
Adding a thrusting rotor to the duct does not increase the lift of the duct by the vertical component of the rotor thrust. In fact, the lift of a ducted propeller is considerably more than the sum of the lift on the duct alone and the vertical component of the total thrust. At this stage of development, it appears to be somewhat dangerous to attempt to generalize on the experimental results available. Instead, a few typical results are discussed. Figure 9-20, taken from Ref. 10, presents in one rather convenient manner the lift-thrust-power angle-of-attack relationship for a particular ducted propeller. Here CD versus CL is plotted for several constant values of a power coefficient Cp. Contours of constant a are also shown; Cp is defined as the power divided by pV*S, S being the projected planform area of the
shroud. In such a presentation the vector from the origin to a point on the contour represents the resultant dimensionless force vector for that set of operating conditions. As Cp increases, any velocity induced by the rotor would become large in comparison with the free-stream velocity and the

The Ducted Propeller at an Angle of Attack

Fig. 9-19. Lift curve of a ring airfoil:————– Eq. (3-55); —e— Ref. 8, Fig. 8;

C = 10.31 in.; D = 16.90 in.

The Ducted Propeller at an Angle of Attack

resultant force would be expected to be a constant independent of a. This expected behavior is confirmed by the constant Cp curves becoming more circular as Cp increases.

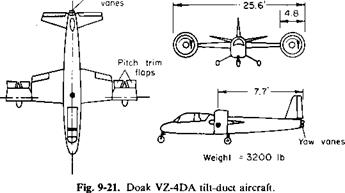
Actual flight tests of a tilt-duct aircraft, the Doak VZ-4DA, are reported in Ref. 11. A sketch of the aircraft is presented in Fig. 9-21. Its two ducts have an inside diameter of 4 ft and a chord of 2.75 ft and are rotatable through an angle of 92°.

Flight test data were obtained on both power required and handling performance. Because the resultant-force vector produced by the ducted

Pitch control

The Ducted Propeller at an Angle of Attack

The Ducted Propeller at an Angle of Attack

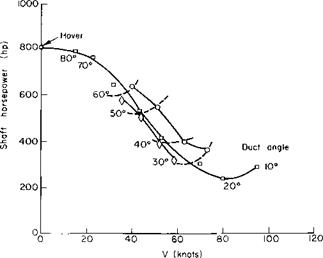
Fig. 9-22. Power required through transition speed range for Doak VZ-4DA. awing, degrees: О = 2.5; □ = 6.5; 0 = 10.5; constant awjng; constant aducl.

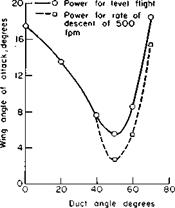
propellers can be varied, the lift required of the wing in level flight at a given speed can be varied. Hence the power required by the aircraft to maintain level flight depends on the angle of attack of the ducts in relation to the aircraft. These results are shown in Fig. 9-22, in which it appears that the least power is required when the wing is operating at the higher angles of attack. Of course, this is in the transition speed range and power is probably of a secondary consideration anyway. Perhaps the most impor­tant fact to note is that the power required is a maximum at V = 0 and decreases continuously without any abrupt changes to the normal aircraft configuration.

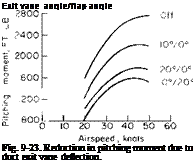
Подпись: Exit vane angle/flap angle Fig. 9-23. Reduction in pitching moment due to duct exit vane deflection. Подпись: -20°
The Ducted Propeller at an Angle of Attack

Of more importance is how the aircraft handles through transition. Is the longitudinal control sufficient and does the aircraft experience buffeting due to stalling on the wing or ducts? A ducted propeller at an angle of attack produces a significant nose-up pitching moment. Data on this for

the Doak VZ-4DA ducted-fans presented in Fig. 9-23 are taken from wind – tunnel studies reported in Ref. 12. These data are for a constant wing angle of 2° at the power required for steady level flight. As shown in the figure, by installing a small vane in the slipstream of the duct the nose-up pitching moment can be reduced by a factor of 2.

The stalling or buffeting boundaries determined from the flight tests of Ref. 11 are shown in Fig. 9-24. In a comparison of this figure with Fig. 9-22 it is found that the aircraft is the most critical with respect to stall at a speed of approximately 45 knots. The stalling occurs on that portion of the wing closest to the ducts, apparently the result of an upwash induced at the wing by the ducted propeller.

The lack of an adequate theory to predict the behavior of a ducted pro­peller at angles of attack is probably not too serious. We can estimate its static performance in hover and its performance in the full nose-down position on the basis of the considerations given earlier. For intermediate positions some “eyeballing” based on Figs. 9-20 and 9-22 can be done.

The Ducted Propeller at an Angle of Attack

Fig. 9-24. Effect of power on stall onset boundaries.

Design of the Stator

It is advantageous to have a row of stationary, or stator, blades down­stream of the rotor for both mechanical and aerodynamic reasons. Mechani­cally, the stator supports the duct. Aerodynamically, it can be designed to remove the rotation imparted to the flow by the rotor; hence it recovers this rotational energy and produces more efficient propulsion.

The flow diagram through the stator is shown in Fig. 9-17. Entering the

stator is the flow that leaves the rotor. The flow leaving the stator is purely axial. Hence the stator imparts the same A и to the flow as the rotor but in the opposite direction. For the stator Vx is simply the resultant of VR and

Ли

Design of the Stator

Design of the Stator

Design of the Stator

Fig. 9-17. Velocity diagram for the stator.

Au/2. Equations (9-27), (9-29), and (9-30), of course, hold for the stator as well as the rotor.

Power Requirements

For the static case (CT -> oo) and

JjL . (9.24)

Р1р„р t JtpJa

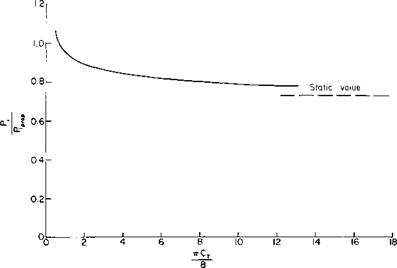
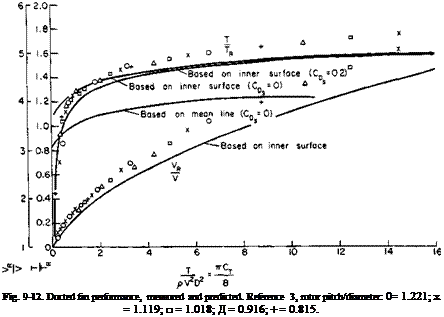
Equations (9-23) and (9-24) have been evaluated for the duct of Fig. 9-11 by using the value of T/TR and VR/V given in Fig. 9-12 (including the effect of shroud drag). For this particular case PJP1 is presented in Fig. 9-14 as a function of the total thrust coefficient. The ducted propeller is seen to be superior to the open propeller above a value of nCT/8 of approximately

Power Requirements

Fig. 9-14. Ratio of ideal power required by ducted propeller to ideal power required by rotor acting as open propeller (for duct in Fig. 9-11).

0. 65. For the static case for the same total thrust the ducted propeller requires about 27% less ideal power.

Design of Rotor

This section considers briefly the design of the rotor. For a more com­plete treatment consult the many available references (e. g., [4]).

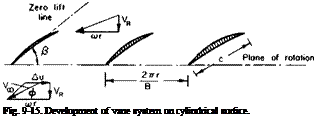
Unlike propeller design theory, which corrects two-dimensional airfoil theory for the effect of the trailing vortex system, the ducted rotor design can be based on the application of cascade data. The development of a cylindrical surface of radius r concentric with the axis of rotation is shown in Fig. 9-15. Each section is acting under the influence of a rotational

<> + =7*)

Power Requirements Подпись: (9-25)

velocity, tor, and an axial component, VR. In addition, the fluid is given an additional tangential velocity. An, after passing through the cascade of airfoils. For such a cascade of airfoils lift and drag coefficients are based on the velocity Vx, which is the resultant of VR, cor, and Au/2. Thus the thrust and power of В blades can be written in integral form as

where £ = CJC,.

Подпись: Fig. 9-15. Development of vane system on cylindrical surface.

The tangential velocity A и can be related to the pressure increase across the vane system Ap through the power. For an annular streamtube of cross-

sectional area 2nr dr passing through the vane system the rate of change of angular momentum is equal to the differential torque dQ. Therefore

rp(2nr dr)VR Am = dQ ;

but to dQ must equal the incremental power given by the product of Ap and the flux of fluid through the streamtube. Hence

corp(2nr dr)VR Am = Ap(2nr dr)VR

Power Requirements Подпись: (9-26)

or

Equation (9-26) is often referred to as Euler’s pump equation.

Observe that the circulation around each section is a constant, indepen­dent of radius, which follows from writing Г as

Substituting for Am from (9-26) gives

Г – ,9.28)

Враз

This type of loading, in which Г is constant and A и varies inversely with r, is referred to as a “ free-vortex ” distribution. It is not always possible to accomplish it because of the large amount of turning, or high Am, required at low values of r. As in an isolated airfoil, stalling may occur for the cas­cade of airfoils if an attempt is made to obtain too high a value of C,. As already stated, C, is based on Vx and can be related to Г by

clL = PVXГ dr

or

dL = jpV^cC, dr

so that

Г = icCtVx. (9-29)

The kinematic conditions for other than free-vortex loading are discussed in Refs. 1 and 5. Stalling or “diffusion” limits of flow through a cascade are discussed in Ref. 4. In general, we try to avoid large values of C,. However, the problem in pumps is more complicated by the fact that there is a rise in static pressure across the blade row. This adverse pressure gradient can have a decided influence on the stall.

Power Requirements

2тгг _ Vane spacing Be Vane length

The lift coefficient of an airfoil in a cascade is not simply a function of its camber and angle of attack; it also depends on the geometry of the cascade, namely, the angle ф in Fig. 9-15 and the gap-chord ratio 2nr/BC.

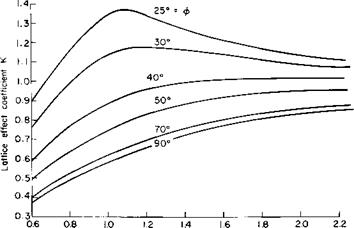
Figure 9-16, taken from Ref. 4 (Fig. 1-9), presents the lattice effect co­efficient K, the ratio of C, for an airfoil in a cascade to the C, produced by the same airfoil when acting by itself, as a function of ф and 2nr/BC. To clarify the use of К the value of C, for a flat-plate airfoil in cascade at an angle of attack, relative to Vx, of a theoretically would be

C, = 2nKot. (9-30)

An approximation to К was obtained in Ref. 6, which is in close agree­ment with the exact solution over a wide range of solidity and stagger angle ф. The closed-form approximation that follows approaches the exact solution for increasing values of 2nr/BC and is identical with the exact solution for ф-values of 0 and 90°.

С, _ 4r Г tan2 nX + tanh2 n Y 1

2rox BC sin ф tanh яУ(1 + tan2 nX) + cos ф tan nX( – tanh2 aT)J

where

= cos ф (Anr/BC)

Подпись: (9-31)= sin ф (4tz r/BC)

In lieu of correcting C, with the lattice effect coefficient, we can refer directly to tests of cascades of airfoil in order to obtain the desired turning of the flow. Such data can be obtained, for example, from Ref. 7.

In Ref. 4 a method, referred to as “the mean-streamline method,” is developed for calculating the shape of a blade section to give a desired pressure distribution. In this method the amount of turning to be produced by each section is related to the pressure difference required by that section. With this information, a mean-streamline and a section camber line that departs from it slightly can be determined. This method as well as additional considerations of cascades are presented in Chapter 11.

Shroud Design

The shroud controls the velocity and pressure at the rotor. It also permits a finite loading to be maintained at the tips of the rotor blades. The flow as it approaches the shroud is either accelerated or decelerated, depending on the application of the propulsor. In a low-speed, high-static-thrust application the flow is accelerated.

Consider first the behavior of the shroud without a rotor. Its effect on the flow can be separated into two parts—one due to camber, the other to convergence angle. The straight-sided duct shown in Fig. 9-3a has positive, zero, and negative convergence. Because the velocities and static pressures far ahead of and behind the duct must be equal, it is obvious that positive convergence diffuses the flow in the duct. In Fig. 9-3b positive camber is seen to have the same effect as positive convergence.

A diffusing shroud generating a circulation around its section is shown in Fig. 9-4. In this case the flow ahead of the shroud is given a radially outward induced component, whereas behind the shroud the flow is deflected inward. In an accelerating shroud the circulation and induced velocities are in the opposite direction.

Shroud Design

A solution of the aerodynamics of the shroud, or ring airfoil, comparable to thin airfoil theory, can be obtained by replacing the mean camber line of the airfoil by a continuous distribution of vortex rings. However, the

Shroud Design

analytical details of carrying out this procedure is complex and in general leads to a solution that is not of closed form. Provided that the configuration is not too extreme with regard to camber, it is possible to estimate the thrust on the shroud relatively easily by the application of a simple artifice.

This is done by replacing the shroud with a ring vortex located at its one – quarter chord line and satisfying boundary conditions at the three-quarter chord line. This approximation is referred to as Weissinger’s approximation and was mentioned earlier in Chapter 3.

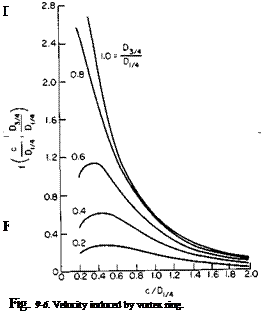
A ring airfoil is shown in Fig. 9-5. The convergence angle of the chord line is assumed to be small so that the axial distance between the quarter – and three-quarter chord points is approximately c/2. Tabulated functions, given in Ref. 2, relate Г, vh and the geometry of the ring. According to the
reference, the velocity induced at the three-quarter chord point can be expressed as

Shroud Design

(9-10)

Shroud Design

The function

is taken directly from Ref. 2 and is presented in Fig. 9-6; Г must be such as to induce a v( that, when added to the free-stream velocity and the velocity induced by the rotor, will produce a velocity tangent to the mean camber line of the shroud at the three-quarter chord location.

Radial Velocity Induced by the Rotor

The radial velocity induced by the rotor can be found approximately from the shape of the streamtube passing through an open propeller. If the rotor were producing a thrust of TR as an open propeller, then, from Chapter 4, the axially induced velocity varies with axial distance according to (4-54):

Shroud Design(9-11)

where Z is the axial distance downstream of the rotor and Rr is the rotor radius.

From continuity,

(V + wa)nR2 = constant = (F + w0)nRR.

The slope of the streamtube walls with axial distance can be found by differentiating this equation with respect to Z.

Подпись: (9-12)dR R(dwJdZ) dZ ~ 2(V + wa)

The radial component of velocity induced outward by the rotor is given approximately by

Shroud Design(9-13)

Hence a combination of (9-11), (9-12), and (9-13) produces

Подпись:„ = 1

2 (Z2 + Rr)312 ’

Shroud Design

where, from Chapter 4,

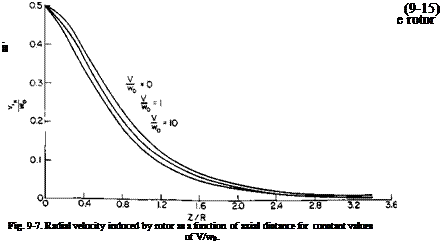
Equation (9-14) is presented graphically in Fig. 9-7.

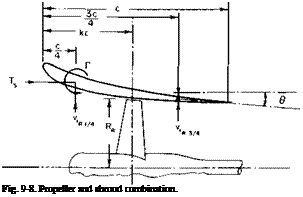
Consider now the shroud and propeller combination in Fig. 9-8. Accord­ing to Weissinger’s approximation, the resultant flow due to Г, the propeller, and the free-stream velocity should be tangent to the mean camber line at 3C/4:

V‘R3/4 V‘ _ 0

v + w-

or

vi = -«w – e(v + w«s/4);

Shroud Design
but vt and Г are related through (9-10). Therefore

point, denoted as -%1/4. Hence the axial force on the ring vortex can be calculated from the Kutta-Joukowski law and the thrust on the shroud becomes

Ъ = ~pviRmTnDm

= Г*>(ДІ)і/4)2[-рца/4 – 0(V + и’Вз,4)]і)ІКІ/4

f(c/D, 4, D3/4/D1/4)

We now define a thrust coefficient for each component as

C – T

Ct~¥av2′

where A is the rotor disk area. Because ViR/F and wJV are functions only of the rotor thrust coefficient, it follows that the shroud thrust coefficient, hence the total thrust coefficient, is a function only of the rotor CT.

Подпись: Fig. 9-8. Propeller and shroud combination.

To dwell further on this, consider the special case of a rotor in a straight duct. Here 0 = 0 and D3lJDm — 1.0.

Shroud Design Подпись: 0.56

In addition, let c/D = 1.0. Then, from Fig. 9-6,

and

Ts = U8p(nD)2viRi/4viRi/4 or

Подпись: CTsде ViR 1/4 ViR3/4

V v ■

Using (9-14), we obtain

CT = 45 ^ i( -1 + J + CTR)2. (9-17)

Н’о щ

The product {viRyJw0) (viR14/w0) depends on the location of the rotor along the duct. From Fig. 9-7 the product has a maximum value of about 0.13
in this case with the propeller at c/2. It drops to 0.09 with the rotor at c/4 or 3c/4. Location of the rotor at c/2 gives

CTs = 1.46(71 + CTr – l)2. (9-18)

Notice that even though the duct is straight a thrust is developed on it

Shroud Design

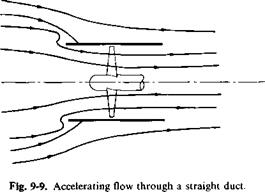
because of the action of the rotor. A more exact vortex treatment would show a singularity, hence a suction force at the leading edge of the duct. Because the shroud is developing a thrust, from the considerations leading to Eq. (9-9) the flow must be accelerating into the rotor, as shown in Fig. 9-9. This can also be deduced from the direction of Г.

Shroud Design

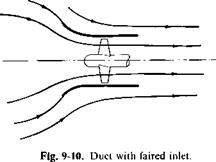
From Fig. 9-9 it is seen that the flow, in a real fluid, would probably separate on the inner side of the leading edge of the duct. To avoid this we curve the mean camber line out at the leading edge, as shown in Fig. 9-10. Theoretically, the thrust on the shroud would remain about the same. Practically, however, the cambered duct would come closer to the value given by (9-18), for separation in the straight duct destroys the leading-edge suction force. The shape for the camber can be calculated approximately from the streamline due to the ring vortex and the rotor acting as an open propeller. Observe, however, that the leading edge is tangent to the incoming flow only at one particular value of CTr.

In a shroud of finite thickness the inside appears to be the controlling surface in affecting the streamtube through the rotor. At least for the

Shroud Design

о

HI

c

_o

CL

Flow

Axis of revolution

Fig. 9-11. Duct for which data of Fig. 9-12 were obtained (drawn to scale).

method presented here, better agreement is obtained with experiment if the inner surface of the duct rather than the mean camber line is used. To illustrate further, consider the performance of the duct shown in Fig. 9-11. This duct is taken from Ref. 3 which presents considerable test data on ducted marine propellers for different duct-propeller combinations. The pertinent geometry for the mean camber line and for the inner surface is tabulated in Table 9-1.

Mean Camber Line

Inner Surface

C/0,,4

0.455

0.486

Di/JDu*

0.955

0.986

0

-2°

Table 9-1

Подпись: Fig. 9-12. Ducted fan performance, measured and predicted. Reference 3, rotor pitch/diameter: 0= 1.221; x = 1.119; □ = 1.018; Д = 0.916; + = 0.815.

The rotor is located at midchord, and the distance from its rotor to c/4 or 3c/4 in terms of the rotor radius is 0.24.

Shroud Design

In any comparison with experimental data the drag of the shroud must be considered. If cf is the drag coefficient of the shroud based on its wetted area, the decrement in the thrust coefficient based on A will be

or approximately

Shroud Design

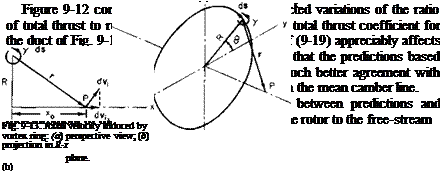
velocity. The velocity through the rotor is calculated as the sum of three components; the free-stream velocity V, the rotor-induced velocity w0, and the axial velocity induced at the rotor by the shroud. The axial velocity is assumed to be that induced along the centerline by the ring vortex located at the quarter-chord point. The latter component can be calculated by means of the Biot-Savart law. Consider the vortex ring shown in Fig. 9-13.

The Biot-Savart law states

у r x ds

From the geometry |ds| = RdO and r and ds are always normal to each other; also |r| is a constant. Further, the axial component of dv, is

dvia = |dv,| sin 0.

Подпись: or Подпись: (9-20)
Shroud Design

Hence

Hence Vj is obtained from the above; the strength у is calculated from (9-15).

Ducted Propeller in Axial Flight

Ducting the propeller, that is, encasing it in a shroud, allows us to main­tain loading on the propellef blades all the way out to the tips of the blades. Also, by suitably shaping the shroud a thrust can be developed on the shroud itself. The treatment of the shroud follows that presented in Ref. 1. Although approximate in nature, it readily discloses aspects of ducted pro­pellers that are obscured by more exact treatments. First, as for the open propeller, consider some elementary momentum principles.

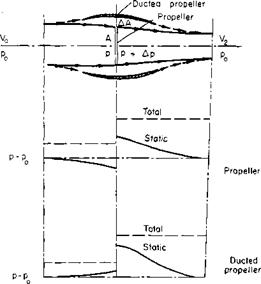
The flow through an open propeller and through a ducted propeller are superimposed over one another in Fig. 9-2. Both propellers are designed

Ducted Propeller in Axial Flight

Fig. 9-2. Comparison of flow through a ducted propeller with an open propeller.

for the same mass flow rate and velocity in the ultimate wake V2. The open propeller has a disk area of A, whereas the disk area of the shrouded pro­peller is A + A A. Thus in this case the shroud is designed to diffuse the flow.

A discontinuity in the pressure Ap exists across each disk. From Eq. (4-6) this is given by

AP = (*У – Vl). (9-1)

The thrust of the open propeller is

Topen = ApA,

whereas that of the ducted propeller, henceforth referred to as the rotor, is

Ducted Propeller in Axial Flight
TR = Ap(A + AA)

If the useful power is defined at TV0, then, as in Chapter 4, the ideal efficiency can be defined by

For the open propeller, T = 2mw, and (9-7) and (9-8) reduce to (4-11). A combination of (9-8) and (9-6) leads to

y = fo «n/Г^С^Г1. (9-9)

Equation (9-9) shows that for a given net thrust the rotor thrust increases as the static pressure ahead of the rotor is increased. To state this another way, if the duct is shaped to decrease the axial velocity at the rotor, the total thrust of the duct-propeller combination will be less than that produced by the rotor. Conversely, if the flow is accelerated by the duct, the duct will develop a thrust that will add to the thrust of the rotor.

As in the case of the open propeller, momentum considerations define limitations on the operation of the ducted propeller but are insufficient for actual design purposes. For this we once again turn to the application of equivalent vortex systems.

Ducted propeller and fan-in-wing configurations

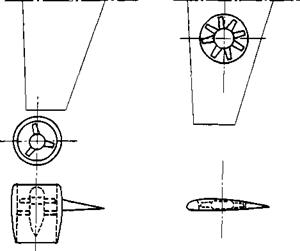
The ducted propeller and the fan-in-wing configurations are somewhat similar in that the flow through the rotating propulsor in each case is influenced by an external surface. The two configurations are given in Fig. 9-1. For V/STOL applications the ducted propeller may be rotated through an angle of attack of 90°. The fan-in-wing, however, operates mostly at only small angles of attack of the wing. In analyzing the ducted propeller, we must consider the interaction between the duct and the pro­peller. Similarly, the influence of the fan and wing on each other must be considered in any analysis of the fan-in-wing configuration. Let us consider first the ducted propeller.

Ducted propeller and fan-in-wing configurations

Fig. 9-1. The ducted-propeller and fan-in-wing configurations.

Linearized Theory

Smelt and Davies [4] developed a semiempirical theory for the effect of a propeller on a wing for lightly loaded propellers, where w « V. Although linearized, the method is of value in many STOL ^applications
and is based on interpolating between two limiting cases by empirical means.

First, consider the case in which the chord of the wing c is small in comparison with the slipstream diameter D1. If the lift is increased on the wing submerged in the slipstream, we would expect the circulation to increase for this portion of the wing. Hence at the edge of the slipstream additional trailing vorticity would be generated. However, for c « D1 the additional induced effects due to the vortices would be negligible. Thus the lift of the wing in the slipstream would simply be increased in proportion to the square of the slipstream velocity or

AL = ipcDtCMV + h’j)2 – V2]

Linearized Theory

or

In (8-19) vi’j is the velocity induced at the wing by the propeller, which is assumed to be lightly loaded so that (nq/F)2 ^ 0.

Now consider the other extreme in which c » Dt. For this case a very small trailing vortex at the slipstream boundary would give rise to a large downwash at the wing in the slipstream and would produce a decrease in the angle of attack, hence a decrease in the circulation. Thus for this limiting case the changing circulation produces effects tending to oppose the change so that the circulation is constant across the wing.

Г = icC, V = jcClt(V + Wl),

where Ch is the C, for the submerged portion of the wing. Thus the incre­ment in lift AL is

Подпись:AL = jpDjcC

Hence the change in wing CL is

Подпись: (8-20)ЛС

L 4 s у

In a comparison of (8-20) with (8-19), Ref. 4 states ACL in general as

A CL = Ct^f^A. (8-21)

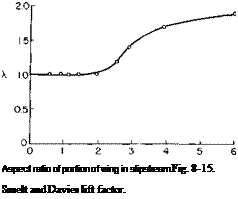
The factor X must lie between 1 and 2 and in general is a function of the aspect ratio of the portion of the wing in the slipstream. This function obtained empirically by Smelt and Davies is presented in Fig. 8-15. In
calculating the aspect ratio for propellers in proximity to a fuselage the submerged area should include that buried in the fuselage.

For the case in which the circulation is constant (A = 1.0) the induced velocities will remain unchanged. The changes in the induced drag co­efficient can thus be readily calculated. Using a sub = 1 for the wing with slipstream,

w

Подпись: ■c,Подпись: V + H’i 2C,

= CDiVF + Wl/

Подпись: Aspect ratio of portion of wing in slipstream Fig. 8-15. Smelt and Davies lift factor.

Because CD. (V + и1,)2 = CD. V2, it follows that there is no change in the induced drag due to the slipstream. This could have been deduced directly

from the fact that the circulation remains unchanged. Hence the kinetic energy of the trailing vortex sheet per unit length, which has already been shown to equal the induced drag, is unchanged.

For the case in which A # 1, Г changes and the induced drag does not remain constant. However, because CD. is inversely proportional to the aspect ratio, and this case represents an infinite aspect ratio, it seems reasonable to assume that the induced drag remains unchanged.

Longitudinal Force

The longitudinal force is treated in a manner analogous to the lift force. The net forward force is calculated as the forward component of the turned thrust minus the induced and profile drag of the wing. The induced drag is calculated from the sum of CLr=o and CLr and accounts for the deflection of the trailing vortex sheet, according to Fig. 3-9. Because the wing is immersed in the wing slipstream, the profile drag should be calculated relative to this direction.

Referring again to Fig. 8-9, we find that the forward component of the thrust is

X = m[VR cos (as + в) — F],

In dimensionless form

Подпись: И . I cos (as + в) - sin a, I VR– F

Longitudinal Force Подпись: (8-18)

Again a correction is necessary to account for profile drag losses. Hence C„ becomes

CJnAR. is equal to 0.238, so that from Fig. 3-9 the above equation must be increased by 1.1 or

CDl = 0.88.

Longitudinal Force Подпись: 1 Ї89 Подпись: - 0.88

Cx is thus

= 5.98.

Again these equations are in close agreement with the experiment.