Category Dynamics of. Atmospheric Flight

EQUATIONS OF MOTION OF THE CONTROL SYSTEMS

Up to this point in our development of the subject we have not found it necessary to consider the dynamics of the vehicle’s control systems per se, although the omission of this feature was pointedly noted in the previous section. In fact the dynamics of control systems not only enter into closed-loop behavior but are also implicit in the stability of vehicles with free controls. When the controls are reversible (i. e. when an external force applied at the surface can cause it to move), the stability with free controls may be appreci­ably different from that with fixed controls. This case can be thought of in a sense as belonging to the feedback class of control problems, since the control angles are then governed by certain inherent aerodynamic and inertial feedbacks.

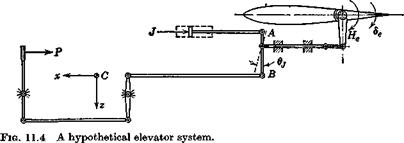
The wide variety of control system types and configurations in common use, and the variability of the schemes used to provide power or force amplification make it virtually impossible to present a universal analysis of any use. We therefore select one hypothetical model of a control system, and show how its equations of motion are derived. Generally speaking, a similar procedure would apply to other cases. The model is that depicted in Fig. 11.4. It consists of a rigid elevator surface, connected by a rigid frictionless linkage to the pilot’s control and to a hydraulic jack. The airframe structure to which the system is attached is also assumed to be rigid. The external forces acting are the pilot control force P, the jack force J, and the aerodynamic hinge moment He. Gravity is neglected since it is essentially

EQUATIONS OF MOTION OF THE CONTROL SYSTEMS

a constant that only affects the equilibrium position slightly. The system has two degrees of freedom relative to the frame FB, i. e. de and Oj. The control system shown represents a power assisted elevator, and does not in­corporate explicitly any provision for closed-loop positioning of the elevator. This would require a somewhat different physical arrangement, and its governing equation would be different from that derived below.

We obtain the equations of motion by applying Lagrange’s equation

(5.12,3) , the procedure being somewhat analogous to that used in Sec. 5.12. In this application, since rigidity has been assumed, the strain energy V is zero. en stands for either de or 6j, so that there are two equations of motion. As in Sec. 5.12 the generalized force n must include the inertia forces associated with acceleration and rotation of the reference frame FB.

CHANGE OF FLIGHT-PATH ANGLE

The phugoid makes its presence known not only in the form of transient perturbations from a steady state, but also in maneuvers, as illustrated in Sec. 10.3. We saw there for example that in changing from level to climbing flight by opening the throttle (Fig. 10.7) there results a protracted, weakly damped approach to the new state that would take some 10 min to complete. Transitions from one value of у to another are obviously not made in this manner, and the pilot suppresses the oscillation in this case as well. Provided that the correct в is known for the climb condition, the same technique as discussed above would work, i. e. proportional control operating on pitch – attitude error. We illustrate an alternative concept that does not require any knowledge of the final correct pitch attitude, but that uses speed error alone. Figure 11.3a shows the system. In this case it is found that proportional control is not adequate—it serves mainly to shorten the period of the oscil­lation, but has little elfect on the damping. To improve damping needs rate control, so the control law used is

t, sec


10


30


20


Fig. 11.3 (a) System with speed feedback. (6) Suppression of phugoid by closed-loop

control—response to thrust change.


CHANGE OF FLIGHT-PATH ANGLE

where the signs of the gains have been chosen to give the required corrections.

Just as in the case of в feedback above, the characteristic equation can he obtained from the approximate transfer function, in this case Gys. It is given by (10.2,15a), i. e. with the same approximations as used above,

D(s)

where D(s) is given by (11.2,6) and (11.2,8) and

N3(s) = mps + m0 % = 2f*GDGmJCmx

mo = GwGLCmJCmx (11.2,14)

The characteristic equation [cf. (11.2,5)] is

D(s) + (Jq + kzs)N3(s) = 0

which becomes

(c2 + mjlc^s* – f (tq + тД + m0kz)s + (c0 + kym^ = 0 (11.2,15)

The new characteristic equation is again second order, being the sum of the original one and additional terms. When the signs of the quantities in (11.2,14) are taken into account, the modifications to the three original coffiecients can be summarized thus

c2: increased by amount proportional to kz

Cj: increased by amounts proportional to Aq and kz

c0: increased by an amount proportional to Aq

Since there are two free constants, k1 and kz, we can analytically satisfy two conditions by means of (11.2,15)—one on the period, and one on the damping of the closed-loop system. This procedure is fairly obvious, and is not elabo­rated on here. The values of the constants finally chosen have to be con­strained of course by practical considerations related to sensor and control hardware limitations. Finally, the approximate analysis has to be verified with the complete system of equations. As an example, Fig. 11.3 shows the response to a step input of thrust obtained using analogue computation of the full system of equations. The constants used were

Aq = .30 rad/unit; k2 = 1000 rad/unit

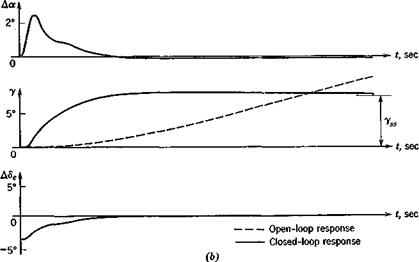
The first corresponds to a deflection of.172° per 1 % change in speed, and the second to 25.3° per g of forward acceleration. The airplane and flight condition of the figure are the same as those for Fig. 10.7. The dashed lines show the beginning of the phugoid response that would exist without feed­back. This would take about 10 min to decay. The solid lines show the response with feedback, and we see that for all practical purposes the transition is completed smoothly and rapidly—within about 15 sec. There is a small overshoot in y, and small errors in AV and AS that die out rather slowly. This feature could be eliminated at the cost of some additional complexity by introducing some integral control. The elevator angle variation required to accomplish the transition is seen to consist of an initial step (up-elevator) followed by a gradual reduction of the deflection. The conditions near t = 0 are, of course, somewhat artificial because of the step input used.

A gradual thrust increase would have resulted in a gradual deflection of the elevator. It should be noted that the error in AF, the primary quantity sensed, is indeed kept quite small. The role of Да is worth commenting on. At the scale of the figure, there is practically no a change in the open-loop case within the time span shown. The “pulse” in a in the closed-loop case clearly has the effect of producing a corresponding pulse in lift that rotates the velocity vector through the required angle.

Finally, it should be observed that in theory a human pilot has all the state information that we have assumed was available. V and T could be obtained from an airspeed indicator, and additional information about T can be felt as an inertia force (a “seat-of-the-pants” input). An autopilot could readily have AF supplied in electronic form by a conventional trans­ducer, but would be somewhat more troublesome. The two principal alternatives would be differentiation of F, or an acceleration signal from an inertial platform.

EXAMPLE—SUPPRESSION OF THE PHUGOID

The characteristic lightly damped, low-frequency oscillation in speed, pitch attitude, and altitude that was identified in Chapter 9, was seen in Chapter 10 to lead to large peaks in the frequency-response curves (Fig. 10.3) and long transients (Figs. 10.6 and 10.7). Similarly, in the control-fixed case, there are large undamped responses in this mode to disturbances such as atmospheric turbulence (see Chapter 13). These variations in speed, height, and attitude are in fact not in evidence in actual flight; the pilot (human or automatic) effectively suppresses them, maintaining flight at more or less constant speed and height. The logic by which this process of suppression takes place is not unique. In principle it can be achieved by using feedback signals derived from any one or a combination of pitch attitude в, altitude zE, speed V, and their derivatives. In practice, the availability and accuracy of the state information determines what feedback is used. We shall see that a simple negative feedback of pitch attitude suffices effectively to eliminate the phugoid. Pitch attitude is instantly and accurately available from either the real or artificial horizon. We shall also see that operating on speed error can produce pitch maneuvers free of phugoid oscillations.

Consider the system shown in Fig. 11.2, in which dc is the pitch command,

Fig. 11.2 Phugoid suppression system.

Gp(s) is the overall transfer function of the control system, and g is a dis­turbance (gust) input. The pitch attitude is given by

e = G9gg + Ges5e (11.2,1)

and we readily find the overall transfer functions

0 g, Qw

Подпись:0C 1 + GvGes

0 Q»t

9 1 + GvGei

Подпись: G, Подпись: D EXAMPLE—SUPPRESSION OF THE PHUGOID Подпись: D Подпись: (11.2,3)

The stability with respect to 6C or g inputs is given by the roots of the char­acteristic equations of these two overall transfer functions. So long as de and g are both inhomogeneous inputs to the linear aircraft system, it can be seen that the denominators of Ges and Geg are the same, each being the char­acteristic polynomial det (si — A) (see Sec. 3.2). Thus we may write

where Nv N2, D are polynomials in s, and the overall transfer functions are

0 GvN1

вс D + GI1N1
g D + GVNX

The poles of these transfer functions, which are the roots of the characteristic equations, will be the same if GpN1 and N2 have no poles (or the same poles), and in that case the stability with respect to gust inputs will be the same as that for pitch command inputs. A reasonably general form for Gp(s) for this application is

<?»(*) = -1 + h + h*

s

For obvious reasons, the three terms on the r. h.s. are called, respectively, integral control, proportional control, and rate control, because of the way they operate on the error e. The particular form of the controlled system, here Ged(s), determines which of kv k.,, h, need to be nonzero, and what their magnitudes should be for good performance. Integral control has the char­acteristic of a memory, and steady-state errors cannot persist when it is present. Rate control has the characteristic of anticipating the future values of the error and thus generates lead in the control actuation. It turns out
that all we need here is proportional control, so we choose Gp(s) = K, a constant, and the characteristic equation is

D{s) + KN^s) = 0 (11.2,5)

To proceed further, we need explicit expressions for and D. We saw in Sec. 10.2 that the phugoid approximation to Ged is quite good up to elevator frequencies near that of the short-period mode. Since we may expect that the elevator frequency needed to suppress the phugoid is of the same order as the control-fixed phugoid frequency, we may use (10.2,156) in this analysis (and this is verified a posteriori). We therefore have

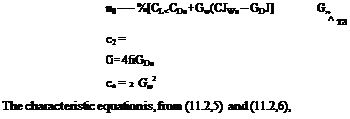
Подпись:Nfls) = n2s2 + ще + щ D{s) = c2s2 + crs + c0

Approximate expressions, good enough for this example, are obtained from (10.2,156) by neglecting CLg and assuming CTp = —20^ and G D^<< CL^. We then get

Подпись: n2 = —4ff2 Ста

C*

EXAMPLE—SUPPRESSION OF THE PHUGOID EXAMPLE—SUPPRESSION OF THE PHUGOID

XG

Подпись: (11.2,9)(c2 – f – Kn2)s2 – f- (cx + Kn, y)s — (c0 + Kn0) — 0

and the feedback is seen to affect every term in the equation. We also observe that the numerator of the open-loop transfer function Ges plays a decisive role in determining the characteristics of the closed-loop system.

The frequency and damping of the system are now obtained from (11.2,9)

Подпись:/clt + KnSA ю /1 + Knjc^

Подпись: (11.2,10)c2 + KnJ ”1 + Kn2jcJ

_____ C + Knx_________ ________ (1 + Knjci)________

V (c2 + Kn2)(c0 + Kn0) V(1 + Kn2lc2)(l + Kn0lc„)

where o)n = (c0/c2)^ and 2 ^ = c1/Vc2c0 are the fixed-control phugoid parameters. Using the data for the jet transport cruising at 30,000 ft altitude given in Sec. 9.1, and Cmg = Cm^ we get the numerical values

Подпись: from which(11.2,11)

Even with small gain К the damping of the phugoid is very much increased. The original value was £ = .0535, so to produce a dead-beat transient for which £ = 1, we require £’/£ = 18.7, which is produced by a gain —K = .17. Note that the gain is negative, since a positive error є indicates the nose is too low, and up-elevator (de < 0) is required to correct. With the gain needed for £ = 1.0, we get co’„la>n = 1.07, so the frequency has been increased by only 7%, and the phugoid approximation for Ges is clearly adequate.

This calculation shows how a human or automatic pilot could eliminate the phugoid oscillations quite simply, using readily available state information. The exact control law by which a human pilot actually achieves this result may in fact be somewhat different from that assumed here, but it is probable that в is the prime variable on which he operates.

Closed-loop control

Although open-loop responses of the kind studied in some depth in Chapter 10 are very revealing in bringing out inherent vehicle dynamics, they do not in themselves usually represent real operating conditions. Every phase of the flight of an aerospace vehicle can be regarded as the accomplishment of a set task—i. e. flight on a specified trajectory. That trajectory may simply be a straight horizontal line traversed at constant speed, or it may be a turn, a transition from one symmetric flight path to another, a landing flare, following an ILS or navigation radio beacon, homing on a moving target, etc. All of these situations are characterized by a common feature, namely, the presence of a desired state, steady or transient, and of departures from it that are designated as errors. These errors are of course a consequence of the unsteady nature of the real environment and of the imperfect nature of the physical system comprising the vehicle, its instruments, its controls, and its guidance system (whether human or automatic). The correction of errors implies a knowledge of them, i. e. of error-measuring (or state-measuring) devices, and the consequent actuation of the controls in such a manner as to reduce them. This is the case whether control is by human or by automatic pilot. In the former case, the state information sensed is a complicated blend of visual and motion cues, and instrument readings. The logic by which this information is converted into control action is only imperfectly understood,

but our knowledge of the physiological “mechanism” that intervenes between logical output and control actuation is somewhat better (see Chapter 12). In the latter case—the automatic control—the sensed information, the control logic, and the dynamics of the control components are usually well known, so that system performance is in principle quite predictable. The process of using state information to govern the control inputs is known as closing the loop, and the resulting system as a closed-loop control or feedback control. The terms regulator and servomechanism describe particular applications of the feedback principle. Figure 3.5 shows a general block diagram describing the feedback situation. In the present context we regard у as the state vector, H(s) as an operator (linear in the figure, but of course not necessarily so) and є as the control vector. Clearly, since real flight situations virtually always entail closed-loop control, a study of the consequences of closing the loop is in order.

Another factor that cannot be separated from these referred to above is the force amplification or power amplification common in the control systems of large aircraft. As noted in Sec. 6.8, the control forces needed on large high-speed aircraft may exceed the capabilities of human pilots. Thus another dynamic system—powered controls—intervenes between the pilot and the aerodynamic surfaces. Such subsystems are themselves commonly servomechanisms—closed-loop systems that drive the surfaces in response to pilot commands. Thus we are frequently concerned with “loops within loops,” a very common situation. For example, the “outermost” loop might be a guidance loop that controls the error in vehicle position relative to an ILS beam. An inner loop might be a stability augmentation system (treated later in Sec. 11.4) whose purpose is to improve the inherent lateral dynamics of the vehicle and, finally, within this one there may be still another loop associated with the control-surface servo.

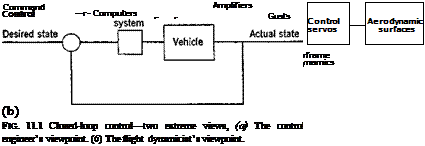
Although flight dynamicists (who usually come from an aerospace engi­neering background) and control engineers (who frequently have a back­ground in electrical engineering) usually communicate adequately on problems of mutual concern, there is often understandably some difference in their points of view. This is illustrated somewhat facetiously in Fig. 11.1. At one extreme, the control engineer may overemphasize the many elements that comprise the control system, and tend to minimize the role of the dynamics of the vehicle itself—perhaps replacing all its rich and varied detail with oversimplified approximate transfer functions. At the other extreme, the flight dynamicist may substitute some simple algebraic relations for the entire control system. Neither extreme is right for the final solution of real problems, but both may have their merits for certain purposes. We naturally tend here to the flight dynamicist’s view of the system in the illustrations that follow. For example, it is sometimes very helpful to consider the loop closure as simply modifying some of the existing aerodynamic derivatives, or
Closed-loop control

adding new ones. Specifically let у be any nondimensional state variable, and let a control surface be displaced in response to this variable according to

the laW Ад = к Ay; к = const (Here к is a simplified representation of all the sensor and control system

dynamics!) Then a typical aerodynamic force or moment coefficient Ga will

be incremented by. _ _ . .

A<?« = Caf Ad

= CagkAy (11.1,1)

This is the same as adding a synthetic increment

№ay = Wat (11.1,2)

to the aerodynamic derivative Ga. Thus if у be yaw rate and 6 be rudder angle, then the synthetic increment in the yaw-damping derivative is

AGnr = kC (11.1,3)

or

which might be the kind of change required to correct a lateral dynamics problem. This example is in fact the basis of the often-applied “yaw damper,” a stability-augmentation feature. Again, if у be the roll angle and 6 the aileron, we get the entirely new derivative

С1ф = kClK (11.1,4)

the presence of which can profoundly change the lateral characteristics.

SENSORS

We have already alluded to the general nature of feedback control, and the need to provide sensors that ascertain the state of the vehicle. When a human pilot is in control, his eyes and kinesthetic senses, aided by the stand­ard flight information displayed by his instruments, provide this information. (In addition, of course, his brain supplies the logical and computational operations needed, and his neuro-muscular system all or part of the actua­tion.) In the absence of human control, when the vehicle is under the command of an autopilot, the sensors must, of course, be physical devices. As already mentioned, some of the state information needed is measured by the standard flight instruments—air-speed, altitude, rate-of-climb, heading, etc. This information may or may not be of a quality and in a form suitable for incorporation into an automatic control system. In any event it is not generally enough. When both guidance and attitude-stabilization needs are considered, the state information needed may include:

Position and velocity vectors relative to a suitable reference frame.

Vehicle attitude (в, ф).

Rotation rates (p, q, r).

Aerodynamic angles (a, ft).

Acceleration components of a reference point in the vehicle.

The above is not an exhaustive list. A wide variety of devices are in use to measure these variables, from Pitot-static tubes to sophisticated inertial – guidance platforms. Gyroscopes, accelerometers, magnetic and gyro compasses, angle-of-attack and sideslip vanes, and other devices all find applications as sensors. The most common form of output is an electrical signal, but fluidic devices (ref. 11.1) are increasingly receiving attention. Although in the following examples we tend to assume that the desired variable can be measured independently, linearly, and without time lag, this is of course an idealization that is only approached but never reached in practice. Every sensing device together with its associated transducer and amplifier is itself a dynamic system, with characteristic frequency response, noise, nonlinearity, and cross-coupling. These attributes cannot finally be ignored in the design of real systems, although one can usefully do so in preliminary work. As an example of cross-coupling effects, consider the sideslip sensor assumed to be available in the stability augmentation system of Sec. 11.4. Assume, as might well be the case, that it consists of a sideslip vane mounted on a boom projecting forward from the nose. Such a device would in general respond not only to ft = sin-1 (»/ V) but also to atmospheric turbulence (side gusts), to roll and yaw rates, and to lateral acceleration ay at the vane hinge. Thus the output signal would in fact be a complicated mathematical function of several state variables, representing several feedback loops, rather than being simply proportional to /3 as assumed in the example. The objective in sensor design is, of course, to minimize all the unwanted extraneous effects, and to provide sufficiently high frequency response and low noise in the sensing system.

This brief discussion serves only to draw attention to the important design and analytical problems related to sensors, and to point out that their real characteristics, as opposed to their idealizations, need finally to be taken into account in design.

NUMERICAL EXAMPLE—PITCH/ROLL COUPLING OF A SMALL AIRPLANE

To show how the nonlinear inertia terms can affect the motion of an airplane we consider a small maneuverable single-engined jet airplane. Its principal characteristics are

W = 6000 lb, 8 = 216 ft2, A = 6.0 b = 36.0 ft, c = 6.0 ft 4 = .170 x 104 slug ft2 4 = .120 X 105 slug ft2, Izx = o 4 = .140 X 105 slug ft2

Note that Ixjlz is only.121, as compared with about.4 for the transport airplane. The pertinent aerodynamic data for flight at 500 fps at sea level are given as

= -.081,

= 4.35, CL&

О

II

11

= -.435,

Сщ*

= ~2-1.

= -9.73

r

= -.081,

= -.442, Clr

= .0309

%

= .0218,

= 0, cnr = –

.0424

= 0. omi

e

-1.07, 0цш =

-24> 0^

CT

= —/ЗС4,

Or.

= — AglCt,

w 1 *9

GT = .017

The value of pcrit calculated from (10.7,9) is.0796. In applying the general nonlinear equations, we assume that Да, /?, remain small, that linearization is permissible with respect to them, and that the speed is constant.

With these assumptions, (5.13,8) et seq. yield the following system of equations.

СтР Cc d~ ^os <i3w — %рА. Гц7

—Д а ■ -f ®^s ^iv cos 4>w ~ 2////jj-

Ci = Кащ ~{j2- K^yr Cm = IvDq A(iz – ijrp Cn = izDf – (ліх –

A

Da = q — qw — ^

Л£ = !> + 1 Да – – J. 4 J.

DJ>W = ^ ^ _|_ g tan sin ^^7 H “ tan 6ц? cos фуу A A

D0jj7 = cos ~

Pw = P + + Да f

= CcpP

@L — C L. fJ-

Ci = Olf(} + Сгр + Огг + GUa Sa Cm Cmf^ + Cm, jDa Cm g ~b Cm/jede

Cn = Cnp + CnJ> + Gnf

The logical structure of these is essentially as in Fig. 5.6.

The above equations were programmed for solution on a digital computer,

using a Runge-Kutta algorithm for solving differential equations. Solutions were obtained for two different sets of conditions:

(i) Initial condition of rolling at rate p{, with all other initial values zero, with |(3e| at 2°, and with da set at the value required to make pss = pi [see (10.6,8)]. Thus the initial value of p would be zero, producing a condition somewhat like that of Phillip’s analysis.

(ii) All initial values zero, with a pitch maneuver initiated by elevator elevator deflection at t = 0 and a subsequent roll maneuver super­imposed by a step change in Sa.

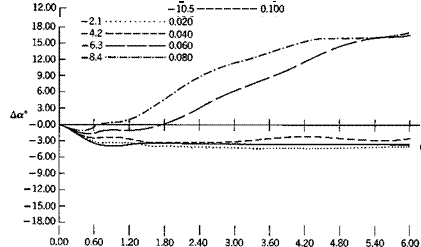
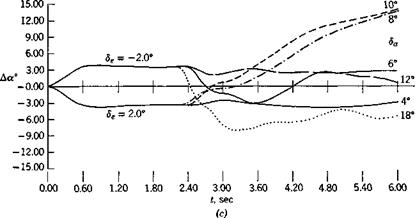
Figure 10.18 shows the angle of attack variation in the first case, (a) for pitch-up and (b) for pitch-down. A striking result is the difference between positive and negative elevator angle, a difference that results entirely from the nonlinearity of the equations. Even for very large aileron angles, there is no evidence in (a) of instability, and only for the case of |<5J = 14.7° does Да become momentarily excessive. On the other hand case (b) develop excessive Да quite suddenly when [da| goes from 4.2 to 6.3°. The difference in behavior in these two cases is largely attributable to the difference in the roll-rate time histories, which in turn results from the fact that /5 > 0 in (a) and (3 < 0 in (6). (The roll rate results are not presented on the figures. The following comments are based on the computer output.) In the case p{ = .060, de = 2.0°, p first decreases slightly, then increases with time as a result of rolling moment due to side-slip, crossing over the critical value.0796 at about.8 sec, and remaining larger till the end of the calculation. Very soon after p exceeds pcrit, Да starts to increase rapidly. On the other hand, for pt = .040, p never reaches the critical value, and Да is “well-behaved.” In Fig. 10.18a, p{ — .140, the rolling moment due to sideslip is negative and decreases the roll rate so that it falls below the critical value at t = 2.6 sec. This is again compatible with the reduction in Да that occurs at about the same time. It appears that the critical roll rate derived by Phillips is a very useful criterion for a “well-behaved” transient.

Figure 10.19 shows the variation of Да for the second case, which is a realistic maneuver, resulting after 5 sec in a pitch-up (or down) of about 20°, and a roll when da = 8° of about 1-]- revolutions. Again the lack of symmetry between pitch-up and pitch-down is clear, the latter being the unfavorable case for a roll to the left. The difference between Да for 8a = 4° and 6a = 8° or 10° is striking. In the former case the detailed solution shows p < pcrit for the whole time, whereas the latter two have p > pcrit almost from the onset of the rolling motion. For the pitch-up case as well, peHt is exceeded for 8a= 12° and 18°, but not for Sa = 6°.

Подпись:NUMERICAL EXAMPLE—PITCH/ROLL COUPLING OF A SMALL AIRPLANE
Fro. 10.18 Variation of Да during rapid roll, (a) Pitch-up case, 8e = down case, 8, = 2.0°.

In the discussion of these examples we have studiously avoided the use of the word “stability” in describing the solutions, using “well-behaved” instead to denote “acceptable behaviour.” We have not in fact discovered anything about the stability of the solution presented, in the strict Lyapunov sense. They may or may not be continuous functions of the initial conditions as t —> со, (although they certainly appear to be continuous for the range of

NUMERICAL EXAMPLE—PITCH/ROLL COUPLING OF A SMALL AIRPLANE

Fig. 10.19 Variation of angle of attack in a combined pitch/roll maneuver.

t considered). Furthermore, the stability in that sense is actually irrelevant (see closing remarks of Sec. 3.5). Whether or not the maneuver is an accept­able one is governed entirely by the size of the Ax and Д/3 excursions that can be tolerated without structural failure or loss of control and not by the theoretical stability of the solution.

WHEN Cm<t > 0 (AERODYNAMICALLY UNSTABLE CONFIGURATION)

In this case c4 and c0 are positive definite whereas c2 changes sign from negative to positive as p0 increases. The only possibility for stable roots is A2 < 0, in which case A is imaginary, corresponding to gyroscopic motion. If A2 is real and positive, or complex, there will be at least one root with a positive real part. Thus the conditions to be met are A2 real and <0, for which it is necessary and sufficient that c22 > 4c0c4. The roll rate required for stability is then given by

Подпись:л 2

Pо >—ГГ

rr.

WHEN Cma < 0 (AERODYNAMICALLY STABLE CONFIGURATION)

In this case c2 and c4 are positive definite and it is c0 that can change sign. The condition (10.7,6) still holds, but because Gm is now negative, it is automatically satisfied. However, the condition that A2 be negative now requires that c0 be positive. So for this case the criterion for p0 is obtained from c0 > 0, i. e.
Подпись: iPol = Подпись: (10.7,8)
WHEN Cm&amp;lt;t &amp;gt; 0 (AERODYNAMICALLY UNSTABLE CONFIGURATION)

Condition (10.7,7) is met for all values of p02 except one, at which the l. h.s. = 0. There is thus one roll rate at which the system has “neutral” stability, i. e. for which there is a zero root. The critical value is

To summarize, we have seen that an aerodynamically unstable configu­ration can be stabilized by spinning it fast enough, and that at a certain critical roll rate an aerodynamically stable configuration becomes neutrally stable. The source of these phenomena is the inertia effects given by the rp and qp terms in the pitching and yawing moment equations. They can be thought of as gyroscopic moments associated with high roll rate. Phillips (ref. 10.1) has analyzed a more general case, in which the vehicle is not axisymmetric, and in which aerodynamic forces as well as moments are retained, i. e. an airplane configuration. In this case he found that there is a band of roll rates within which the vehicle is unstable, the lower critical one being given approximately by the lesser of

Подпись: И(10.7,9)

[compare with (10.7,8)].

For the jet transport of our examples, with Cm = —.488 the critical rate would be pcrit = .112, corresponding to the first of the two criteria. From

(10.6,8) this vehicle, at da = 20°, achieves pss = .0528, a value considerably less than the critical, and hence one would not anticipate any difficulties for this airplane arising from nonlinear inertia coupling.

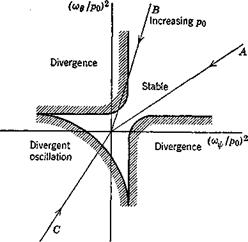
Since the rolling motion may be thought of in a sense as providing a periodic excitation of the uncoupled longitudinal and lateral oscillations, it proves convenient to look at stability boundaries in the plane of the two uncoupled frequencies. This idea was first used by Phillips. The result is typically like that in Fig. 10.17, the exact boundaries depending mainly on the dampings of the two oscillations. A vehicle conventionally stable in nonrolling flight would be represented by a point in the upper right quadrant, the exact position being determined by pn. As p0 increases, the point moves radially toward the origin. If it follows a line like A, there will be no instabil­ity; but if like B, there is an unstable range of p0 separating two stable regions as found by Phillips. A vehicle that is statically unstable in both pitch and yaw when nonrolling will correspond to a point in the lower left quadrant, and can be stabilized by a large enough p0 (line C).

WHEN Cm&amp;lt;t &amp;gt; 0 (AERODYNAMICALLY UNSTABLE CONFIGURATION)

Fig. 10.17 Form of stability boundaries for rolling vehicle. cov = frequency of yaw oscillation, V/NpJIz. o>g = frequency of pitch oscillation, V —Mxfly.

INERTIAL COUPLING IN RAPID MANEUVERS

There is a class of problems, all generically connected, known by names such as roll resonance, spin-yaw coupling, inertia coupling, etc. (refs. 10.1 to 10.9). These have to do with large-angle motions or even violent instabilities that can occur on missiles, launch vehicles, reentry vehicles, and aircraft performing rapid rolling maneuvers. The common feature of all these is that the vehicles tend to be slender, and that rapid rolhng is present. In some of the situations that have occurred in practice, complicated nonlinear aerodynamics, and mass and configurational asymmetries have been im­portant factors in determining the motion. This subject as a whole is too large for anything approaching a comprehensive treatment to be given here. However, we present some analysis that reveals some of the underlying principles, and by way of an example show what can happen in rapid rolling maneuvers of aircraft.

Let us begin by examining a very simple hypothetical case. The body in question is axisymmetric with ly > 4- Its reference flight condition is one of constant V and o>, both these vectors lying on the axis of symmetry, the x axis. We neglect gravity entirely, and study small perturbations around the reference state. The perturbations are further constrained not to include either V or the roll rate, which remain constant at Ve and p0, respectively. We further assume that the only aerodynamic effects are pitching and yawing moments given by

Подпись:— Cma<X + Gm,/i

@n = + Gnr

Because of the axisymmetry, Cn/) = — 6’r% and СПг = Ст>. Since the essence of this problem is nonlinear inertia couphng between the longitudinal and lateral degrees of freedom, we require the general equations (5.13,8) to (5.13,12) for the formulation. In applying the equations we take both the reference
lengths Ъ and c to be equal to a reference diameter d, so that A = 1. There are then four variables left in the problem, [a, fj, p, r], so we need four equations of motion. These are provided by (5.13,96 and c) and (5.13,11a and 6). In using the latter two we note that (5.13,86 and c) show that qw and rw are zero by virtue of the neglect of gravity and aerodynamic forces. (Since the net force is zero, V is a constant vector, and the wind axes have motion of translation only.) The pertinent equations are then, on making due allowance for the axisymmetry,

Gm = iyDq – (Іу – Ijfpo

Gn = KDr + (K – ^ (10.7,2)

Da. = q — Po cos «tan P — r sin a tan ft Dfi = p0 sin a — r cos a

Подпись: (10.7,3)

Подпись: - 4)Po (cmq - Iys) 0 1
Подпись: 0 0 -C, s Po --Po s

On combining (10.7,1) with (10.7,2) and performing the usual linearization, the result is (using Laplace transforms of the equations)

Now we recognize that we are dealing here with the problem of gyrostability. At very large roll rates, we expect the body to display typical gyroscopic motions that will depend mainly on the signs and magnitudes of Cmx and. At vanishingly small roll rates, the equations decouple into conventional lateral and longitudinal sets, in which the sign of Gm (i. e. of the pitch stiffness) is a dominant consideration—for Gm and G both <0, a stable system is assured. We know that even if Gm^ > 0, gyroscopic stability (in the sense that motions are bounded) is achieved at large enough spin rates. This is in fact the method of stabilizing rifle bullets and artillery shells. It is therefore intuitively evident that there must be a critical roll rate for the case Gm > 0 above which the vehicle is stable—just like the critical spin rate for a common top. On the other hand there is no such intuitive notion about the case when Gma < 0, i. e. when the system is already stable at zero spin—the common case in aerospace (as opposed to balUstic) applications.

To study the stability we need the characteristic equation of (10.7,3), which is of fourth order

C4S4 + C3.S’3 + c,,s3 + crs + C0 = 0

where c4 = Iy2

сз =

c2 = -2iyGma + p04v2 + Cm* + (Іу – ixf$* (10.7,4)

C1 = %Qmapmv ~ %!Po2@m/y

c0 = [(iy-IxW + CmJ + Cm*

Unfortunately, even with all the simplifications already made, this equation is still rather too complicated to permit us to say anything simple about the roots. We therefore make a further simplification, and take Gm<[ = 0. We then have

= ї:

c3 = 0

C2 = рЛІ/ + (Іу – Ifl – 2ifim.

c4 = 0

whence Xі = ~c2 ± Vc22 – (1.0.7,5)

2c4

TRANSIENT RESPONSE TO AILERON AND RUDDER

We have seen previously that useful lateral steady states are produced only by certain definite combinations of the control deflections. It is evident then that our interest in the response to a single lateral control should be focussed primarily on the initial behavior. The equations of motion provide some insight on this question directly. Following a step input of one of the two controls the state variables at t = 0+ are all still zero, and from (5.13,20) we can deduce that their initial rates of change are (using the compact notation)

Щ =

Dp = £Єф (10.6,1)

Dr = Жф

The initial sideslip rate Djj is not of much interest, but the rotational accel­erations are. From the last two equations

Dm = (i &ъ + кЖд)д

and for t —*■ 0, m = (ij£^ + кЖй)ід (10.6,2)

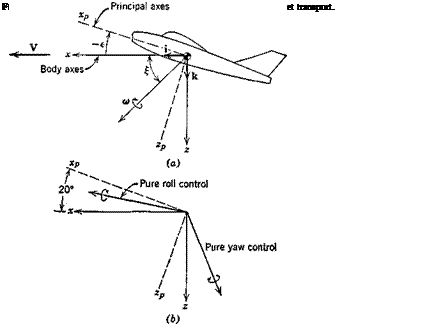
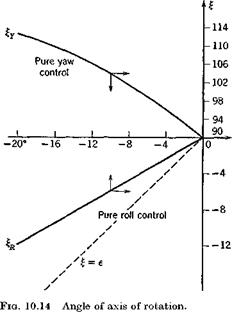
Thus the resultant angular velocity vector, and hence the initial instantaneous axis of rotation, lie in the plane of symmetry as illustrated in Fig. 10.13. Let us investigate the angle {that to makes with the x axis for the two cases of “pure” controls, i. e. when only one of Clg or Gns is not zero. For the roll – control case, 6′ = 0 and

TRANSIENT RESPONSE TO AILERON AND RUDDER Подпись: Ж* Подпись: = г г ГР. ■* 2.T Подпись: (10.6,3)
TRANSIENT RESPONSE TO AILERON AND RUDDER

nO

TRANSIENT RESPONSE TO AILERON AND RUDDER

From the definitions given in (5.13,20), (10.6,3) becomes

and is zero if Izx = 0, i. e. if Cx is a principal axis. This is just as expected,

of course, that a moment applied about a principal axis produces rotation about that axis. When Izx is not zero, we get from (5.4,206)

Подпись: (10.6,4)Подпись: (10.6,5)Подпись:

TRANSIENT RESPONSE TO AILERON AND RUDDER

(I, — I„ ) sin e cos є

Z j, Xp’

TRANSIENT RESPONSE TO AILERON AND RUDDER

vehicle. For vehicles that are slender, such as the SST or a slender missile, the trend indicated above is very much accentuated. In the limit Ix —»• 0, both

(10.6,4) and (10.6,5) give the limit

tan £ = tan e

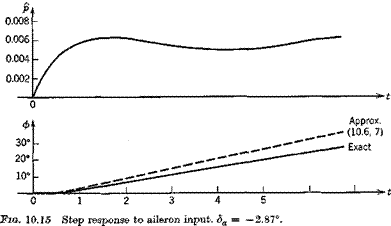
which indicates that the vehicle will initially rotate about its principal x axis no matter what the direction of the applied-moment vector. If this rotation were to persist through 90°, then /? would be equal to |e| and a would be reduced to zero. The above analysis tells us how the motion starts, but not how it continues. For that we need solutions of the complete system equations (5.13,20). Solutions for the example jet transport at CLe = .25 at 30,000 ft altitude were obtained by analog simulation of these equations, and the results for fi, р, ф, and ip are shown on Figs. 10.15 and 10.16. Figure 10.15 shows the response to negative aileron angle (corresponding to entry into a right turn). The main feature is the rapid acquisition of roll rate, and its integration to produce bank angle ф. The maximum roll rate is achieved in about 1| sec, and a bank angle of about 25° at the end of 6 sec. Because of the aileron adverse yaw derivative, Cng > 0, the initial yawing moment is negative, causing the nose to swing to the left, with consequent negative ip and positive p. The positive />, via the dihedral effect G^ < 0 produces a
negative increment in Gv opposing the rolling motion. More than 4 sec elapse before the nose swings into the desired right turn.

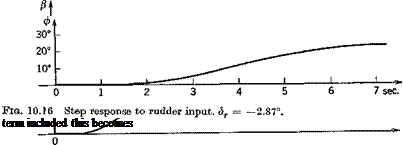
Figure 10.16 shows the response to a negative (right) rudder angle of the same magnitude as the aileron angle on Fig. 10.15. This causes the nose to swing rapidly to the right, /5 being initially roughly equal and opposite to tp indicating virtually no change in the direction of the velocity vector. The result of ft < 0 (because of C'(/j/3) is a positive rolling moment and positive ф.

Right rudder, like right aileron, is seen to produce a transition into a turn to the right, but neither does so optimally. A correct transition into a truly banked turn requires the coordinated use of both controls, and if there is to be no loss of altitude (see Sec. 10.4) of the elevator as well.

An approximation to the ф response to <5a can be obtained from the single – degree-of-freedom roll analysis corresponding to (9.7,7). With the aileron

0

6" – 4° –

TRANSIENT RESPONSE TO AILERON AND RUDDER

2» –

Df = &£ + &» da

Подпись: (10.6,6)

TRANSIENT RESPONSE TO AILERON AND RUDDER

or АБ2ф – А^рВф = £ЄьЬа

Подпись: Ф Подпись: lt + ** TRANSIENT RESPONSE TO AILERON AND RUDDER Подпись: (10.6,7)

The solution of (10.6,6) for zero initial conditions is

This result is compared with the exact solution on Pig. 10.15 and is seen to give a good approximation to ф over the most important first few seconds. This simple analysis supplies a useful criterion for roll control. It yields as

Подпись: or for principal axes, TRANSIENT RESPONSE TO AILERON AND RUDDER Подпись: (10.6,8)

the steady-state roll rate,

A requirement on pss for a given vehicle then leads to an aileron design to provide the necessary Glf da.

DUTCH-ROLL APPROXIMATION

where/(s) is the characteristic polynomial (9.7,13).

For the spiral/roll approximations, we proceed similarly with (9.7,10) to solve for the desired ratios. In the following results, the subscripts a and r are omitted from the control derivatives since the same formulas actually apply to both 6a and dT. The only difference is that &is usually zero [as in

(10.5,6) ] making the aileron transfer functions simpler than those for the rudder.

SPIRAL/ROLL APPROXIMATION

/3 _ a3s3 + a2,s2 -f ars + a0

s m

Ф_,_ b^s – f – b0

Подпись:f(8)

¥ _ d2s% + drs – f – dn

$ /(*)

%=А*І

д d

whore f (s) is the characteristic polynomial (9.7,11) and

«3 = ^,; «2 = + JTr) ~ ^

A

«1 = ®+

A 2 Aju

а0=^.(^гЖд-^Жг)

2 A[i

au g> і ш

W = ; bo = 2і (J2VT, – -2VT,) + – J (J^^r –

d2 = ; d, = – ад); d0 = ^ (J2VT, – JSVQ

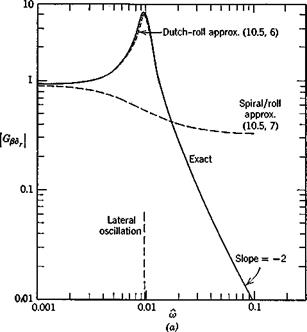
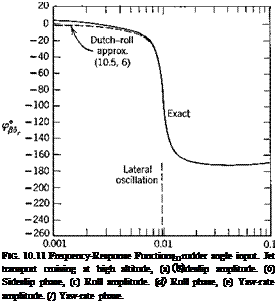
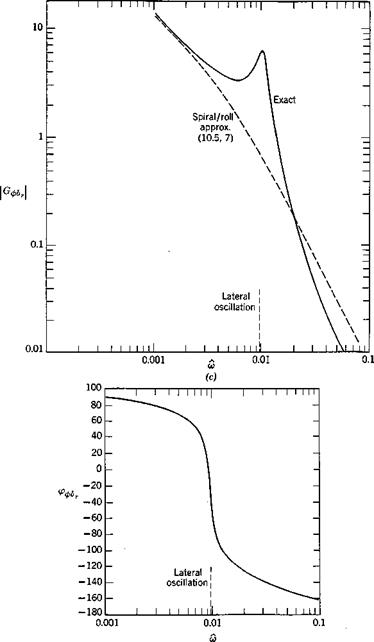
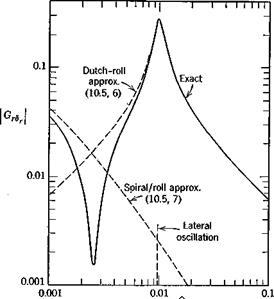
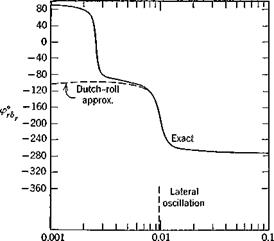
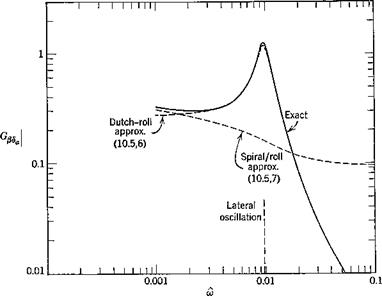
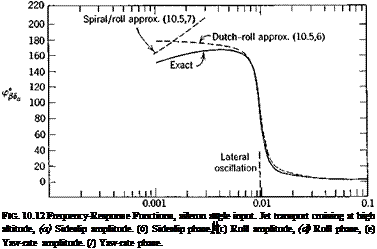
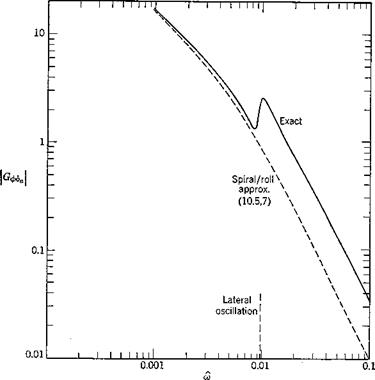
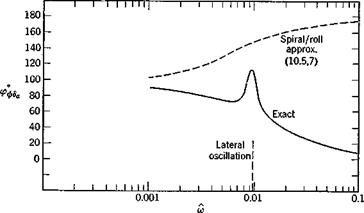
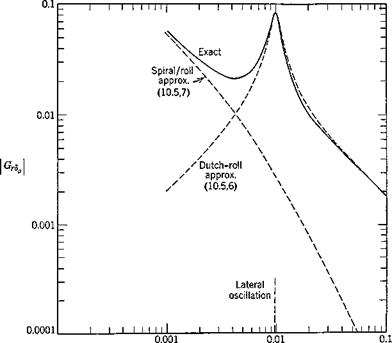
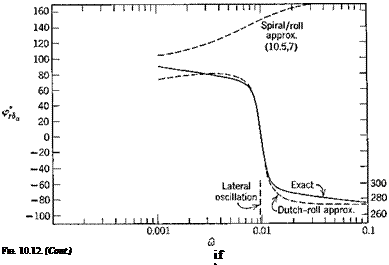
The accuracy of the above approximations is illustrated for the example jet transport on Figs. 10.11 and 10.12. Two general observations can be made: (1) the Dutch-roll approximation gives good results for the higher frequencies, down to a little less than that of this mode, and (2) the spiral/roll approxi­mation is correct in the low frequency limit. In this respect the situation is entirely analogous to the longitudinal case, with the spiral/roll corresponding to the phugoid and the Dutch-roll to the short-period approximation. There are ranges of frequency where neither approximation is satisfactory, as on Figs. 10.lie and 10.12e. The spiral/roll approximations for the phase angles are not shown on Fig. 10.11, since they are reasonable only at the lowest frequency. For all three variables, /?, </>, and f, they increase monotonically to about 180° at the highest frequency, whereas the exact phase angles all decrease in this range.

The reader should note that the agreement shown for the Dutch-roll approximation is not to he expected generally. We saw in Fig. 9.28 that the

damping is not given at all well by this approximation at low speed (high CLJ. Thus the approximate solution at low speed would substantially underestimate the amplitude peaks at the frequency of the lateral oscillation. We repeat that the lateral approximations must be used with caution, and that only the use of the exact equations can guarantee accurate results.

APPROXIMATE LATERAL TRANSFER FUNCTIONS

In Sec. 9.7 we presented two approximate second-order systems that simulate the complete fourth-order system insofar as the characteristic modes are concerned. These same approximations can be used to get approximate transfer functions for control response.

APPROXIMATE LATERAL TRANSFER FUNCTIONS

APPROXIMATE LATERAL TRANSFER FUNCTIONS

APPROXIMATE LATERAL TRANSFER FUNCTIONS

(d)

Fig. 10.11. (Cont.)

APPROXIMATE LATERAL TRANSFER FUNCTIONS

са


(е)


APPROXIMATE LATERAL TRANSFER FUNCTIONS

О)

Fig. 10.11. (Cont.)


(f)


APPROXIMATE LATERAL TRANSFER FUNCTIONS

(а)


APPROXIMATE LATERAL TRANSFER FUNCTIONS

(С)


(d)


Fia. 10.12. (Cont.)


APPROXIMATE LATERAL TRANSFER FUNCTIONSAPPROXIMATE LATERAL TRANSFER FUNCTIONS

APPROXIMATE LATERAL TRANSFER FUNCTIONS

со

(е)


APPROXIMATE LATERAL TRANSFER FUNCTIONS
Подпись: where APPROXIMATE LATERAL TRANSFER FUNCTIONS

Consider first the Dutch-roll approximation (p.374). Taking the Laplace transform gives

W„ – S)

1

M i-1 ________ 1

P

__

1

О

I________

———– 1

{jrr – s)_

f

A-

(10.5,5)

Подпись: вяУїда^a = ~f + bA

l-z

The four transfer functions for j3 and r responses are readily found from

(10.5,5) to be