In recent years, among the subjects of unsteady aerodynamics the flapping wing theory, which is based on the Knoller-Betz effect, has been the most popular one because of ever increasing demands in designing and manufacturing for micro aerial vehicles, MAVs (Platzer et al. 2008; Mueller and DeLaurier 2003).
In order to have sustainable flight with flapping wings, it is necessary to create a sufficient propulsive force to overcome the drag force as well as a sufficient lifting force. In finding the propulsive force we have to evaluate the leading edge suction force created in chordwise direction with pitching-plunging motion of the profile. If we model the profile as a flat plate undergoing unsteady motion, we can obtain the change of the suction force and the lifting force by time using the vortex sheet strength obtained via potential theory (Garrick 1936, von Karman and Burgers 1935). For the sake of simplicity, let us first analyze the plunging motion of the flat plate undergoing a simple harmonic motion given by h = hel0}t, where h is the amplitude of the motion. In terms of reduced frequency k, the Theodorsen function C(k) = F(k) + lG(k), and the non dimensional amplitude h* = h/b the sectional lift coefficient reads as
hi = -2nkh*C(k) + nk2h*. (8.26)
The lifting pressure distribution which provides this lift coefficient also creates a leading edge suction force in the flight direction. The relation between this suction force S and the singular value of the vortex sheet strength at x = — 1 reads as у = 2P/px* + 1, where P = p2C(k)h,
S =-(npP2 + a L). (8.27)
Here, a is the angle of attack, and L is the associated lift if there is also pitching. The derivation of Eq. 8.27 is given in Appendix 9. The minus sign in front of the suction force indicates that it is in opposite direction with the free stream, which means it provides a force in the direction of flight at pure plunge, and for pure pitching it may give negative propulsion depending on the phase lag between the angle of attack and the associated lift.
As an example using Eqs. 3.25-3.26, we can obtain the sectional lift and propulsive force coefficients for a flat plate in vertical unsteady motion given by h = —0.2 cos xt and the reduced frequency of k = 1.5. The real part of the sectional lift coefficient is created by the real part of h(t) which corresponds to cos xt. Therefore, with small manipulations we obtain for the lift
ci = -2pk[(G(k) + k/2)cos(ks) + F (k)sin(ks)]/** (8.28)
and for the suction
cs = —2nk2 [G(k)cos(ks) + F (k)sin(ks)]2 й*2. (8.29)
Here, s = Ut/b shows the reduced time. Shown in Fig. 8.24 is the time variation of the motion of the plate, sectional lift and suction force coefficients with respect to reduced time. During the simple harmonic motion of the plate, since the angle of attack is zero the sectional lift coefficient changes periodically with the amplitude of 1.7 and with the frequency of the motion but with a phase lag. When the profile is at its lowest position, the lift coefficient is negative, and during the early times of upstroke it decreases to its minimum -1.7. While it is still in upstroke motion, the cl value increases gradually to become positive as the profile reaches the highest position. During early stages of down stroke the lift coefficient starts to increase to reach its maximum value of 1.7, and then its value decreases to become negative as one cycle of motion is completed. In other words, as the bound vortex Ua on the plate changes in proportion with the lift, because of the unsteady Kutta condition there is a continuous shedding of vortices with the opposite sign to that of bound vortices into the wake.
During the down stroke of the airfoil, the clockwise rotating bound vortex grows in magnitude for a short time, and after its maximum value it gets smaller while a counter clockwise vortex is shed into the wake from the trailing edge. After the profile passes the midpoint location, the sign of the bound vortex changes to become a counterclockwise rotating vortex while a clockwise rotating vortex is shed into the wake. The schematic representation of the bound vortex formation and the vortex shedding into the wake is shown in Fig. 8.25. In Fig. 8.24, shown is the sectional suction force variation by time which indicates that the propulsive force coefficient remains 0-0.2 in magnitude while its frequency becomes the double of the frequency of the motion. The maximum values of the propulsion
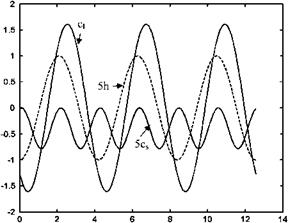 Fig. 8.24 Lift ci and the suction force cs coefficient changes with the vertical motion h of the profile

|
Fig. 8.25 Bound vortex Га and the wake vortices, yw, shed from the trailing edge
|
|
|
|
|
|
|
x
occur as the profile passes through the midpoint during its down stroke, and the zero propulsion is observed twice right after the top and bottom points of the profile’s trajectory in one cycle. This shows us that the creation of the maximum suction force occurs with 90° phase difference with occurrence of maximum or minimum bound vortex. That is when the absolute value of the bound vortex is highest the profile produces zero suction force.
The shedding of vortices in alternating sign from the trailing edge to the wake as described above forms a vortex street. The vortex street in the wake of the oscillating flat plate as shown in Fig. 8.25 indicates that the vortex shed at the top position of the airfoil is in conterclockwise rotation, and the previous vortex shed at the bottom location is in clockwise direction. This means the vortex street has counterclockwise rotating vortices at the top row and clockwise rotating vortices at the bottom row. We note at this point that the vortex street forming at the wake of vertically oscillating flat plate is exactly opposite to the vortex street forming behind the stationary cylinder where the top row of vortices rotate in clockwise and the bottom row vortices rotate in counterclockwise direction. The vortex streets generated behind the circular cylinder and at the wake of the oscillating flat plate have been also observed experimentally (Freymuth 1988). It is a well known fact that the wake formed behind the cylinder creates a drag on the cylinder whereas the wake of the oscillating plate has a structure which is opposite in sign is naturally expected to give a negative drag i. e. propulsion!
Now, let us analyze the physics behind the creation of propulsive force by a vertically oscillating profile using the concept of the force acting on a vortex immersed in a free stream as shown in Fig. 8.26. During the down stroke a clockwise rotating bound vortex is experiencing a vertical velocity component equal to Uz = h for the cases (a) the approximate suction force of S * pUz Ta, and during the up stroke the counterclockwise rotating bound vortex is under the influence of vertical velocity which is in — z direction to create (b) S * pUz Ta which is the approximate suction force. Here, during (a) down stroke, and (b) up
 Fig. 8.26 The generation of suction force S during a downstroke, b upstroke
stroke motions the vertical velocity component and the bound vortex change simultaneously so that the suction force S remains in the same direction as a

bound circulation Uz Ta remains the same, its magnitude changes by time as shown in Fig. 8.24.
The time and space variation of the wake vortex sheet strength can be computed in terms of the bound vortex using the potential theory. The relation between the vortex sheet strength yw and the bound vortex Ca can be established using Eq. 3.13 3.13 for a periodic motion of the profile given by za = h cos ks as follows
 (8.30)
[(H(2) sinkx + H02) coskx)cosks + (H(2) coskx + H02) sinkx) sinks].
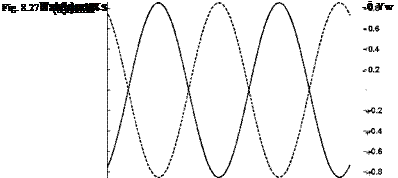
Now, with the aid of Eq. 8.30, we can show the spacewise variation of the wake vortex sheet strength at the top and bottom positions of the profile on Fig. 8.27. As shown in Fig. 8.27, at the bottom position of the profile the shed vortex is positive
i. e. in clockwise direction, and at the top position it is negative i. e. in counterclockwise direction. The near wake region vortex signs are in accordance with the signs given in Figs. 8.25 and 8.26 which is indicated in the experimental results of Freymuth.
The propulsive efficiency of the flapping wing is another concern to the aero – dynamicist. In order to calculate the average propulsive efficiency in one cycle, we have to know the average energy which is necessary to maintain the propulsion and also the average work for the vertical periodic motion. The ratio of the average energy to average work gives as the propulsive efficiency. Accordingly, for a

|
Fig. 8.28 The variation of propulsive efficiency with k
|
|
periodic motion given by za = — h cos xt, with the aid of Eqs. 8.28 and 8.29 we obtain
 /2p/x SUdt F2 + G2 /2p/x Lhdt ~ F
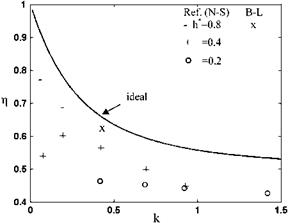
Shown in Fig. 8.28 is the variation of the propulsive efficiency with respect to the reduced frequency k.
The theoretical results obtained for the lift and the suction forces of a vertically oscillating thin airfoil at zero angle of attack are in agreement with the solutions obtained using Navier-Stokes equations for NACA 0012 airfoil in plunging motion (Tuncer and Platzer 2000). Solutions based on the potential flow assumptions and the Navier-Stokes solutions give similar results for the amplitude and the period of both the lift and the suction forces. Naturally, Navier-Stokes solutions also provide viscous and form drags. On the other hand, using the unsteady viscous-inviscid coupling concept and the velocity viscosity formulation the skin friction of the thin airfoil can be determined with numerical solution of the Eqs. 8.5-8.7 with the boundary layer edge velocity Ue = Ue(t) provided by the potential flow as described by Gulcat (Problem 8.28 and Appendix 10). As shown in Fig. 8.28, the difference between the theoretical and the numerical solutions is apparent for the values of propulsive efficiency. The efficiency obtained by the ideal solution is independent of the plunge amplitude, and becomes very high for low frequency oscillations and asymptotically reaches the value of 0.5 for very high frequencies. Obviously, viscous solutions yield lower values of efficiency, and they depend on the amplitude of plunge as shown in Fig. 8.28. The efficiencies obtained with viscous effects indicate that for high plunge amplitude the efficiency values show the tendency to follow the ideal curve. However, for the plunge amplitudes less then 0.4 the efficiencies become small with decreasing of frequencies as opposed to the ideal case, whereas the efficiency obtained with
boundary layer approach is in between the ideal and the Navier-Stokes result. According to Navier-Stokes solutions for the efficiency to be more than 0.5, the condition must be k < 0.6 and h > 0.4.
Previously, we have seen that the dynamic stall takes place at higher angles of attack than the occurrence of static stall depending on the reduced frequency values. The higher the reduced frequency, the more the difference between the static and dynamic stall angles. For a pitching airfoil, the difference between the static and dynamic stall angles Da in terms of the reduced frequency k is given empirically as follows (Prouty 1995)
aDY — aST = Da = yVk, у = 0.3 — 0.5 (8.32)
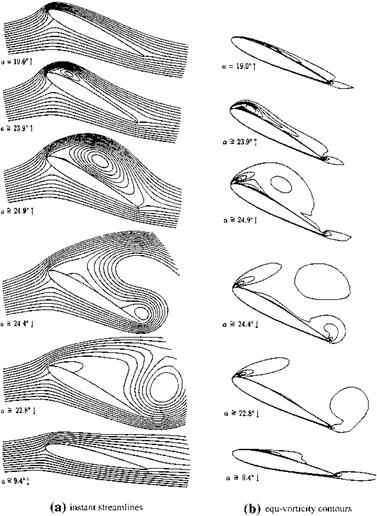
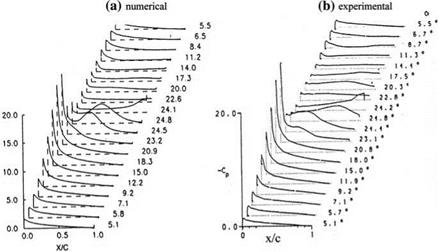
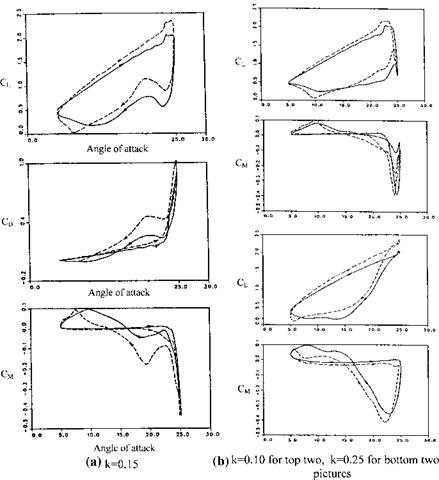
On the other hand, as seen on Fig. 8.6, NACA 0012 profile at the reduced frequency value of k = 0.15 can undergo pitching without flow separation up to 20° angle of attach. Above that, between 20° and 23.5° angle of attack, there is a leading edge separation which generates a vortex causing a high lift until the vortex is convected to wake from the trailing edge. Static wind tunnel experiments show that the flow over the profile separates at 13° angle of attack. The 7° difference between the static and dynamic stall angles is slightly higher than the empirically estimated value obtained by Eq. 8.32 using the lower value of coefficient у. That is to say Eq. 8.32 gives a little bit conservative estimates for the dynamic stall angles of pitching airfoils. The effective angle of attack for the plunging airfoil in a free stream of U becomes zero at the top and bottom locations, and takes its maximum value at the center point. During down stroke the effective angle of attack gives positive lift, and during up stroke it provides negative lift. Now, we can calculate the relation between the effective angle of attack, plunge amplitude and the frequency for an airfoil undergoing vertical oscillations za(t) = —hcos(mt) in a free stream as follows. Since he vertical velocity of the airfoil then becomes Za = hmsin(mt), the effective angle of attack reads as
tanae = -—у = —k(h/b). (8.33)
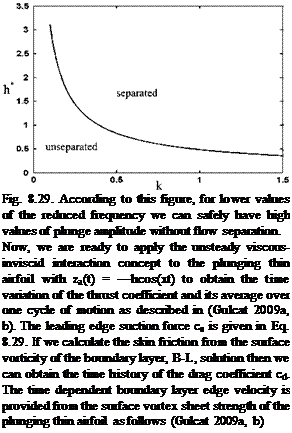
According to Eq. 8.33, the effective angle of attack is proportional with the product of the free stream and the dimensionless plunge amplitude. The dynamic separation angle as given in Eq. 8.32 depends on only the reduced frequency. The airfoil pitching with reduced frequency of k = 1.5 has the dynamic separation angle with aDY = aST + Da = 13 + 21 = 34°. This means at the reduced k = 1.5 the profile can undergo plunge oscillation up to the non dimensional plunge amplitude h/b = 0.45 without experiencing flow separation if we consider the plunging with the effective angle of attack is equivalent to the pitching with the same angle of attack. This assumption lets us apply the potential flow theory for a wide range of plunge rates with boundary layer coupling to take the viscous effects into account.
Using Eqs. 8.32 and 8.33 we can find the maximum plunge amplitude in terms of the reduced frequency for a profile encountering no flow separation as given in
Fig. 8.29 Change of plunge amplitude with the reduced frequency without experiencing dynamic stall
 ) = 1 ±[F(k)sin(ks) + G(k)cos(ks)]kh*p(1 — x)/( 1 + x) . (8.34)
The addition of the suction force and the drag gives us the instantaneous propulsive force coefficient as CF = cs + cd. The time average of CF over one period gives us the definition of the average propulsive force CT as follows:
T
cT = T j CFdt. (8.35)
0
Table 8.1 gives the averaged propulsive force coefficients obtained for various plunge amplitudes with the viscous-inviscid interaction, and compares with the results obtained with N-S solutions for NACA 0012 airfoil at Reynolds number of 105 and the reduced frequency of k = 0.4.
For viscous-inviscid interaction to be applicable at k = 0.4, Eq. 8.32 dictates that the effective angle of attack ae should be less than the dynamic stall angle of NACA 0012, i. e. ad = 12° + 0.3 (0.41/2) & 23°. For angles of attack larger than 23°, as seen from Table 8.1, the viscous inviscid interaction overestimates considerably the averaged propulsive force. The thickness effect is also important in prediction of drag on an airfoil. If the thickness correction (Van Dyke 1956) is
|
Table 8.1 Averaged propulsive force coefficient cT at k = 0.4, Re = 105
|
h*
|
cT, present
|
cT, corrected
|
cT, Ref.
|
ad = as + Da
|
ae = tan (—h /U1)
|
|
0.8
|
-0.129
|
-0.119
|
-0.118
|
23°
|
18°
|
|
1.0
|
-0.205
|
-0.195
|
-0.176
|
23°
|
21°
|
|
1.2
|
-0.298
|
-0.288
|
-0.134
|
23°
|
25°
|
|
made for the NACA 0012 airfoil, the agreement between the viscous inviscid solution becomes very good for the low effective angles of attack.
We know now the capabilities and limitations of viscous-inviscid interaction approach for plunging thin airfoils. Therefore, we can perform parametric studies to predict the average propulsive force depending on the Reynolds number, plunge amplitude and the reduced frequency. The wind tunnel experiments indicate that to obtain a net propulsive force for a plunging airfoil the product of the reduced frequency and the dimensionless plunge amplitude must be higher than a critical value, i. e. kh > 0.2. where the Reynolds number is 17,000 (Platzer et al. 2008). The Reynolds number, however, is also an important parameter to obtain net propulsive force as shown in Fig. 8.30.
The variation of the average propulsive force coefficient, cT for different dimensionless plunge amplitudes h/b = 0.2, 0.4, and 0.6 is given in Fig. 8.30a-c respectively. Figure 8.30a indicates that, for h/b = 0.2 to generate a net propulsive force, the Reynolds number must be greater than 103 and the reduced frequency must be greater than 1.2. If the plunge amplitude is doubled, that is, for h/b = 0.4 according to Fig. 8.30b, for the reduced frequency values greater than 0.5, a net propulsive force is obtained even for a Reynolds number of 103. Moreover, increasing the amplitude to 0.6 gives a net propulsive force for a wide range of frequencies, that is, k > 0.3, and Re > 103 as shown in Fig. 8.30c. A close inspection of Fig. 8.30b, c indicates that when the amplitude is high, the increase in the Reynolds number from 104 to 105, that is, one order of magnitude increase has very little effect on the propulsive force coefficient. Figure 8.31 shows the Reynolds number dependence with kh variation of the net propulsion generation of a plunging thin airfoil. The region above the line indicates propulsion whereas below the line there is a power extraction area which is of importance to wind engineering when performed as pitching and plunging for significant power extraction for clean energy production (Kinsey and Dumas).
Finally, for the plunging airfoil we can give the propulsive efficiency values obtained with the viscous inviscid interaction. Table 8.2 shows the comparison of the efficiency values with the Navier-Stokes solutions of (Tuncer and Platzer 2000).
According to Table 8.2, there is an 8% difference for the efficiency with the viscous inviscid interaction and the full N-S solution at 80% plunge amplitude with respect to the chord. This discrepancy becomes 18% for 100% plunge amplitude because of having high effective angle of attack where N-S solution predicts weak separation at the trailing edge.
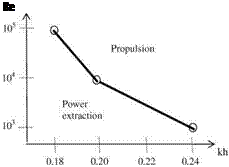
Fig. 8.31 Reynolds number and kh dependence of the propulsion and power extraction
|
Table 8.2 Propulsive efficiency for a plunge at Re = 105 and k = 0.4
|
2 h*
|
gid [4]
|
g
|
g [Ref]
|
Difference (%)
|
ad
|
ae = atan(—h /UM)
|
|
0.8
|
0.668
|
0.641
|
0.59
|
8
|
23 0
|
180
|
|
1.0
|
0.668
|
0.65
|
0.55
|
18
|
23 0
|
210
|
|
So far, we have seen in a detail, lift and propulsive force variations of a plunging airfoil as a one degree of freedom problem. As a result, at zero angle of attack, the lift created is positive during down stroke and negative during up stroke to give zero average value, and the propulsive force is generated for a certain range of kh values and Reynolds numbers if we take the viscous effects into consideration. In order to obtain positive lift throughout the flapping motion two degrees of freedom, i. e. pitching and plunging becomes necessary for the airfoil. We can impose a pitching plunging motion on the airfoil for which the lift is always positive because of effective angle of attack if we describe the pitching with a, the plunging with h and the phase difference between the two with y as follows:
 h = —icosmt a = a0 + hcos(rot + y)
The unsteady motion of the airfoil given by Eq. 8.36a, b the effective angle of attack at the leading edge of the airfoil reads as
where d is the distance between the leading edge and the pitch axis. If we consider the pitching over a constant angle of attack, during up stroke if we let the angle of attack increase and during down stroke let the angle of attack decrease then we can have an effective angle of attack always positive during the forward flight given by Eq. 8.37, which yields positive lift throughout the pitch and plunge. Now, we can illustrate the whole motion on a simple figure as the superpositioning of Eq. 8.36a, b, as depicted on Fig. 8.32a, b during (a) down stroke, and (b) up stroke.
According to Fig. 8.32, during (a) down stroke, and (b) up stroke, the effective angle of attack shows very little change. If we can keep the effective angle of attack given by Eq. 8.37 lower than the dynamic separation angle, we can use the viscous-inviscid interaction to predict the propulsive and the lifting forces of a pitching plunging airfoil. Problem 8.29. Detailed numerical studies of a pitching plunging airfoil were given in late 1990s as Euler and Navier-Stokes solutions at Re = 105 (Isogai et al. 1999), and comparison is made with the Lighthill’s
potential solution. Isogai et al. studied the motion of NACA 0012 airfoil in dimensionless plunge amplitude of 1.0, angle of attack amplitude of 20°, pitch axis location as the midchord, and the phase angle as 90° to calculate the propulsive force coefficient and the efficiency in terms of the reduced frequency k. Naturally, the highest efficiency is obtained with potential theory, and the Euler and N-S solutions yield less values of efficiency respectively at k values ranging 0.5-1.0. As it happens for the case of pure plunge the efficiency decreases with increasing k for the pitch-plunge case. As k changes in 0.5-1.0, the efficiency of the potential flow ranges in 0.85-0.75, Euler solution gives 0.8-0.6, and N-S yields 0.7-0.55, respectively. For the Navier-Stokes solutions, there is no significant efficiency variations for laminar and the turbulent cases. At the same range of reduced frequency, the propulsive force coefficients vary between 0.4-0.6 for the potential solution, 0.35-0.75 for Euler, and 0.3-0.6 for N-S solutions. These results indicate that the propulsive force coefficient increases with increasing reduced frequency. The Navier-Stokes solutions performed by Tuncer and Platzer (1996) under similar flow conditions agree well with the work of Isogai et al. However, at phase difference of 30°, there is a discrepancy between two approaches as far as the leading edge separation of the solution given by the latter is concerned.
As indicated with Eq. 8.27, pure plunging always creates a leading edge suction which yields a propulsive force. However, it is not so for the pure pitching motion of an airfoil because of the phase lag between the angle of attack a and the lifting force L. This phase lag may yield negative average propulsion, i. e. drag even with potential flow analysis, depending on the position of the pitch axis a for all ranges of reduced frequency. Let us consider the pure pitching motion with a = acos(rnf + u), wherein only the second term of the right hand side of Eq. 8.36a, b is considered. The averaged propulsive force from Eq. 8.27 and 8.31 with the aid of (Garrick 1936), and with small correction, reads as

4; (k; a) = p(F2 + G2)
Shown on Fig. 8.33 are the curves for the averaged propulsive force coefficients plotted against the inverse of the reduced frequency.
According to Fig. 8.33, by definition, negative values of averaged propulsive force indicate propulsion whereas the positive values mean the fluid extracts power from the pitching airfoil. For the pitch axis at three quarter chord, i. e. a = 1/2, at all values of reduced frequency there is not any propulsion predicted. At large values of k the pitching about the leading edge a = — 1, the quarter chord point a = —1/2, the trailing edge a = 1, and the mid chord a = 0, we observe that it is not possible to generate propulsion. However, for small values of k, i. e. k < 1, we see that except for a = 1/2, generation of propulsive force is possible. Therefore, according to the ideal theory, if we want to have contribution to the propulsive force from the pitching, it is necessary to choose a proper pitch axis as well as the
 |
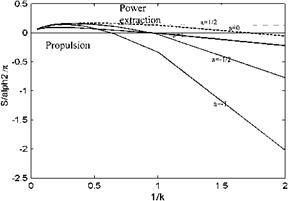 |
reduced frequency range for o pitching plunging airfoil. This adverse effect of pitch axis location on the propulsive force naturally alters the propulsive efficiency. The ideal efficiency formula for the pitching plunging airfoil, Eq. 8.36a, b, with the phase difference of u can be obtained as
_ /0 ^ SUdt ^ ah*2 + (a2 + b2)a + 2(a4 + b4)h*a 394
g /2p/x (Lh + Ma)dt c1h*2 + c2 a2 + 2c4h* a ‘
where:
a4 — a1 [1/ksin(u) + (0.5 — a) cos(u)] — 0.5Fcos(u) — 0.5Gsin(u),
b2 — —0.5a — F/k2 + (.5 — a)G/k, b4 — 0.5(.5 + G/k)cos(u) — F/ksin(u),
C1 — F, C2 — 0.5(0.5 — a) — (a + 0.5)[F (0.5 — a) + G/k],
C4 — 0.5(0.5 — 2aF + G/k)cos(u) + 0.5(F/k — G)sin(u).
Knowing that the pitch may hamper the propulsive efficiency we have to choose the pitch axis with caution as well as the phase between the pitch and plunge. Equation 8.39 gives the ideal propulsive efficiency g = 0.87 for a flat plate pitching about mid chord with k = 1, h* = 1.5, a = 15° and u = 75°, whereas g = 0.54 is computed with N-S solution for NACA 0012 airfoil at Re = 104 and with the same flow parameters (Tuncer and Platzer 2000). There exist further studies, based on the N-S solutions, to optimize the efficiency and/or thrust in terms of plunge magnitude, pitch magnitude and the phase lag (Tuncer and Kaya). Tables 8.3 and 8.4 show the comparison of the optimized propulsive efficiency computed using N-S solutions for NACA 0012 airfoil at Re = 104 with the ideal efficiency calculated using Eq. 8.39 for an airfoil pitching about its midchord.
|
Table 8.3 Propulsive efficiency for a plunge at k = 0.5
|
2 h*
|
gid (%)
|
g [Ref]
|
Difference (%)
|
h
|
u
|
|
0.45
|
73
|
58.5
|
20
|
15.4°
|
82.4°
|
|
0.57
|
79
|
63.8
|
20
|
21°
|
86.7°
|
|
According to Tables 8.3 there is a 20% difference in the ideal efficiency and the efficiency evaluated with N-S solutions, and the efficiency increases with increasing pitch amplitude. Furthermore, solving for maximum efficiency may not yield a good thrust coefficient as well as searching for maximum thrust may not produce very high efficiency.
Now we are ready to give examples to evaluate the effective angle of attack of a pitching plunging airfoil for various h, a and k values for which dynamic separation angles are larger than the effective angle of attack.
Example 8.5 Assume an airfoil pitching about its leading edge and plunging with k = 0.35 as follows
h = 1.1cos(xt) a = 10° + 10°cos(x + n/2)
Solution: Since the reduced frequency is given we describe the motion in reduced time with following equations:
h = 1.1cos(ks) a = 10° + 10°cos(ks + n/2)
Taking d = 0 for Eq. 8.37 gives the expression for the effective angle of attack ae = ae(s), whose plot for a period of motion is given as follows:
According to Fig. 8.34, the effective angle of attack remains less than 23° which is under the dynamic separation angle given for NACA 0012 profile with Eq. 8.32. That means the profile can undergo high amplitude pitch and plunge without encountering separation. During down stroke, the angle of attack gets smaller but the relative air velocity in vertical direction causes increase in the effective angle of attack. During up stroke, however, the increase in angle of attack makes the effect of the negative vertical air velocity vanish. As a result of this pitch and plunge it becomes possible to have an unseparated flow throughout the motion because of having the effective angle of attack under 20°. At the same time, the angle of attack and the effective angle of attack remains positive to yield a positive lift. It is necessary to make a note here that according to Fig. 8.33 the propulsion due to pitch is also favorable because of pitch axis location and the k being 0.35.
|
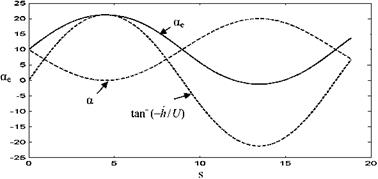
Fig. 8.34 The effective angle of attack ae variation with reduced time s
|
Example 8.6 The NACA 0012 airfoil is pitching and plunging with a reduced frequency of 1 as given below
h = 0.65cos(xt) a = 20 – b 20 cos(xt – b p/2).
Show that the effective angle of attack remains under the dynamic separation angle of attack.
Solution: The dynamic separation angle of attack is found as
acr = 13° + 0.3л/k * 180/p = 30°. In terms of reduced time s it reads as
h = 0.65cos(s) a = 20° + 20° cos (s + p/2).
The superposition of pitch and plunge gives us the effective angle of attack less than 30° as shown in Fig. 8.35. Since the effective angle of attack remains above 10°, the instantaneous lift is always positive and relatively high. As seen from Fig. 8.35 during the flapping motion relative to free stream the angle of attack changes between 0° and 40°.
The results of Examples 8.5, 8.6 indicate that: (a) for low reduced frequencies, i. e. k 1, pitching with small angles of attack and plunging with high amplitudes and with 90° phase angle we obtain effective angles attack less than the dynamic separation angle, (b) for k > 1 with small plunge amplitudes and large angles of attack, flapping without exceeding the dynamic separation angle is possible.
So far we have studied the pitch plunge motion of an airfoil prescribed as simple harmonic motion. However, a nonsinusoidal motion of the flapping airfoil is also observed to yield sufficient propulsive force through path optimization (Kaya and Tuncer 2007). In their study Kaya and Tuncer used B splines for the periodic flapping motion. They showed that thrust generation may significantly be increased, compared to the sinusoidal flapping, with the characteristics of the path for optimum
|
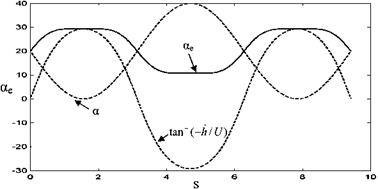
Fig. 8.35 High lift and high propulsion with high reduced frequency pitch and plunge
|
thrust generation staying at about constant angle of attack at most of the upstroke and downstroke, while pitching is happening at extremum points of plunge.
We know now that in order to create a propulsive force we need to create a reverse Karman vortex street at the wake of the oscillating airfoil. The creation of the reverse Karman street is possible either with attached flow or with flows creating strong leading edge vortices which in turn generate appreciable leading edge suction. If the leading edge vortex formed, because of angle of attack exceeding the dynamic separation angle, does not burst at the trailing edge, it will create considerable suction at the upper surface which will help for propulsion and lift as well. As seen in Figs. 8.6 and 8.7, the N-S solutions which are in agreement with experiments, show increase in lift although the dynamic separation angle is exceeded by 30-40. Further increase in the angle of attack creates bursting of the vortex at the trailing edge to cause lift lost. However, if the reduced frequency is increased above 0.15 it is possible to go to higher angles of attack without causing vortex burst at the trailing edge (Isogai et al. 1999). At high Reynolds numbers, laminar or turbulent, it is possible to create a propulsive force without resorting to high angles of attack. On the other hand, at low Reynolds numbers, i. e. Re < 1,000, the pitching motion may provide propulsion at low frequencies if the angle of attack exceeds 200. For this case maximum thrust is achieved in 450-600 angle of attack range (Wang 2000).
The last aspect of the pitching plunging airfoil to be briefly mentioned here is the power extraction from the oscillating airfoil (Kinsey and Dumas 2008). This time rather than having propulsion with the unsteady motion which is provided by the energy of the fluid, the energy will be given to the fluid by the motion of the airfoil to generate power which is useful in harvesting wind energy. The pitch plunge motion here is conventionally defined with a(t) = a sin(xt), and h = asin(xt + u) with the approximate definition of the feathering parameter (Anderson et al. 1998; Kinsey and Dumas 2008)
a
tan-(xh/U)
which is approximately associated with propulsion for v < 1, whereas v > 1 corresponds to power extraction, and naturally, v = 1 yields neutral motion called feathering for which neither propulsion nor power production exist. If the average power extraction coefficient over a cycle due to plunge and pitch combined is denoted with Cp then the power extraction efficiency reads as
P – b
g = it = Cpt (8.41)
Pd h
where P is the total power produced and Pd is the total power of the oncoming flow passing through the swept area during plunge. The power extraction efficiency is theoretically limited by 59% from a steady inviscid stream tube, whereas Kinsey and Dumas report about 33% efficiency and almost 2.82 average total force coefficient for NACA 0015 airfoil pitching about its 1/3 chord with b/h = 2, a = 76.33° and k = 0.56 at Reynolds number of 1100.



 Fig. 8.43 Starting and stopping vortex generated during the downstroke
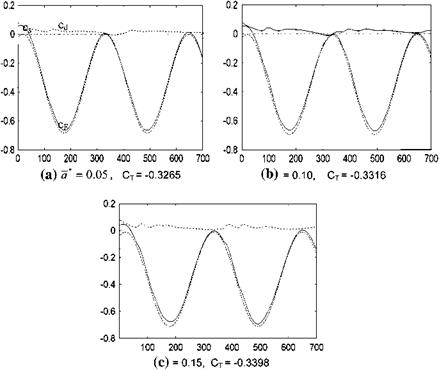
 Fig. 8.38 Body fixed x-y coordinates, and body fitted П-g coordinates for a parabolically cambered thin airfoil
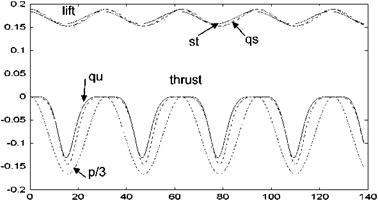

 Fig. 8.24 Lift ci and the suction force cs coefficient changes with the vertical motion h of the profile
 (8.30)

 ) = 1 ±[F(k)sin(ks) + G(k)cos(ks)]kh*p(1 — x)/( 1 + x) . (8.34)
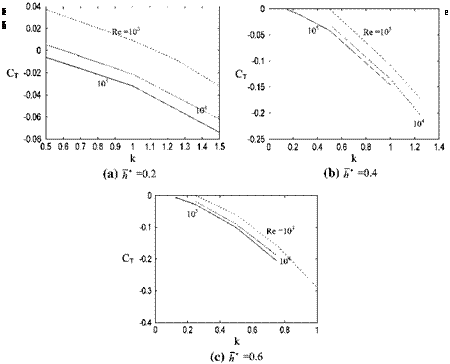


 Fig. 8.14 Wing rock with three degrees of freedom: roll, side sway and plunging

 k=m b/U
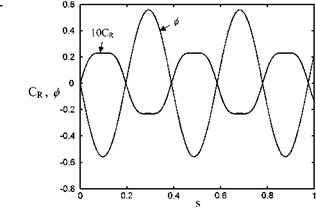 Fig. 8.16 Change in restor ing force for the wing rock 10Cr and ф by time




 Kp — 2Ch/(AU sina).





 conical shock surface