Category Helicopter Test and Evaluation

Endurance performance

The maximum endurance is obtained at a flight condition that results in the lowest fuel flow rate or minimum fuel consumption. The basic theory is simple: for constant SFC the fuel flow rate (G) is directly proportional to power required and therefore the

image51

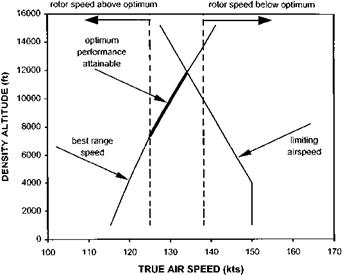
Fig. 3.8 Flight conditions required for optimum range performance (5500 kg).

image52

RANGE PERFORMANCE (VIP)

Fig. 3.9 Achievable range performance.

true airspeed for maximum endurance (VME) occurs at the speed for minimum power, see Fig. 3.10.

Flying at best range speed

Figure 3.5 shows typical curves of referred power (P/am3) against referred TAS (V/m). Assuming constant specific fuel consumption and ignoring the effects of referred RRPM (m/J0), this figure can be used to determine the ranges of altitude, RRPM and TAS that will ensure maximum SAR at any weight. Since SFC is constant then SAR will be directly proportional to V/P.

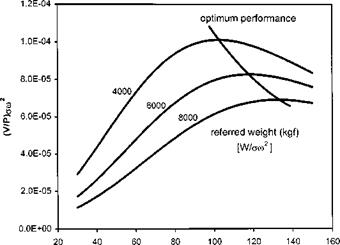
If referred TAS is divided by referred power then a trend that indicates the variation of SAR with referred weight (W/am2) can be produced, as shown in Fig. 3.6. From

image48

Fig. 3.5 Variation of referred power with referred weight and TAS.

image49

REFERRED TRUE AIR SPEED (kts) [V/m]

Fig. 3.6 Variation of referred SAR function with referred weight and TAS.

this figure it is possible to determine the optimum value of Varn2 /P and the referred TAS at which it occurs for each referred weight.

Suppose the flight conditions required to ensure maximum range at an actual aircraft mass of, say, 5500 kg are to be determined. The pilot can change airspeed, NR and altitude (relative density) therefore the variation of V/P with am2 must be evaluated. Using the optimum Vam2/P and Wlam2 data obtained from Fig. 3.6 it is

image50

Fig. 3.7 Variation of SAR function with referred weight and TAS.

possible to plot the variation of V/P with am2 for a particular mass, see Fig. 3.7. This figure shows that, for a given weight, there is a unique value of am2 which will give the highest V/P and the best range performance. In other words, for each actual weight there will be a unique referred weight (Wlam2) or CT which will give the best range performance. The practical outcome of this situation is that to ensure maximum SAR the pilot must change altitude as fuel is burnt and adjust rotor speed to suit the prevailing ambient conditions.

Consider the choice of range TAS. From Fig. 3.6 the variation of V/m, for best range, with Wlam2 can be determined. This relationship can be used to select the TAS for each actual weight as density altitude is increased using practical rotor speeds. In this way even though the range performance may be sub-optimal due to power-on RRPM considerations the most appropriate range speed is being used. However, if airspeed limitations, perhaps due to airframe or rotorhead stresses, are introduced it can be seen that the range performance may be further reduced by the inability to fly at a high enough TAS, see Fig. 3.8.

The combined effect on VIP (or SAR) of imposing power-on RRPM and TAS limits is also shown in Fig. 3.9. It can be seen from this figure that the optimum range performance is only achieved at low weight and high density altitude, or at high weight and low density altitude. Nonetheless, even when flying optimally at high weight the actual SAR will be lower than that recorded at lower weights.

Factors affecting range performance

Consider now the change in power required as weight is increased at constant true airspeed, V. The rotor thrust, T, must rise correspondingly and this will cause an increase in the inflow velocity, vi. In addition, if the higher collective setting required at higher AUM leads to increases in drag due to Mach effects (reducing Mcrit) then CD will rise above its nominal value. Therefore the power required must increase with weight and consequently the SAR will reduce. So:

SAR ё W

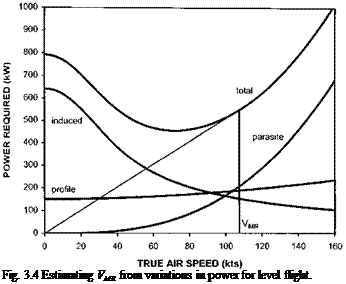
Alternatively, consider the variation of power required with true airspeed for a given weight. At a fixed weight the thrust required will be approximately constant assuming a modest parasite drag coefficient. Therefore the induced velocity will reduce as airspeed increases whereas the parasite power increases rapidly and the profile power increases but at a more gentle rate. Consequently the overall trend in the total power required is the familiar U-shaped curve. This curve can be used to determine the speed for best range (VMR) since a line drawn from the origin to a point on the curve is proportional to PIV. Therefore the lowest P/V (highest SAR) will occur at the point where the line is tangential to the curve, see Fig. 3.4.

It is instructive to determine the factors that affect VMR. Typically the maximum range speed will be in the moderate to high forward speed bracket so the high-speed approximation may be used:

— vh — W

V — V — 2pAV

Thus the total power required can be written as:

W2 1 1

P — 1.22PAV + 2 P V 3f + 8 pbcRV3 (1 + 4.3ц2 )CD

Now maximum SAR will occur at the speed at which P/ V is a minimum, that is when:

Подпись: = 0

Подпись: Fig. 3.4 Estimating VMR from variations in power for level flight.

A P

dV V

Подпись: A P dV V Factors affecting range performance

If it is assumed that the profile drag is approximately constant with speed then:

Factors affecting range performance

Then:

VMR ё VW

So the speed for best range, assuming SFC and profile drag is approximately constant, will be proportional to JW

Range performance

As will be seen, the ability of a helicopter to cover distance efficiently depends on the forward airspeed flown. This dependence is overcome by expressing the range perfor­mance of an aircraft in terms of its specific air range (SAR). Specific air range is defined as the distance covered (nautical miles) per unit of fuel and typical units are nm/kg or nm/lb. Now the distance covered at constant TAS (V) is given by Vt, where t is the time spent in the cruise condition. Likewise, the total fuel burn will equal Gt, where G is the fuel flow rate. So the definition of specific air range becomes:

„ distance covered Vt V

SAR =_______________ —__ —__

mass of fuel used Gt G

Introducing the specific fuel consumption (SFC), s, which is the fuel flow rate per unit power (kg/kW h), gives:

Подпись: SARV — V_ G — sP

The power required for level flight can be divided into four components: the induced power (Pi); the parasite power (Ppar); the rotor profile power (Ppr), and the power required to drive the tail rotor, accessories and overcome transmission losses (Plosses). If the lost power is assumed to always equal a small and fixed percentage of the total power required, then:

SAR B s(P + Ppar + Ppr)

An important factor in the analysis of range performance is the variation in SFC. However, if it is assumed to be constant over the range of interest then SAR can be related directly to the variation of power required with TAS. Specific air range will be a maximum when VIP is a maximum or when P/V is a minimum. Consequently, in the absence of any variation in SFC the speed for maximum range may be obtained
from the power curve. It has already been shown that for a simple helicopter the power required by the main rotor can be expressed in the following form (Equation (2.17)):

Cp — Cpj + Cppar + Cppr + Cpm + Cps

Using typical empirical data, assuming small disk tilts and neglecting the effects of reversed flow, compressibility and blade stall:

1 f 1

CP — 1.2C + 2 ц3 A + 2 5Cd(1 + 4.3ц.2)

Подпись: P — 1.2W Range performance Подпись: 1 +4JIV Подпись: 2 Подпись: C

or:

Thus, the range performance will depend in some manner on the weight of the helicopter, the rotor speed, the external configuration and the true airspeed.

Choice of suitable test site(s)

It is important to note that the range of available values of the referred parameters may be severely limited by the geographical position of the test site. When planning a test, therefore, the test team needs to determine the full range of all the relevant quantities (Hp, OAT, AUM, IAS, ROC/ROD, NR) that may be experienced in operation. From this information, the required range of the referred parameters is derived. Having omitted any combinations of parameters that do not correspond with practical flight conditions, a test site must be chosen that provides the most suitable range of atmospheric conditions. Note that certain combinations of referred parameters need not be tested, such as a maximum value of W/8 and a minimum value of m/^9 as one represents the highest and the other the lowest operational altitude. It may be necessary to choose, or at least recommend, two or more sites so that the full range of test conditions is obtained.

1.4 LEVEL FLIGHT PERFORMANCE TESTING

Helicopters, along with most other air vehicles, spend a significant amount of time in a cruise configuration. Depending on the role of the rotorcraft, it may be required to cover the greatest distance or remain aloft for the maximum time on a given quantity of fuel. In order to determine the optimum airspeed for either requirement it is necessary to gather level flight performance test data. There are standard methods for measuring and presenting the performance of turbine-engined helicopters in terms of referred parameters [3.4].

Although it is common practice in a limited test programme to document simply the torque required, two major advantages accrue if a full set of engine performance data is gathered in the initial phase of a large test programme. Assumptions based on
constant SFC can be relaxed; and complex fuel massflow measuring equipment need not be fitted on subsequent trials as the variation of fuel burn with power and engine life will have been determined.

It is important that the performance of a helicopter in level forward flight throughout its speed range is well documented. Power required and fuel usage information is needed to determine the helicopter’s suitability for a given role, to check the perfor­mance against specification requirements, and to provide data for inclusion in the Operating Data Manual (ODM). Generally, a test establishment will carry out spot checks of the helicopter manufacturer’s data but occasionally a full performance evaluation will be required covering a wide range of conditions of AUM, altitude, outside air temperature (OAT) and rotor RPM.

The helicopter operator will use the ODM performance data to determine optimum altitudes, airspeeds and rotor speeds to fly for maximum range and endurance under all likely conditions of AUM and OAT. In addition, the maximum and minimum level flight airspeeds available under given conditions and the achievable range or radius of action will be obtained from this published data.

The Wlam1 method

The task of deciding the pressure altitude required to establish a desired referred weight is complicated in this case by the additional requirement to account for the prevailing air temperature profile. Since this profile can only be estimated prior to flight, any planning tool can only be used to predict the required altitude. A final check on the actual referred weight at the instant the test conditions are established will be required. Suppose that the test aircraft has a standard rotor speed of )0 and that data is required at some other rotor speed ()). The relative rotor speed (m) is therefore obtained from:

m =

Now suppose that a test flight is to be conducted using a take-off weight of WTO and that data is required at a referred weight (W/am2) of WREF. At any point in the sortie, if the fuel burn is WFUEL then the relative density required for the desired W/am2 is given by:

( WTO ~ WFUEL)
WREF m2

Given an estimate of the temperature profile it is possible to determine the pressure altitude at which the required relative density is likely to occur. Test planning using this concept is more readily achieved by graphical means. The relative density at any pressure altitude is obtained from standard atmospheric equations and compared with that required for the test point(s). The atmospheric equations are:

5 = (1 – 6.8756 X 10 -6Hp) 5-2 5 59

h T + 273.15
= 288.15

5

a = 0

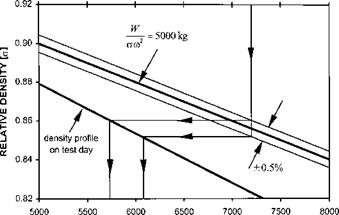
Figure 3.3 shows how test requirements can be plotted for ease of pre-flight planning. The example shows the pressure altitude range for the desired referred weight +0.5%.

START MASS 4500 kg FUEL GONE (kg) ш = 1.00 at all times

0 50 100 150 200 250 300

image46

PRESSURE ALTITUDE (ft)

Fig. 3.3 Planning chart – W/стю2 method.

The style of planning chart shown in Fig. 3.3 has been successfully used to test helicopters with fixed rotor speed () = )0 at all times) as well as those that feature a ground adjustable datum rotor speed. It cannot be used, however, if the test requires maintenance of m/^9 as well as W/am2 since in adjusting the rotor speed to set m/^9 the referred weight will be altered. The requirement to obtain performance information at constant m/^9 and W/am2 occurs quite often, especially during the evaluation of tip effects (TE). In these situations an alternative approach is required. As mentioned earlier, if the test team can adjust the rotor speed in flight then the W/8 method may be used. Noting the relationship between W/8 and W/am2 gives the alternative method:

W (_mY = _W = W

am2 X y^9J a9 8

Therefore, the desired value of Wlam2 can be converted into a target value of W/8. Provided this value can be obtained and the rotor speed can be adjusted to generate the desired m/^9 at the test altitude then the required value of W/am2 can be tested indirectly.

The W/8 method

Suppose that a test flight is to be conducted using an aircraft with a take-off weight of WTO and that data is required at a referred weight (W/8) of WREF. At any point in the sortie if the fuel burn is WFUEL then the relative pressure required for the desired W/8 is given by:

Подпись: 8 =WTO ~ WF1
W„F

The pressure altitude (in feet) associated with this relative pressure can be found using an inverse form of the ISA atmospheric equation [3.3]:

Подпись: HP =1 _ 8l/5.2559

6.8756 x 10 -6

Figure 3.1 shows an example of a planning chart based on these equations. Determining the effect of outside air temperature on the rotor speed required for a given referred rotor speed can be addressed in a similar manner. Suppose the standard rotor speed is )0, the referred rotor speed required (m/ V0) is mREF and the outside air temperature at the test altitude is T °С, then the relative rotor speed (m) required is given by:

Подпись: m = mREFT + 273.15 288.15

The actual rotor speed associated with this relative RRPM is obtained from:

) = m x )0

Figure 3.2 shows an example of a planning chart based on these equations. Note that the maximum and minimum power-on rotor speed limits might prevent the establish­ment of referred rotorspeeds significantly different from that depicted.

image44

Fig. 3.1 Planning chart – W/S method.

image45

-10 -8 -6 -4 -2 0 2 4 6 8 10

OUTSIDE AIR TEMPERATURE (°С)

Fig. 3.2 Planning chart – ra/V6 method.

Control of the referred groups

The use of the experimental method of data reduction depends on the ability to maintain at least one of the groups constant while varying the others, for example, if the relationship between P/cm3 and V/m is to be investigated whilst maintaining Wlam2 and m/70 constant. In any of the referred groups there is usually at least one parameter which is under our control and which can therefore be used to control the whole group. Table 3.1 shows each group in its referred or normalized form and the appropriate controlling parameter(s).

Table 3.1 Control of the referred groups.

Group

Referred form

Controlling parameter(s)

Forward speed

V

m

V or )

Rotor speed

m

70

) or HP

Weight

W

8

W or HP

Weight

W

cm2

W HD or )

Vertical speed

V

m

Vc or )

Hover height

Z

Z

3.2 PERFORMANCE TEST PLANNING

A typical requirement for a test team is to determine the performance of a rotorcraft under a range of environmental conditions. These are usually quoted as an altitude (X ft Hp) with a given standard atmosphere pertaining (ISA+F°С). The basic function of any performance test plan is therefore to establish sets of test points at the same referred weight (W/8 or W/am2) and/or the same referred rotor speed (m/^0). Assuming that the take-off weight is known and that the helicopter is fitted with accurate fuel-gone indications it is possible to draw up a series of tables or charts to enable in-flight adjustment of altitude to maintain the referred weight constant as fuel is burnt. In addition, if the W/8 method is being used and an accurate rotor speed indicator is fitted, it is also possible to tabulate the rotor speed adjustments required to maintain mQ0 constant as the outside air temperature changes.

Derivation of the referred parameter relationships

Consider now the most general case of a helicopter in climbing flight at low level. As indicated earlier the power required to maintain a steady flight condition will depend

on:

• weight (W)

[MLT ~2

• forward speed (v)

[LT -1]

• rate of climb (Vc)

[LT -1]

• height (above ground level) (Z)

[L]

• local speed of sound (a)

[LT -1]

• ambient density (p)

[ML -3]

• rotor speed ())

[T -1].

Note that local speed of sound has been included as a means of accounting for compressibility effects on the lift and drag characteristics of the rotor blade. So:

P = f(W, V Vc, Z, a, p, )

Using dimensional analysis yields:

Подпись: P = fw) v к Z) pa!

pa4 ’ a’ a’ a ’ )

Derivation of the referred parameter relationships Подпись: f Подпись: Wm2 v к Zm aa4 ’ a ’ a ’ a

This can be rewritten as:

where m = )/)0 and a = p/p0

Noting that a is a function of ambient temperature:

Pm2 _ J Wm2 V V Zm^

a62Ve _ V a02 ’ V ’ V ’ Ve/

where 0 _ T/T0.

Reorganizing and collecting like terms produces the ‘W/a’ referred power relationship:

p _ J_w V V Z _m_^i

am3 lam2’ mm ’V0)

Since measuring air density is difficult, an alternative grouping can be obtained by replacing a with 8/0:

p _ J w v к Z _®_

8V0 V 8 , m, m, ’V0J

This is called the ‘ W/8’ referred power relationship which, although easier to use since it lacks air density, cannot be used for rotorcraft with fixed rotor speed. Note that in both groupings the forward speed and rate of climb have been expressed as advance ratios.

NON-DIMENSIONAL PARAMETERS

The useful performance of any helicopter depends on the amount by which the power available exceeds that required. Helicopter performance is therefore measured in terms of the power required to maintain steady flight for various atmospheric conditions, over a range of weights and external configurations. Engine fuel flow data is also gathered to determine the helicopter’s range performance. It has been shown that the factors affecting the performance of a family of geometrically similar helicopters with similar rotor blade profiles are:

• engine power;

• helicopter weight;

• rotor speed;

• forward speed;

• rate of climb;

• ambient atmospheric conditions.

Although dimensional analysis is used to show how these quantities can be related the basic non-dimensional groupings are rarely used. Since usually the performance of a single model of helicopter is considered at any given time, the linear dimensions of rotor radius, chord and disk area are omitted. For a similar reason ambient pressure, temperature and density are expressed as ratios of the standard sea-level conditions (8, 0, a). Likewise, rotor speed ()) is expressed as a percentage of some reference or standard value ()). This, of course, means that the groups have become dimensional although they still contain the required information. These modified groups are often termed ‘normalized’, ‘referred’ or ‘reduced’.