Category Model Aircraft Aerodynamics

TURBULENT FLOW AEROFOILS

Arising directly out of Schmitz’s researches, Sigurd Isaacson and Georges Benedek designed a whole series of aerofoil sections for use on models. The Wortmann М2 is also of this type. These are all intended to fly with turbulent boundary layers, at low speeds. All are thin. They have enjoyed wide popularity, many modellers use them without knowing their principles and may defeat the designer’s purpose by rounding the leading edge too much during the final stages of sanding before covering the wing. As suggested above, this may not matter much if there is covering sag behind the leading edge, but in some cases the inaccuracy may cause a deterioration of performance.

The Seredinsky type of wing (Fig. 8.6) resembles the wing profile of some larger soaring birds. Although difficult to construct, it may prove very effective on smaller models, or models with very high aspect ratio, and hence small wing chords. The leading, edge is similar to that of a simple curved plate, but the thickening of the profile on the underside provides room for a strong main spar without much effect on the upper surface flow.

Some of the Benedek aerofoils are intended for the Jedelsky type of structure, in which the necessary strength and stiffness is obtained by building the whole wing of solid balsa

sheet, thick at the front with a thin sheet over the trailing portion, stiffened by ribs but without tissue covering. There is no doubt some penalty in higher drag on the underside of such profiles, but this may be acceptable if the aerofoil is more efficient at low Re. Unfortunately no wind tunnel tests have been published on such profiles (Fig. 8.7).

THE EFFECTS OF STRUCTURE AND SURFACE

Models constructed on traditional lines may in effect have turbulators built in. The sag of tissue or other thin covering behind the leading edge spar between the ribs creates a bump in the profile. This may have an entirely beneficial effect on transition, and the good performance of some models can be explained only in this way. Among his tests on the Gd 801, Kraemer included tests of a paper-covered model which showed that sub-critical flow prevailed down to Re 42,000, comparable with the same aerofoil with a turbulator wire. Wind tunnel results on a number of balsawood and tissue covered wings, carried out at Stuttgart University and reported by Dr. D. Althaus (Profilpolaren fur den ModeUflug, Vol. 2) have shown the same effect at free flight model wing sizes and speeds. This suggests that attempts by modellers to preserve very accurate profiles over the front part of low speed model wings are sometimes misguided. The simple tissue-covered leading edge may prove more efficient than one with smooth sheet balsa covering, especially if the wing profile used is on the thick side with a large leading edge radius. It should be emphasised, nevertheless, that when the model is large enough or fast enough to avoid sub-critical Re problems, turbulators and surface irregularities at the leading edge cause drag to rise and ci max. to fall. This may be confirmed by study of Appendix 2.

SEPARATION BUBBLES

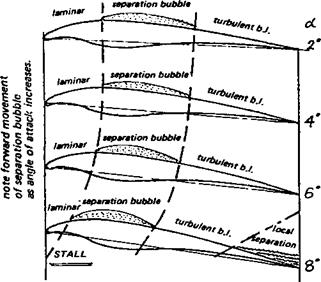
Schmitz did not investigate in detail the size of separation bubbles over his aerofoils, and as shown in Fig. 8.2., these may be very extensive. The Go 801 profile tested by Kraemer is of smaller thickness than the N-60 (10% as against 12.6%). It has a slightly smaller nose radius, but greater camber (7% at 35% compared with 4% at 40%). It thus comes somewhat closer to the thin curved plate profile, and its critical Re is slightly lower than that of N-60. Some detailed measurements made by Charwat at the University of California in 1956 -57 showed that a profile of the shape shown in Figure 8.6, with the small nose radius of 0.7%, also exhibited separation bubbles very similar to those of the 801 profile. The aerofoil in this case, designed by Seredinsky, following one of Schmitz’s suggestions, was based on a prefile of orthodox type, but the underside of the leading edge was cut away to try to produce a profile with room for wing spars, yet with the advantages of a small leading edge radius. In these tests, a separation bubble formed over about 35 to 40% of the chord. Above 7° angle of attack the bubble moved forward. Turbulent flow separation occurred over the rear of the profile prior to the stall, but the profile worked well. The effect of the separation bubble’s formation and movement is of considerable significance. The bubble is sufficiently large to divert the main airstream over the upper surface round a longer path, just as if the profile was more cambered. It has been established that a profile with the maximum camber point well forward develops a high maximum lift coefficient. (This was the reason for the NACA 210 camber form.) The result of this effective camber increase together with bubble movement forward at high angles of attack, is to increase the slope of the lift curve (compare Chapter 5) above that ‘ which is predicted by theory. Such evidence as there is from model operations tends to confirm that some aerofoils on A 2 sailplanes behave erratically. This may be attributable to shifting of the separation bubble, and its flattening effect on the chordwise pressure curve, to and fro on the wing as the angle of attack varies slightly. The fluctuating

pressures over the profile cause sharp changes of the pitching moment which, as shown in Chapter 7, is already large because of the high camber of such wings. The hysteresis loop is caused by the bursting and re-forming of the separation bubble. A model in this critical Re region, capable of stable flight in smooth ‘air, may become uncontrollable in rough conditions. These factors come together with the inherently pitch-sensitive qualities of the high aspect ratio wing to make the model sailplane operator’s difficulties more severe. Providing these problems can be overcome, there is no doubt that, for high performance at low wing Re, thin, small leading-edge-radius profiles, appropriately cambered, are excellent

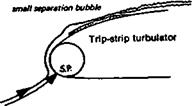
By adding turbulators to thicker profiles, the low speed performance may be greatly improved, and even with the specialised ‘low critical’ profiles turbulators may be very useful. The turbulators used by Schmitz and others were usually wires mounted ahead of the leading edge on light outriggers; suitable positions for these are indicated in some of the diagrams in Appendix 2. For practical models, wires may be replaced by thin elastic or plastic strings. These are, however, rather a nuisance in operation, and the leading edge ‘trip strip’ may be easier to manage. Such strips have the advantage that they may be lightly pinned or ‘tack glued’ in various positions for trial, and moved or changed in size to give best results. If the critical Re of the profile chosen is already low turbulators cannot have much influence on still air performance. However, by triggering separation at a fixed point on the wing, they probably stabilise the position of the separation bubble, reducing the fluctuations of moment coefficient The result should be an improvement in

Fig. 8.6 Separation and re-attachment on the Seredinsky aerofoil

*** Seredinsky^ ‘————————– Re 38000

[observed by A. Charwat. 1957]

controllability of the model. A great deal of work has been done in ‘full-sized’ wind tunnels to determine the minimum size of such trip strips so that they are just big enough to cause transition to turbulent flow without causing wholesale flow separation. (This is because wind tunnel tests at low Re are not applicable to fiill-sized aircraft without such control of the boundary layer transition point) For models, the best approach is that of systematic practical trials with turbulators of varying type and size in various positions.

TURBULATORS

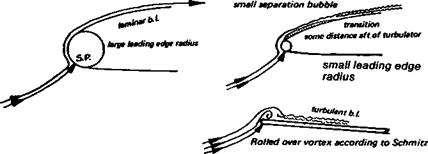
The effect of the sharp leading edge is very similar to that of a turbulator wire in the main stream ahead of the leading edge. A similar effect is obtained by mounting, on or just behind the leading edge, a raised ‘trip strip’ or leading edge turbulator, which may be of various forms and sizes. In each case, what is required is a brief separation bubble followed by turbulent re-attachment downstream. A ‘turbulator’ which is too small will not achieve the early transition, but one which is too large may itself cause flow separation.

Once the boundary layer has been forced into turbulence, it remains important that it should not separate from the upper surface. A profile with a turbulator or sharp leading edge still requires the air to flow against an adverse pressure gradient once it has passed the minimum pressure point A thin profile presents a less formidable task to the boundary layer, so separation may be avoided, on die upper surface. On the underside, at high angles of attack flow separation is unlikely since once the point of maximum pressure is passed, the flow speeds up and tends to follow the surface of a thin profile closely. At low angles of attack under-side separation is very likely behind the leading edge, but re­attachment is still probable before the trailing edge (compare Fig. 2.3).

THE LEADING EDGE RADIUS

The reason for the low critical Re of thin profiles was, Schmitz argued, their combination of very small nose or leading edge radius and relatively small upper surface curvature. The stagnation point of the airflow near the leading edge of a wing at a positive angle of attack is, as Figure 2.2 shows, always slightly below the geometric leading edge. The boundary layer thus begins its journey over the upper surface by flowing around the leading edge itself. At high angles of attack, the flow in this neighbourhood is even slighdy upstream (Fig. 8.5). From near stagnation, the boundary layer thus moves towards a low pressure region on the upper surface, and accelerates. If the profile has a smoothly rounded leading edge of large radius, as thick aerofoils usually do, the boundary layer can follow this curve easily and remains laminar. If the leading edge radius is small, as on thin profiles, the boundary layer is compelled to flow round a very sharp curve or even a knife-like edge, changing direction very sharply while accelerating rapidly towards the low pressure point which, on profiles of this early kind, lies only a small distance behind the leading edge. The boundary layer inertia may be expected to overcome the viscous forces at the sudden change of direction, and separate from the wing surface. It re­attaches immediately the comer is passed, but a very small separation bubble, or what

Schmitz called a ‘rolled over vortex’ forms in the boundary layer. The small leading edge radius thus introduces some artificial turbulence into the airflow, and this encourages early transition. The transition and re-attachment is not instantaneous. A separation bubble forms, and the boundary layer re-attaches some distance aft of the leading edge.

THE CRITICAL REYNOLDS NUMBER OF AEROFOILS

Detailed wind tunnel results for the Gottingen 801 profile are given in Appendix 2. For any aerofoil of this type, there is a critical wing Reynolds number at which separation is followed by re-attachment Above this Re, the wing will work well, below it, it will be very
inefficient A model with such a profile below critical Re will hardly be capable of flight.

The first important investigation of wing profiles at model aircraft values of the wing Re were made at Cologne during the late nineteen thirties by F. W. Schmitz. His book, Aerodynamik des Flugmodells (Aerodynamics of Flying Models) published in 1942 remains a classic.* Because of the war Schmitz’s work did not become generally known ■until after 1946, but since then his recommendations have been widely accepted and further work by K. Kraemer and G. Muessman and many others more recently, has tended to confirm and amplify most of Schmitz’s original findings. This has led to the concentration of effort by modellers on aerofoil profiles with low critical Reynolds numbers. Techniques and devices have been adopted which ensure that the boundary layer over small model wings is made turbulent as early as possible. This causes an increase in skin drag, but this loss is far less significant than the prevention of early flow separation on the grand scale indicated by Figure 8.3.

8.2 HYSTERESIS

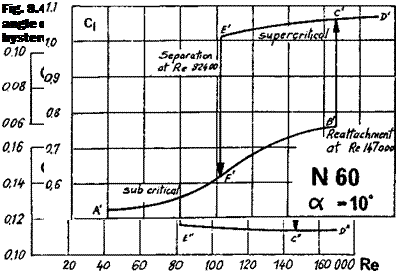
One of Schmitz’s original diagrams is reproduced in Figure 8.4. An accurately made model of the N-60 was suspended in a wind tunnel and the speed of the tunnel fan was gradually increased to give a rising Reynolds number. Coefficients of lift, drag and pitching moment were measured stage by stage. Consider first the lift curve (Cl). The flow is sub-critical, completely separated, at the lower Re values, and although the lift improves slightly as the Re rises, the super-critical condition does not arrive until Re 147,000 when die curve leaps to a higher value. In the drag diagram (C<j), there is a corresponding sudden fall. This marked change of efficiency is indicative of re-attachment of the flow, and is accompanied by a change of the pitching moment In the next test, the flow speed was gradually reduced, and, as before, the coefficients were measured at each stage. This time, super-critical flow continued down to Re 82,400, as shown by Schmitz’s curve C’ to E’. Then, with little warning, the flow separated and the lift collapsed, with large rise in drag. Between Re 82,400 and 147,000 there is what is known as hysteresis loop. Schmitz found that, starting with separated, sub-critical flow between Re 82,400 and 147,000 he could cause a great improvement in aerofoil performance if he could make the flow turbulent This he did by briefly inserting a stick into the tunnel airflow stream ahead of the wing model. The flow immediately re-attached, and the lift leapt up to the higher curve. On removing this crude ‘turbulator’, the flow remained attached. Below 82,400, i. e. outside the loop, on the low Re side, the turbulator had a similar effect when inserted, but as soon as it was removed, the flow returned to sub-critical and separated from the wing. At other angles of attack, the critical Re was different. Schmitz found that flow separation on the N-60, without turbulator, was inevitable below Re 63,000 at any angle of attack. This figure is usually quoted as the ‘critical Re’ for this aerofoil, but at various angles of attack the separation occurs at different Re. Even at Re 168,000, a hysteresis loop was still present at high angles of attack, hence the N-60, for reliable use on models flying at high Cl, would be best fitted with some device to introduce artificial turbulence into the airflow.

Schmitz also tested the much thicker, highly cambered profile, Gottingen 62S, which was found to have a higher critical Re than the N-60, the loop beginning at 105,000. But

♦Apart from copies at the library of R. A.E., Famborough, and at die Science Museum Library in Smith Kensington, an English translation is available from the British Library, catalogued as R. T. P. Translations Numbers 2460, 2204, 2457 and 2442. A N. A.C. A. translation is also obtainable through the U. S. Information Service. A new German edition was published in 1976.
again, the introduction of a turbulator, in the form of a wire mounted just ahead of the leading edge (see Fig. 8.5), brought the critical value down to about 50,000. Neither the N-16 nor the Go 625 is popular among modellers, but they are representative of a type of profile which remains in widespread use. In 1958-59, G. Muessmann, investigating profiles for gas and steam turbine blades, published test results on four flat-bottomed aerofoils of varying thicknesses and cambers. These closely resemble the profiles favoured for beginners’ and sport models, and tailplanes, the so-called ‘Clark Y’ type aerofoils. From these tests it was found that the Go 796, generally similar to the Clark Y, had a critical Re (lowest value) very similar to that of the N-60. The well-known NACA 4412 is about the same. On the other hand, Muessman’s 20% thick profile, the Go 798, had a critical Re similar to the equally thick Gd 625, while the thin Muessman Go 795 began to show signs of general flow separation only at the lowest Re of the tests, 38,000.

Early transition forced


Late transition, separation likely


turbulent b. i.


Separation less likely


These results confirmed Schmitz’s own tests. By far the most efficient profiles tested by Schmitz were the thinnest, the curved plate, Gdttingen 417a, and the slightly thicker more cambered plate 417b. (His work on the latter was not published till 1953.) Within the range of his tests, these profiles showed little signs of flow detachment Their critical Re was too low to be measured on his equipment This, Schmitz pointed out explained then – obvious success on indoor flying models.

Ii. Turbulent flow aerofoils

8.1 PRESSURE DISTRIBUTIONS AT LOW Re

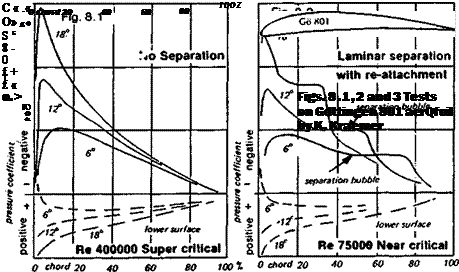
The appearance of a separation bubble on a wing as described in Chapter 3 causes a change in the air pressure and thus affects the lift. It also changes the effective shape of the wing, since the main flow has to accommodate. This changes form drag. There are various techniques for observing, in the wind tunnel, such effects. Tests by K. Kraemer published in 1961 are summarised in Figures 8.1 – 8.3 for the popular model aerofoil, Gottingen 801 (similar to MVA 301). Later research has amply confirmed and extended these results. In these diagrams, the pressure at each point on the upper and lower wing surface is plotted against the chord for several different angles of attack. For positive lift to be developed there must be a substantial difference between the two surfaces. Consider Figure 8.1 first The pressure is plotted as a ratio of the local value to the static value in the mainstream (reduced to coefficient form in this case in the usual way by dividing by VipV2). The reduced pressure on the upper surface is plotted as series of curves generally on the negative side of the graph, while the pressure increase beneath the wing is plotted on the other side of the zero line. At an angle of attack of 6 degrees, pressure on the upper surface falls to a minimum at about 15 percent of the wing chord, and then gradually rises to near the static value at the trailing edge. At 12 degrees the minimum pressure point is further forward and lower, while at 18 degrees the curve reaches its negative ‘peak’ very close to the leading edge and lower still, as could be expected from an aerofoil generating high lift In accordance with Bernoulli’s theorem, flow velocity varies in step with the pressure. The curves give no sign of separation, the aerofoil is working efficiently. At the Reynolds number of 400,000 (wing Re based on chord) the boundary layer makes a natural, unforced transition to turbulent flow somewhere ahead of the minimum pressure point as in Fig. 3.11. At the lower Re of 75,000, well within the model range, a very different pressure pattern is found (Fig. 8.2). At angle of attack 6 degrees, while the pressure minimum is about the same, a section of the curve is flat between about 40 and 76% of the chord. This indicates almost constant pressure over this zone, characteristic of a long separation bubble. However, the boundary layer leaps over the bubble safely and re-attaches. At 12 degrees the peak is further forward as before, the separation bubble is shorter. At 18 degrees the bubble extends over about 30% of the chord, beginning at about 38%. The aerofoil at Re 75,000 is in a near critical condition. It works efficiently though rather less so than at the higher Re. Further reduction of Re has serious effects. These are shown in Figure 8.3. At all angles of attack, complete flow separation occurs a little way behind the minimum pressure point, and there is no re-attachment Some lift is generated, but above an angle of attack of 6 degrees the wing is completely stalled, drag is


extremely high. The aerofoil is clearly unsuitable for use on any model operating in this Re range.

LOADS IN FLIGHT

A constant pitching coefficient in the steady speed flow of a wind tunnel does not imply a constant pitching/b/re when a cambered wing is in real flight The standard equations of Chapter 2 point to the powerful influence of flight velocity: all aerodynamic forces increase in strength with the square of the airspeed. Thus, a constant pitching coefficient means a nose down force which increases enormously as the airspeed rises. This force tends to distort the wing, raising the trailing edge and, since the tips are less rigid than the root, the wing acquires a ‘washout’ that was not intended by the designer. If the wing is suitably stiff in torsion, the twisting will be slight, although there is always some. If the model is comparatively flimsy, with wings covered with plastic film, the distortion may be very severe and has highly undesirable effects. In extremis, the wing itself may twist so far that the tips are ‘lifting’ downwards and they may break off in the downward direction. At best, the carefully designed elliptical lift distribution will be lost at high speed. The twist may also initiate flutter or jam aileron control rods.

The pitching force, nose down, must be balanced in some way, or the model as a whole will be incapable of flight in equilibrium. The tailplane, in an orthodox model, provides the balancing force. At high speed with a cambered wing the direction of this tail force is invariably downwards – the pitching moment tries to pitch the model nose down, the tailplane must restrain this. The more cambered the wing, the larger this load on the tail will be, at a given speed. Some radio controlled model sailplanes, designed primarily for thermal soaring and based on ‘free flight’ model principles, have been known to break up in the air when ‘penetrating’. The tailplanes may break, or the wings, or both. For high speed flight, wings must be stiff in torsion and tails strong in downward bending. A sailplane may ‘tuck under’ into a dive beyond the vertical, if the tailplane is incapable of resisting the pitching force of the cambered wing at speed. (See also 12.22) Another reason for reducing camber on all fast flying models, including pylon racers and multi-task sailplanes is to reduce the download on the tailplane.

7.12 AILERON REVERSAL

The effect of ailerons is not only to change the section ci of the parts of the wings where they operate, but also the pitching moment. A down-going aileron tends to twist the wing to smaller angle of attack and an upgoing aileron vice-versa. As before, such twisting forces increase when the model is at high speed. If the wing is flexible, the effect of the camber change may be equalled and cancelled out completely by the effect of the wing distortion on the angle of attack. A model which suffered from this, as some do, might be deemed to have suffered a radio failure or the servos might be thought overloaded. While such faults as these do sometimes develop, torsionally stiff wings are essential for aileron control at high speeds, particularly on high aspect ratio sailplanes which tend to be flexible and which also require large ailerons.

THE AERODYNAMIC CENTRE

That symmetrical wing sections would have a fixed centre of pressure at the quarter chord point, so long as the airflow did not separate, was predicted by theory long before wind tunnel engineers discovered it to be so in practice. The same theory also gave special significance to the 25% chord point for cambered profiles. It was calculated that in the wind tunnel (with a constant speed of flow regardless of the angle of attack), even though the lift and drag forces varied as the angle of attack changed, if the pitching moment was always measured at the 25% point, it would remain constant. This was very easily tested in the wind tunnel and it was soon proved to be correct, or so nearly so that it could be assumed true for all practical engineering purposes. Wind tunnel results at the present time are obtained by measuring all the forces on the wing at the 25% point. Lift and drag forces are reduced to coefficient form, using the equations given in Chapter 2 (2.6 & 2.13). The pitching force is treated in exactly the same way. The result is that although the lift and drag curves, on the results charts, show great variations with angles of attack, the pitching moment coefficient normally appears as a straight line at some constant or nearly

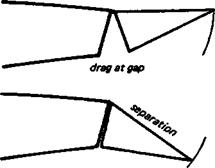
Fig. 7.10 Flap detail design


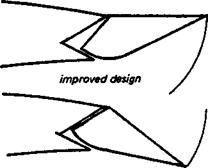
Fig. 7.11 Improved flap design


sliding fairing


constant figure. The point oh a wing at which the pitching moment coefficient is constant is defined as the aerodynamic centre of the wing.

The lift and drag both act at the aerodynamic centre; the lift force does not in fact migrate to and fro. At the a. c. there will also be a pitching moment. In the case of symmetrical wings this is zero unless the flow separates, in which case it changes sharply to a nose down or negative force. With cambered wings of the usual kind there will always be a negative, nose down pitching moment, its strength depending almost entirely on the camber. The more nearly symmetrical the wing section is, the weaker the negative pitching moment As before, if the flow separates, the pitching moment changes as for symmetrical sections, becoming more negative.

Some specially designed wing profiles, particularly those with reflexed camber, may have zero pitching moment like symmetrical sections, or, if the reflexing is exaggerated, a positive, nose up pitching moment may be made to appear. In fact an orthodox cambered profile, when inverted, behaves like a strongly reflexed aerofoil and tends to pitch nose up. (An example of a reflexed camber line is given in Figure 7.2).

When the airflow over the wing separates locally, as nearly always happens on model wings at low Reynolds numbers, the aerodynamic centre may sometimes move slightly from its expected location. Wind tunnel work in this area is still needed to be sure, but it seems that the lift point of action may vary either way perhaps by one or two percent, to 24 or 26%. For practical purposes, however, until research proves the contrary, modellers may take it that the 25% mean chord point is the place where the lift force acts. The mean chord is mentioned here because allowance must be made for any wing sweep, back or forward, when working out where the aerodynamic centre of the wing as a whole lies, as distinct from the a. c. of the aerofoil in the wing tunnel (See Figure 6.5 and Appendix 1)

AEROBATIC MODELS

It is undesirable to camber the wing, or tailplane, of any ‘pure’ aerobatic model. For inverted flight, it is important that control response and model behaviour in all respects are the same as when flying normally. A symmetrical profile is necessary. Such models may, indeed, be fully symmetrical about the thrust line, except for the undercarriage. (Indeed, with an undercarriage on both sides, inverted ‘touch and go‘ landings would be possible.) Aerobatic sailplanes usually require some camber to permit soaring when conditions are weak. Camber flaps, carefully designed and acting also as ailerons, should be employed, to allow camber to be adjusted to suit conditions, and or inverted soaring.

7.11 CAMBER AND CENTRE OF PRESSURE

There are two equally valid ways of describing the forces which are generated by a wing in flight. The older and more traditional method dates back to the time of sailing ships and was employed by the first scientific research workers who used wind tunnels to investigate the behaviour of wing profiles. When a test wing was mounted in the wind tunnel, the lift was measured as a force at right angles to the airflow and the drag as a component of force directly downstream. There was also an additional force tending to twist the wing round to a different angle of attack from that chosen by the technician. This force, tending either to pitch the wing to a higher angle or to a lower angle of attack, was measured as a pitching moment but its direction and strength seemed to vary from one wind tunnel to another. It was soon realised that the point at which the test wing was suspended, whether at the leading edge, or at the mid chord point, or somewhere else, was responsible for these apparent variations. It was as if the point of action of the lift force moved back and forth relative to the wing chord and when looked at in this way, it became possible to plot the position of this apparent point, in terms of percentages of the chord from the leading edge.

Now termed the centre of pressure, as the sailing masters had termed it, all wind tunnel engineers reported similar results in terms of centre of pressure movements. As the angle of attack was reduced, the c. p. seemed to move aft, and as the angle was increased, it moved forward. It never came further forward, however, than about 25% of the chord. At the stall, as the flow separated, the centre of pressure moved rapidly towards the 50% :hord position. Symmetrical wing profiles did not fit into this pattern very well, since they seemed to have centres of pressure practically fixed at one point at all angles below the stall. There was also a difficulty when the wing section was turned to its angle of zero lift [f movement of the lift action point was causing the pitching moment when zero lift was produced, the pitching moment ought also to be zero. This was not so. At zero lift all cambered wing profiles have a marked nose down pitching moment.

• It is important to remember that the centre of pressure movement was always a result jf calculation, using the basic information from the tunnel apparatus, which gave three listinct forces: lift, drag and pitching moment measured at one point on the wing. The :entre of pressure was an abstract, theoretical point, for there was no way the measuring apparatus could be moved back and forward in the tunnel to track its supposed movement. Arithmetically dividing the measured lift force by the pitching force produced a length for the supposed moment

At moderately low angles of attack, corresponding to a fast aeroplane flying at Maximum airspeed, calculation and plotting of the centre of pressure showed it had moved far to the rear, so far that it was no longer within the wing chord at all but must be xmsidered as lying somewhere beyond the trailing edge. The idea that the lift generated by the wing was taking effect somewhere behind the surface causing it created difficulties For the imagination (See Figure 10.5). The lift, after all, supports the aircraft and to suppose it to have its effect somewhere behind the main supporting component was strange. The calculations produced the extraordinary conclusion that the centre of pressure at zero lift (i. e. corresponding to an aeroplane in a vertical dive), must lie an infinite distance behind the wing.

Providing it is remembered that the centre of pressure is an abstraction, this rather old method of describing the wing forces remains quite valid and some modellers still use it Nonetheless, it can cause confusion because it is often quite wrongly assumed that the :entre of pressure cannot move beyond the trailing edge, or that it stops somewhere before reaching the trailing edge. This impression is reinforced by the older textbooks of aircraft Engineering, which describe methods of calculating the loads on a wing for two conditions: centre of pressure forward’ and ‘centre of pressure back’. In these respectable ancient texts, ‘centre of pressure back’ corresponded to the loads expected when the aircraft was flying at its normal maximum permitted airspeed and the aerodynamic fact that the c. p. would move further aft if, for instance the aircraft was in a steep dive, was not always mentioned.