Our heavyweight helicopter equal in the world does not have
In Rostov started production of the most load-lifting rotary-wing car The Russian holding «Helicopt[...]

Everything about aircrafts and helicopters. News and events in aviation worldwide. Civil, transportation, military helicopters and airplanes.

Everything about aircrafts and helicopters. News and events in aviation worldwide. Civil, transportation, military helicopters and airplanes.

Everything about aircrafts and helicopters. News and events in aviation worldwide. Civil, transportation, military helicopters and airplanes.

Everything about aircrafts and helicopters. News and events in aviation worldwide. Civil, transportation, military helicopters and airplanes.


To obtain a complete picture of the performance of any model aircraft in straight flight, a polar curve of the lift-to drag ratio may be calculated and plotted against airspeed. Wind tunnel test resuls are essential for this.
An outline of the method is given in Appendix 1. There are, however, several’ important points to watch. The increasing availability of wind tunnel test results has tempted some modellers to apply these rather crudely, choosing a single test curve for an aerofoil at a Reynolds number approximating that of the model in flight During flight the Reynolds number of a wing is not constant At each airspeed, and on a tapered wing, at
г
|
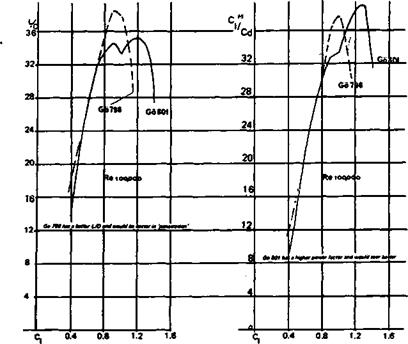
Fig. 10.7 Comparison of two aerofoils
|
Using the calculation methods of Appendix 1, the Power Factor and L/D ratio of a wing profile may be worked out and plotted as shown here. Note: the figures make no allowance for vortex drag. Aspect ratio correction therefore must be applied to arrive at L/D or power factor for the wing.
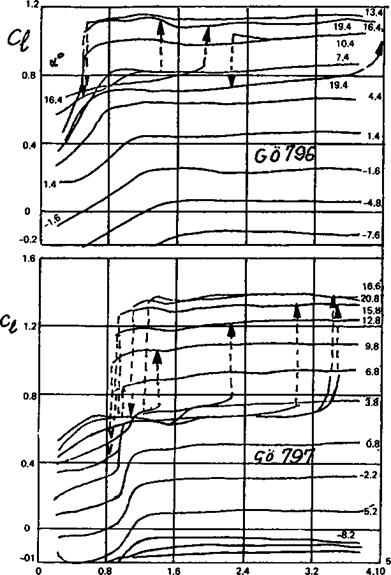
each place along the span, the Re will differ. These variations may be dealt with by constructing, from the basic wind tunnel force curves, diagrams such as those for the G6 796 and 797 (Fig. 10.8). Here, the section lift coefficient at a given angle of attack is read from the tunnel results at each Reynolds number, and plotted as a more or less horizontal line on the charts, with a marked break at the critical Re for that angle and that profile.
Assuming the aircraft is flying at a particular wing Cl its flight speed and hence the average Re number of the wing can be worked out From this, if the wing is tapered, the chord Re at several spanwise points is found by simple proportion. (Twenty span points are usually taken, but the calculations need to be done only for one side, ten points, since the wing is symmetrical about the aircraft’s centre line.) The profile drag of the wing at each point across the span may then be found from charts like those of Figure 10.4, by interpolation, and the wing Co (Profile) is then obtained by integrating all the local section cd coefficients. There then has to be a total wing Co (vortex-induced) drag computation based on the aspect ratio, corrected by the factor к for the planform
|
Fig. 10.8 Plots of Ci variations with Reynolds number for two different aerofoils. The numbers at the right are angles of attack. |
departures from the ellipse (see 5.4), and the wing Cl – To the total of profile drag and vortex drag for the wing alone must be added the parasitic drag coefficients for the rest of the model. Only after this rather lengthy exercise has been completed is the lift/drag ratio at one flight trim discovered. To find the L/D at any other trim requires a complete repetition of the whole work for a different Cl- To construct a polar curve for the aircraft requires all this to be done at least five or six times, with extra work when the exact trim • for best І/D or, with a glider, minimum sinking speed is required. Clearly, very few model enthusiasts will wish to spend the time required to do all this with pencil and paper.
Results of several such exercises by the author, where the work has been done by computer, are listed at the end of this chapter. See also Appendix 1.
For aerofoil selection purposes it is useful to know that the best lift to drag ratio of a profile may be estimated direcdy from the drag curves as reproduced here. This is done by drawing a tangent from the origin or zero point of the drag graph to touch the plotted drag curve at a tangent (the curve appropriate to the Re of the model should be used). This is illustrated (Fig. 10.6). Tangential lines to the drag curves or ‘polars’ of several aerofoils are compared. The steeper the slope of the tangent, the higher the 1/d ratio of the profile. The application of the method is limited to tests at identical, or at least similar, Re. In a similar way, values of the profile power factor may be worked out and plotted as shown in Appendix 1 and Figure 10.7. This is the important figure for free flight duration aircraft of all types, and soaring sailplanes.
For very fast models such as racers and multi-task sailplanes, or pure speed models, the minimum drag figure from the wind tunnel charts at the appropriate (high) Reynolds number is most significant To read this alone without reference to the cj and angle of attack at which it occurs is a mistake. Depending on the camber of the wing, the minimum drag point will occur at a higher or lower angle of attack (see Chapter 7, Figufe 7.7). In Appendix 1 a method is given for calculating the wing Cl at a given speed for a model of known weight. This simple calculation should be done, using an existing successful model as a guide, before choosing the wing profile for a new model. The operating Cl then being known, a profile with minimum drag at the equivalent section cj should be chosen. The required camber will usually be very small and many ‘all out’ speed models do very well
 |
with symmetrical aerofoils, especially if these are of the wide drag bucket kind (see Figures 9.5 & 9.6). A little positive camber may be necessary for sailplanes since these also must perform well at low speeds. Alternatively, flaps may be raised for the high speed flight, bringing the minimum drag point to the low Cl trim for the speed task.
Even in full-sized practice, wind tunnel results are not applied directly. A suitable wing profile may be chosen in the first place on the basis of its comparative success against other profiles in the tunnel, but when final calculations are made, it is assumed, rightly as a rule, that the wing in service will not be accurate enough to give the same performance. Corrections are applied to reduce the tunnel results to those expected in reality. These corrections are arrived at in much the same ways as modellers arrive at their results: wings
are built and tested in service and experience is accumulated in this way for future designs. Often so called ‘practical construction’ wing profiles, produced by normal factory methods, are tested in the wind tunnel.
There has also been extensive work on the effect of roughness and polish on wings. In full-sized work this almost invariably shows the advantage of a smooth, wave-free surface. At model sizes, a difference appears. Some wing profiles tested at Stuttgart were •made by aeromodellers using balsawood and traditional methods of construction with frameworks of ribs and spars covered with sheet balsa or tissue and doped. Several of the open framed, tissue-covered examples performed better at very low Re numbers than did smooth and polished solid wood models of the same nominal profile. The exact shape of a tissue covered aerofoil is very hard to find, since the tissue always sags to some extent between the ribs and, if spars protrude, these too change the profile. The precise shape is hardly under control. The two most important features of any aerofoil, camber of the mean line and general thickness form, are probably by far the most important factors for the free flight modeller to worry about
Radio controlled models, except for the very smallest hand-launched gliders, fly at Re numbers about 100,000 and upwards (see Chapter 3, paragraph 3.3). At about Re 100,000 a tissue or film-covered framework wing often seems to perform just as well as a perfectly smooth and wave-free wing. Some modellers find that a different covering material, such as slightly rough fabric rather than glossy smooth plastic film, can improve the behaviour of the model, suggesting that such a surface may promote transition in the boundary layer and so delay flow separation. Pressnell’s invigorator effect may also be working with these slightly roughened surfaces (see 8.9). Turbulator strips too may be of use. However, as the size and flight speed of the aircraft increases, die benefits of a perfectly accurate and smooth wing become increasingly obvious. Wind tunnel test results also show greater reliability and predictability as the Re numbers rises to 200,000 and above, so it is here that such test results will And their greatest use. Faster, larger models are in this Re region.
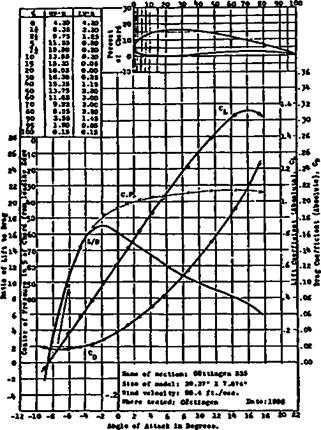
Early wind tunnel test charts were usually very simple, showing how the lift coefficient and drag coefficient varied with angle of attack. The pitching moment was used as a basis. for calculation of the abstract centre of pressure movement, as described in 7.12. The wind tunnels were usually of the open working section type. The models were of low aspect ratio. The size and shape of die test piece were usually stated on the results chart, so corrections for different aspect ratios were left to the aircraft designer. For several decades, every wind tunnel in die world had its own conventions and methods of plotting, so there was great confusion. In an effort to bring order, the NACA during the 1920s published a great series of reports which consisted of collected wind tunnel results from all over the world, reduced to standard form and plotted on a standard type of graph. An example is given in Figure 10.5. Charts from this era still crop up from time to time in the modelling press, because the sizes and flow velocities are sometimes comparable with model Re numbers. Unfortunately, these early results cannot be regarded as reliable now. The test methods used were relatively unrefined, and every tunnel was different (NACA and the Royal Aircraft Establishment at Famborough actually exchanged wind tunnel models across the Atlantic, to see whether they would produce similar results when tested in two of the best wind tunnels available. The outcome caused great concern at the time, for there was little agreement It was after this that the importance of Reynolds number and tunnel turbulence began to be recognised.)
Modem tunnel results are almost always plotted in a standard fashion, similar to that used in this book, although minor differences still appear. (See Figure 10.4 and Appendix 2). Most importantly, the measurements are given for the aspect ratio of infinity. That is, if the wind tunnel model did not actually span the test section completely, the results are still presented after correction for the theoretical infinite state. In this respect, the designer choosing a wing section does not have to worry about variations of tip vortex drag. No vortex drag is supposed to appear in the wind tunnel results. This does of course mean the designer must make suitable corrections once the wing aspect ratio and planform have been decided, but the aerofoil data can be studied without this factor at first. Such wind tunnel data is described as ‘two dimensional’ because the airflow in the tunnel, or after correction, is without lateral motions. (The occurrence of tiny vortices chordwise in the boundary layer after a separation bubble does invalidate this slightly but these vortices are quite different in origin, and effect, from the large wing tip vortices of a finite wing.)
The section lift coefficient, ci, is plotted against angle of attack. Where the ci curve crosses the zero line is the aerodynamic zero and in the case of cambered section this is always at some negative angle, geometrically. The section drag coefficient, cd, is plotted in its turn against ci. The same vertical scale of ci is used for both drag and lift, so it is perfectly straightforward to read from the angle of attack up to the ci, and horizontally across to the Cd curve, whose scale is horizontal at the bottom of the chart.
The pitching moment coefficient is plotted on the same graph as the ci curve or sometimes on its own separate part of the chart, but always easily and directly related to the ci curve. It is particularly important to remember that the cm of cambered profiles is negative (nose down) at all normal angles of attack. Conventions still vary between different laboratories as to whether the cm scale reads upwards towards the more negative values or downwards, and when the scale is arranged horizontally, whether the negative values appear on the left or the right. The pitching moment is not usually expressed as centre of pressure movement now.
All modem wind tunnel measurements are taken at the 25% chord position on the test model, or are subsequently corrected to this location before the charts are plotted. With full scale aerofoils this almost always produces a cm of constant value at all usable angles of attack (i. e. below the stalling region). If the true aerodynamic centre of the aerofoil is slightly out of the 25% position, which does happen sometimes, the cm plot will still, as a rule, be a straight line over the flying range of q, but the line will slope down at some small angle instead of showing a constant value. This does not mean that the moment coefficient actually varies, but only that the aerodynamic centre is either slightly ahead of, or behind the expected 25% point It may also be slightly above or below the centre camber line which has the same effect on the charts. If the cm line slopes from a high negative value at low ci to a less negative value at high ci, the aerodynamic centre lies ahead of the 25% point and conversely, if the Сщ curve slopes from low negative at low ci to high negative at high ci, the a. c. is somewhat aft of 25%. Some wind tunnel test results report the exact a. c. position. Departures from 25% of a few decimal points are in practice hardly enough to matter.
With model-sized measurements, as previously noted, the movements, lengthenings and shortenings of the laminar separation bubbles cause the moment coefficient curves to wander a little. Even so, it is nearly always possible to show that, over the usable range of q and angles of attack, a part at least of the cm curve is more or less straight, although it may be sloping. As before, the direction of the slope indicates whether the aerodynamic centre is ahead of or behind the 25% point So far, when the cm has been measured at all, the indications are that the a. c. centre of model wing profiles is always, as with full sized aircraft, very close to 25% of the chord.
The profiles most likely to depart from these generalisations are the very thin, highly cambered types used on indoor flying models and on small free-flight aircraft Very little reliable test work has been done on these and some of the moment coefficient curves published in recent times are now though to have been wrongly plotted. F. W. Schmitz’s early measurements of the curved plate sections (see Appendix 2) and those by Kraemer of the Gottingen 803 and 804 indicate quite large departures from the straight line cm curves, although even here some parts of the plot are nearly straight, indicating a fixed aerodynamic centre over a certain range of trims (e. g. on the Gd 803 between ci 0.5 and 1.5, at Re 100,000 and 150,000). Where separation bubbles of great length occur, or where flow separation takes place on an even larger scale, standard theory breaks down and there is, as yet, no alternative but to rely on experience with these very thin profiles. To test a microfilm model wing in any normal wind tunnel would in any case be impossible.
It is also worth noting that a profile which behaves badly at very low Re in the smooth and polished condition can often be greatly improved and stabilised by the use of turbulators. The Go 803 tests with the turbulator show a fixed aerodynamic centre for this profile, at 150,000 Re, between q 0.4 and 1.5, at 25% chord, and this apparently applies also to the lower Re of 50,000.
Apart from straightforward measurements of the three basic forces, lift, drag and pitching moment on a wing, wind tunnels allow many other kinds of investigation to be made. If the test model is fitted with suitable internal tubes and perforations, the pressure variation over the surfaces may be discovered. The diagrams of Figures 8.1, 8.2 and 8.3 were constructed in this way. Flow visualisation tests of the kind used by Pressnell (8.9) are widely done, with various types of liquid and, in recent times, liquid crystal material for the coating substance. Powder may be introduced into the flow through small holes in the
|
Fig. 10.5 A typical wind tunnel test result of 1925, as published in standard form by the N. A.C. A. Note that the centre of pressure is shown as lying at 120% (i. e. aft of the trailing edge) at a lift coefficient of 0.2, corresponding to a fairly fast flight speed, at minimum profile drag. The model size of 20cm x 1 metre gave an aspect ratio of 5. The Reynolds number at a flow velocity of 30m/s was approximately 410,000, the wind tunnel being at Gottingen University. |
model wing, to trace the boundary layer from any chosen point A very common and useful technique is to inject fine streamers of smoke into the test section upstream of the model. This reveals not only the general flow of the streamlines but where the smoke becomes trapped in the boundary layer the separation bubbles show up. The smoke is sometimes made by trickling oil down a hot, vertical wire, which has very little effect on general turbulence.
A simple stethoscope connected to a fine capillary probe may allow the experimenter, to listen to the boundary layer and this is one of the most sensitive methods of detecting the point of transition from laminar to turbulent flow. Where the flow is laminar, a faint hissing is heard. Turbulent flow emits a distinctive crackling. This device was used many years ago by August Raspet to detect separation on full-sized sailplane wings in flight, but it has proved useful in the wind tunnel many times since. To avoid disturbing the delicate flows being studied, the probe must be inserted always from the downstream side.
In all cases, the raw force measurements coming from the instruments have to be corrected to allow for various defects which cannot be entirely removed from any tunnel. The model, for instance, tends to block the flow through the test section and this* blocking effect varies with the angle of attack. Models of different chord and thickness cause more or less blocking. The constraint of the air by the tunnel walls must be allowed for. If there are any supporting struts or wires, an estimate of their effect on the figures has to be made. Where balances, rather than pressure measurements and wake rakes, are used there are
often small gaps at the ends of the tunnel model, where they must be free to move and not jam against the walls. These gaps may affect results. When the model is fixed to the wall (giving the effect of infinite aspect ratio as mentioned in 6.17), there are problems caused by interference of the flow in die corner. The corrections applied are carefully worked out but are always somewhat approximate. For all these and other reasons, including inaccuracies in models used for testing, the results reported from one wind tunnel always differ to some extent from those originating elsewhere.
While the general pattern of the results emerging is clear enough, small differences in performance between sections tested in different tunnels may not be taken too seriously. Such variations are due to the variations of experimental technique. It is fair to compare Kraemer’s tests of the Go 801 with his test, in the same tunnel, of the Hacklinger designed section, Go 803, or the Go 804, but it is hardly safe to compare the Kraemer results directly with those of Pfenninger or Muessman etc. The importance of Dr Althaus’s results from Stuttgart is that all come from the same tunnel, and may be compared with one another. Yet even when, as in this case, a series of reports have been published from one research laboratory, over a period the test apparatus is likely to have been improved or altered so that results from one early test may not be exactly comparable with a later one.
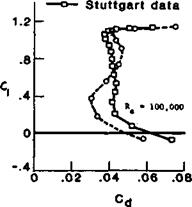 |
Fig. 10.3 Comparison of drag data from two modern wind tunnels (Eppler 387 aerofoil)
|
ANGLE OF ATTACK. 0 • ” ** I*
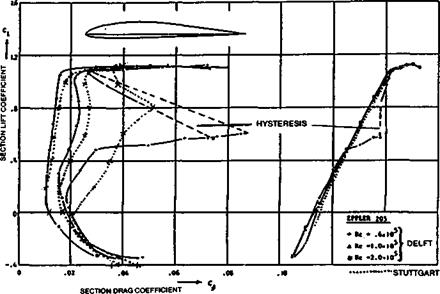
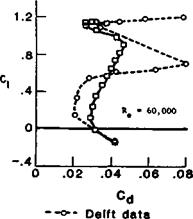
Figure 10.4 Comparison of two different wind tunnel measurements of the Eppler 205 aerofoil. At the highest Re, 200 000, agreement is very good, but it is less good at Re 100 000 and poor at 60 000. The Delft measurements show a pronounced hysteresis loop at Re 60 000, which does not appear in the Stuttgart tunnel. [See Chapter 8, 8.3] The lift curve as well as the drag is shown, as explained in Paragraph 10.5. |
As an example of what may occur when an apparently identical aerofoil is tested in two different laboratories, Figure 10.3 shows the drag polars for the Eppler 387 at Re 60,000 and 100,000, as measured at Stuttgart and Delft. A similar pair of results is shown in Figure 10.4 for the Eppler 205. (See also Appendix 2). The Gottingen 795 aerofoil, which has attracted attention because it seems less affected by low Re numbers than many ofther profiles, has been tested in three separate tunnels, charts from two of which appear in Appendix 2 and the third in Dr. Althaus’s book, Profilpolaren fur den model(flug, Vol. 1. The comparison is left to the reader.
The forces on model wings at low speeds are so small that very refined instruments are required to measure them accurately. This is particularly die case with drag. For example, if a test wing is developing a lift force equivalent to a weight of a few grammes, the drag may be a hundredth of this. A wind tunnel balance which can read to only one percent accuracy would be useless. In Schmitz’s tunnel, the model wing under test was suspended on wires in the open sided test section. The forces were found by careful weighing. Most modem tunnels have fully enclosed test sections, which keeps the models free from extraneous disturbances. Various methods are used to measure the forces, many of which do not depend on weighing. The Stuttgart model tunnel, for example, has a series of small holes drilled through the tunnel walls so that the pressure variation of the airstream as it passes round the wing can be accurately measured. This allows the lift to be computed. The drag is measured by a wake rake. This is an array of capillary tubes with open ends, rather like a comb in appearance, which is positioned vertically in the airstream immediately behind the trailing edge of the wing. By measuring the speed of the
 |
Fig. Fig. 10.2 Drag measurement with a wake rake
 |
Typical wake profile
WAKE MUST BE TRAVERSED LATERALLY BECAUSE BOUNDARY LAYER CONTAINS VORTICES WHICH UPSET ISOLATED READINGS
flow at each point the loss of momentum caused by the resistance of the aerofoil can be calculated and, hence, the drag (Figure 10.2). Because of the small vortex flows discovered where separation bubbles occur, the wake rake has to be moved laterally to sample flow across the span of the test model. The final outcome is an average drag coefficient In other wind tunnel laboratories other methods are used, including strain gauges and very sophisticated electronic balances.
In all wind tunnels, the drag of the walls, floor and ceiling tends to slow the stream down at the edges and the walls have their own boundary layer characteristics, introducing errors into measurements taken near them. Before a tunnel is used, it has to be established by careful testing that the flow speed is even through and across the whole test section.
A measurement of particular importance for low speed work is the turbulence factor of the tunnel. Since so much depends on the boundary layer and its transition from laminar to turbulent flow, any small, microscopic turbulence in the tunnel will have a disproportionately large influence on the drag of the aerofoils under test In serious test work, the tunnel turbulence factor is reported and, to allow a very rough correction to be made, the Reynolds number of the test may be multiplied by this factor to yield an equivalent Re. It is also found that tunnels tend to have somewhat different turbulence factors at different flow speeds, so strictly a whole spectrum of turbulence measurements should be made. This is not often done.
Before F. W. Schmitz could carry out his classic tests on wing profiles at Cologne (see Chapter 8 and Appendix 2), he had to work for more than a year to improve the wind tunnel. He reduced the turbulence factor to 1.06. Modem tunnels should be better than this. Schmitz’s results are probably reliable to within 6% of the stated Reynolds numbers.
A few years earlier, the NAC A in America had carried out an extensive series of tests in the compressed air tunnel, down to Reynolds numbers of42,000. The results published in NAC A Report 586 covered all the most popular NACA four digit profiles, the 6409, 4409, 4412, etc. and are still quite often quoted by writers in modelling magazines and presumably are used in designing some models. Unfortunately, as the NACA authors reported at the time, the turbulence factor was 2.64, which implies that the stated Re of each test should be multiplied by this figure to arrive at a better but still very crude approximation to the truth. In other words, the Re of 42,000 of these tests (apparently well within the free flight modelling range), represents a true Re of 110,880, which takes these test results above the usual critical Re for most aerofoils. NACA Report No. 586 is not in general of much value to modellers. Other tunnel tests have suffered from the same difficulties, though when published, the turbulence factor is not always stated, so that not even the crudest correction can be attempted. Modellers should not take seriously any wind tunnel results which are quoted or published if the turbulence factor is not known.
10.1 UNDERSTANDING THE WIND TUNNEL
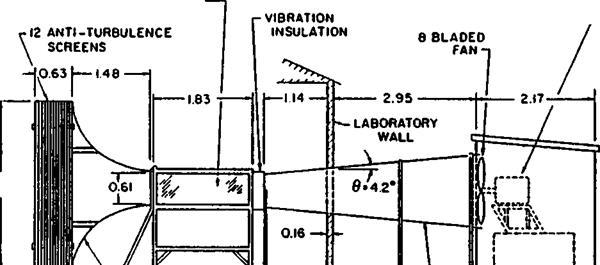
The basic idea of a wind tunnel is easy to grasp. The forces on a wing in flight may be exactly imitated if the wing is held fixed and an airstream blows over it at an equivalent speed. To make a very simple wind tunnel is easy and has been undertaken as a project in schools. A fan draws the air through a duct A section of the duct is fitted with removable panels for access to allow models of wings or other components to be mounted safely in the flow. Simple spring balances can be used to measure forces, and probes connected to pressure manometers can be moved by hand to investigate flow speeds, etc. Much can be learned from the simplest such tunnels but to make accurate measurements is difficult For work at model aircraft speeds and sizes, it is particularly vital to keep the flow in the test section of the tunnel as free as possible from turbulence. This requires not only flow straighteners in the tunnel but diffusers and fine mesh grids, or even screens of fabric through which the air is drawn. These reduce turbulence to such fine dimensions that natural damping tends to reduce the small disturbances in the flow very quickly. In addition, the flow after passing through the screens enters a carefully designed contraction in the tunnel before the test section. The contraction has a venturi effect (see Figure 2.7), speeding the flow up while at the same time narrowing the stream. This further reduces turbulence, since any remaining small lateral oscillations in the flow become stretched out longitudinally and restricted laterally.
After the test section has been passed, further flow straighteners are usually fitted and, since the fan rotates, the shape of the tunnel in cross section has to be changed to circular from rectangular or square. This change has to be fairly gradual since it is easy for disturbances in the flow downstream to make themselves felt in the test section.
Because of the effects of sound on the boundary layer (see 8.12), the noise of the fan blades and the fan motor itself must be suppressed and vibrations must be prevented from disturbing the measuring instruments.
Tunnels of the open return type, in which the air after passing the fan is allowed to escape into the laboratory building or even to open atmosphere, with new air constantly drawn in through the screens at the other end, are often affected by external weather, especially wind which can cause fluctuation in the flow speed through the tunnel. Such tunnels may be sited in sheltered places, such as wood or forest lands, to shield them. The closed return type of tunnel is less subject to weather but because the same air is recirculated to the intakes after passing the fan, additional precautions are needed to prevent vortices from the fan blades persisting all the way through the tunnel. Figure 10.1 shows in schematic fashion the layout of a very good modem wind tunnel.
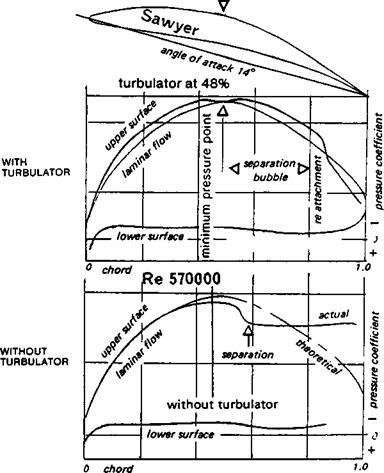
There is some evidence to suggest that even a ‘laminar’ flow wing may be improved by careful use of a ‘trip strip’ turbulator. It has been shown earlier that when a laminar boundary layer meets an adverse pressure gradient, separation may occur. If a laminar flow profile, such as one of those designed by Wortmann or Eppler, suffers from flow separation behind the minimum pressure point, by placing a turbulator strip just ahead of the danger point, the boundary layer may be forced into turbulence a little early. When it arrives at the critical spot it may have enough momentum in its lowest layers to carry it through. In Figure 9.21 the results of an experiment by Sawyer with a turbine cascade blade not unlike a model wing profile in appearance are given. Although these tests were carried out at a Re of 570,000, higher than that of all but the larger and faster models, they do indicate a possible, and encouraging, line for experiment. The angle of attack of these tests was very high — about 14 degrees. Some degree of flow separation might have been thought inevitable so close to the stall. Separation on the plain aerofoil did occur on the upper side shortly after the pressure minimum, which was at 50%. This is indicated on the diagram by the sharp rise of pressure and the flat segment of the curve trailing aft. The whole rear part of the wing profile was stalled. By placing a thin trip strip just ahead of the 50% position, a separation bubble was brought into being. The flow re-attached as a turbulent boundary layer at about 80% chord — i. e. the bubble extended over 30% of the wing. After re-attachment, the pressure returned almost to the desired theoretical value and the profile was very efficient. Compare this also with Pfenninger’s results on a very thin profile, given in Appendix 2, at Re’s down to 100,000. It seems likely, therefore, that models using laminar flow profiles may also be tried with trip strips near the minimum pressure point on the wing, which for practical purposes may be assumed to lie near the position of maximum thickness.
Misplacing of the turbulator can do more harm than good. Results of a test on the Eppler 65 are shown in Figure 9.20. With a turbulator at 28% of the chord on the upper surface
Separation bubble warning
_ _ _ _ _ _ д upper surfoce
 |
E 6b Trb. 28% .8.86* vlower surfoce
the match of theory and measurement is somewhat less good than without the turbulator, and the drag all round is somewhat higher (note the scales are not the same on the diagrams, which tends to obscure this). The theory does not predict bubble separation in the low drag bucket, but clearly it does occur even with the turbulator. A different position for the turbulator would very possibly change this situation.
As usual, the systematic experimental approach with a particular model is the best; no general rules can be laid down in the absence of extensive wind tunnel test results. The object is to retain laminar flow as far as possible but to avoid separation behind the minimum pressure point. If this can be achieved the new profiles should perform very well.
|
Fig. 9.21 Flow separation on a turbine cascade blade |
|
CONTRACTION CONE 24:1—* |
![]()
![]()
![]()
 |
Fig. 10.1 A modern low speed research wind tunnel of the open return or Eiffel type at Notre Dame University, Indiana, USA.
Note bothintake and exit are sheltered. ALL DIMENSIONS ARE IN METRES.