Category Modeling and Simulation of Aerospace Vehicle Dynamics

CRUISES—Cruise Missile

Cruise missiles fly like autonomously controlled airplanes, but do not return, unless used as reconnaissance vehicles. The CRUISE5 simulation is representative of these types of vehicles. Figure 9.55 shows the modular structure and the calling sequence. During the cruise phase, the missile navigates with GPS/INS from way – point to waypoint until it reaches the terminal area. Now the sensor, pointed by the INS at the target, becomes active and provides the refined navigation solution to the line guidance law. The autopilot converts the acceleration commands into bank-to-turn steering signals, which the airframe executes until impact.

I will be brief with the description of the modules in the hope that you have gained enough savvy to explore on your own the source code provided on the CADAC CD.

The G1 Target Module models a simple point target, possibly moving along a straight line.

The G2 Environmental Module uses the ARDC 1959 standard atmosphere, and an option is provided for the tabular input of a special atmosphere. Wind and gust effects are modeled in a simplified manner.

The A1 Aerodynamic Module provides the lift and drag coefficients as functions of Mach and angle of attack for three c. m. locations. With an aspect ratio of 20, best lift-over-drag value is about 10. Span is 4.3 m and reference area = 0.929 m2. Refer to Sec. 9.2.1.2 for more detail.

The A2 Propulsion Module gives the thrust available (max thrust) and idle thrust (min thrust) as provided by tables as a function of altitude and Mach number. Given the thrust, the fuel flow rate is obtained from tables, which depend on thrust and altitude. A Mach hold controller maintains the cruise speed. The modeling of the turbojet is discussed in Sec. 9.2.2. Takeoff gross mass is 1019 kg, and maximum fuel mass is 195 kg.

CRUISES—Cruise Missile

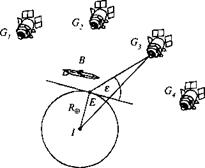
Fig. 9.56 GPS constellation.

The S2 GPS Module consists of four GPS satellites and a 17 states Kalman filter that updates the INS navigation solution. Figure 9.56 shows the satellite constellation. Because the CRUISE5 simulation uses the flat-Earth assumption, the Earth is nonrotating, and the satellites have to be assumed fixed. Although unrealistic, this simplification is acceptable for short duration flights and for generic navigation error studies. However, it is unsuitable for flight-test support.

My discussion of GPS and its filter is very abbreviated because it would lead us too far into an advanced topic that is well covered in the literature.24 For those of you who have the drive and motivation, a solid foundation in GPS navigation together with the following diagrams should be sufficient to help you interpret the FORTRAN code of the S2 Module.

Based on the satellite and cruise-missile geometry of Fig. 9.56, there are five dilution of precision calculations that are summarized in Fig. 9.57. The pseudo­range measurements are corrupted by ionospheric and tropospheric effects, and additional errors are introduced by path delays, receiver noise and resolution, receiver dynamic noise, clock bias, and clock frequency uncertainties. These er­rors corrupt the measurements that are input to the Kalman filter as shown in Fig. 9.58.

The Kalman filter consists of 17 states that model nine INS errors and eight instrument uncertainties (three INS positions, three INS velocities, three INS tilts, three INS accelerometer biases, three INS gyro biases, one clock bias, one clock frequency error). Figure 9.59 shows the linear dynamic F matrix with the specific force coupling terms f, /2, and /3, the direction cosine matrix [TBL, and the clock time constant rc.

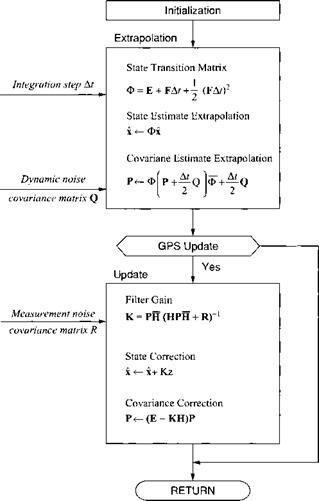
Finally, Fig. 9.60 combines all the elements into the sequence of the filtering process. As in any Kalman filter, there is an extrapolation and update phase. The update of the states is sent to the INS, its sensors, and the GPS clock. A typical update rate is 1 Hz. Although the equations have the appearance of a linear filter, in effect the measurements are nonlinear, and therefore we are modeling an extended Kalman filter that linearizes the observation matrix at every integration step.

Unless you are a control engineer, these diagrams may overwhelm you. Get a good grip of Kalman filtering through books like that by Maybeck.25 Then with

perseverance, you should be able to back out the equations from the FORTRAN code. After a series of test cases, you may feel like you have mastered the subject.

The SI Sensor Module can detect and image a landmark or target and update, just like GPS, the INS navigation solution. Although the sensor is a simple kinematic model, it has a full set of errors that corrupt the true LOS. The measurement is sent to the INS in raw form without filtering to keep the implementation lucid. Several fixes can occur on one image improving the update consecutively.

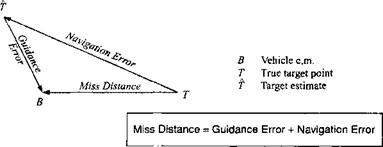
To understand the update process, we first define miss distance as the vectorial sum of guidance and navigation errors (see Fig. 9.61). The navigation error is the

distance between the true and estimated position of the target, and the guidance error encompasses the remaining vehicle errors, originating from the guidance law, the autopilot, air-frame maneuver limits, and environmental effects.

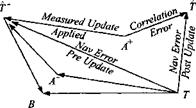
Figure 9.62 depicts the two steps of seeker measurement and navigation update. In preparation of the measurement, the INS points the seeker at f, but the seeker pointing error instead misplaces the beam at point A, the aimpoint. The scene is imaged and the measured update determined. The measured update corrects the navigation error except for the inherent pointing error.

Before the navigation update the scene is correlated with the stored template, but unfortunately a correlation error creeps in that corrupts the measured update. Now the processor updates the estimated target location from T~ to T+. The original navigation error is reduced by the measured update, except for the correlation error. The vehicle executes a correction and flies towards the new target point

f+.

The S4 INS Module is tightly integrated into the GPS and sensor loop. It stabi­lizes the GPS algorithms and points the sensor beam at the target. Its navigation solution is updated either by GPS in absolute coordinates or by the sensor in target – relative coordinates. It presents the single interface to the guidance processor. As in the SRAAM5 simulation, the nine error state equations (three positions, three

*3×1

position error

velocities, and three tilts) bring realism to the fly-out accuracy. The derivation of the error equations can be found in Sec. 10.2.4.

The Cl Guidance Module converts the navigation information from the INS to pitch acceleration and bank-angle commands that are executed by the control module. Three options are provided: waypoint guidance, terrain following/obstacle avoidance (TF/OA), and terminal line guidance. For course planning waypoints are identified on the map, and the cruise missile follows the sequence along preset headings, employing the lateral line guidance law as outlined in Sec. 9.2.4. In the vertical plane either the altitude hold loop of the Control Module C2 is engaged, or the TF/OA guidance law is invoked. As the missile approaches the terminal area, line guidance steers the missile in both planes to the target.

Obstacles are generated by two stochastic functions. An exponential distribution determines the waiting distance for the next obstacle to occur. The height of the obstacles is determined by a Rayleigh distribution. Terrain roughness is provided by the Newton Module Dl. The onboard sensor can track terrain and obstacles either in a look-down or look-ahead mode. The look-ahead mode assumes that a terrain database of the area has been loaded in the guidance processor.

The C2 Control Module provides several autopilot options. Although a skid-to – turn mode is also given, we make use only of the bank-to-tum option. The key features are the acceleration controllers and the altitude hold autopilot. Both types are discussed in Sec. 9.2.3. The heading and flight-path-angle controllers are of lesser significance.

CRUISES—Cruise Missile

Fig. 9.60 Kalman filter propagation and update equations.

The A3 Forces Module is where the aerodynamic and propulsive forces combines and sends them as specific forces to the INS and Newton Modules. The TM [THV is also calculated from Eq. (9.11).

The D1 Newton Module’s primary purpose is to solve the translational equations of motion. It also contains a subroutine that generates stochastic terrain, compatible for a look-down or look-ahead terrain sensor. The stochastic model is a second – order autocorrelation function driven by white Gaussian noise. The parameters of Table 9.3 describe the roughness of the terrain at three typical locations.

Table 9.3 Typical terrain of three levels of roughness

Location

Terrain

type

Correlation length, m

Factor of second correlation length

Roughness std deviation, m

Slope std deviation

Ellsworth, KS

Smooth

536.4

0.726

9.14

0.02

Green River, UT

Medium

609.6

0.444

30.48

0.075

Black Top Mt, NM

Rough

914.4

0.444

152.4

0.25

The D2 Rotation Module replaces the Euler equations of six-DoF simulations. Its main output is the body rate coBE]B for the INS module and the direction cosine matrix [T]BL for various transformation tasks.

The G4 Impact Module computes the waypoint and target miss distances are computed. As defined in Fig. 9.61, the navigation and guidance errors that make up the miss distance are also recorded. The target, specified by a point, is a surface, which is oriented relative to Earth by two angles. The equations for the miss distance in the target plane are taken from Problem 2.8.

We have completed the round through the modules of Fig. 9.55. It is now up to you to exercise the test cases provided on the CAD AC CD. Particularly interesting is the study of maneuver requirements for various terrain roughness. Figure 9.63 shows a typical trajectory plot of the CRUISE5 vehicle, hugging a medium-rough terrain at an average clearance of 50 m while avoiding obstacles placed on the surface. Well, CRUISE5 did hit an obstacle, placed at a very inop­portune location, just as it descended into a valley. Assuming it survived intact, it pops up, and then dives into the target under line guidance.

Pseudo-five-DoF simulations take an important place in the arsenal of an aero­space engineer. They are easier to build than six-DoF simulations, and, in contrast to three-DoFs, model attitude dynamics, although simplified. During the preliminary design phase, they serve to establish the performance of the vehicle. With the maturing of the concept, however, more information becomes available, especially in aerodynamics and autopilot design. Now the construction of a six-DoF model can begin. The next chapter provides the details.

CRUISES—Cruise Missile

Fig. 9.61 Miss distance definition.

1. Seeker Measurement

CRUISES—Cruise Missile

CRUISES—Cruise Missile

CRUISES—Cruise Missile

f

Problems

9.1 AIMS engagement studies. Investigate the performance of the AIM5 air – to-air missile as modeled by the CAD AC AIM5 simulation. Performance is defined in terms of launch envelope and miss distance. The missile’s fly-out time is limited by the onboard battery life of 30 s.

Task 1: Download the AIM5 project from the CADAC CD and run the test

cases INHORI. ASC, INHOR3.ASC, and INVERT3.ASC. Get familiar with the AIM5 documentation of Sec. 9.3.1.

Task 2: Analyze the performance of the AIM5 missile using the CADAC SWEEP methodology. Set up input files for the following engagement codes taken from Tables P9.1 and P9.2:

Input file

Codes

INLOW. ASC

Ll/Tl

INMED. ASC

L2/T2

INHIGH. ASC

L3/T3

INMIX. ASC

L1/T2

Run the four SWEEP cases by setting up fans with varying launch ranges DHTB and angles AZTLX. Contour the launch envelopes, limited by miss distance not greater than 5 m and flight time not greater than 30 s.

Task 3: Document your results. Provide your four input files and four contour

plots.

9.2 Automatic approach to LAX with Falcon aircraft. Using CRUISE5 as a template, build a pseudo-five-DoF simulation of an aircraft with the following module structure (you have to change only the shaded Modules A1 and A2).

Task 1: Familiarize yourself with the CRUISE5 simulation, run the test cases, and plot selected parameters.

Task 2: Strip CRUISE5 of unnecessary modules and run test cases

INCRUISE. ASC, INCLIMB. ASC, and INIP. ASC for verification.

Task 3: Download from the CADAC CD the FALCON5 aerodynamics and propulsion data decks and create the new Modules A1 and A2.

Task4: Adopt the test cases INCRUISE. ASC, INCLIMB. ASC, and INIP. ASC to the FALCON5 simulation and execute them for verification. (You may have to tweak the autopilot.)

Table P9.1 Missile launch conditions

Launch conditions

Altitude, m

Mach

Heading, deg

LI

1,000

0.6

0

L2

3,000

0.75

0

L3

10,000

0.9

0

Table P9.2 Target aircraft conditions at time of
missile launch

Target conditions

Altitude, m

Mach

Heading deg

T1

1000

0.6

180

T2

3000

0.75

180

T3

5000

0.9

90

Task 5: Guide your FALCON5 to an automatic landing approach at L. A. Inter­national Airport, Runway 076 deg at 34°27’N, 118°26’W (start of runway). Begin over Santa Catalina Island, 33°50’N, 118°025’W, heading 300 deg, speed 164 m/s, altitude 3000 m. Approach IP (500 m before start of runway) at heading 76 deg and glide slope—10 deg with Mach 0.3 and flaps out (20% increase in drag, 60% increase in lift).

(a) Build the input file INLAX. ASC. Consider inserting an additional waypoint. Bring the aircraft down in altitude steps at 20 km from the IP with extended flaps.

(b) Display the three-dimensional trajectory in KPLOT-РГГА with time traces of altitude, Mach number, flight-path angle, and heading angle.

9.3 AGM5 air-to-ground missile. Convert the AIM5 air-to-air missile model into an unpropelled air-to-ground missile simulation and determine its perfor­mance. (You have to modify only the shaded modules.)

Task 1: Familiarize yourself with the AIM5 simulation, run the test cases, and

plot selected parameters. You will benefit from first executing Problem 9.1.

Task 2: Download from the CAD AC C D the AGM5 aerodeck and replace the A1 module. Implement the miss distance calculations of Problem 2.8 in a new G4 subroutine.

Task 3: Build the trajectory input file INTRAJ. ASC. Launch: heading = 10 deg (from North), altitude = 3000 m, speed = 300 m/s. Stationary target: Distance from launch point = 9000 m at azimuth = —10 deg (from North), altitude = 100 m, target plane tilted up 70 deg. Record miss distance and plot altitude, Mach number, and flight-path angle vs time.

CRUISES—Cruise Missile CRUISES—Cruise Missile Подпись: GJ Impacl L Gl G2 S4 J? Cl C2 * Al n A£ A3 « D1

Task 4: Conduct an autopilot gain sensitivity study for the trajectory of Task 3. Build the input file INMULTI. ASC for the three gains GACP = 4,40,400. Record

miss distance and plot angle of attack vs time of the three traces. What gain yields the smallest miss distance?

Task 5: Determine the footprint for the launch condition of Task 3 on a hori­

zontal target plane at 100 m altitude. Build the input file INPRINT. ASC and set it up for a SWEEP run. The footprint is limited by miss distance less than 5 m. Plot the footprint.

Task 6: Compile your results in a brief report. Include the input files IN-

TRAJ. ASC, INMULTI. ASC, and INPRINT. ASC, the plots from Tasks 3, 4, and 5, and the miss distances of Tasks 3 and 4.

SRAAM5—Short-Range Air-to-Air Missile

SRAAM5—Short-Range Air-to-Air Missile

SRAAM5 is a good example of how far a five-DoF simulation can grow in so­phistication and still maintain the simple pseudo structure of the dynamic equations of motion. Figure 9.54 shows the structure with the shaded modules indicating new

elements. The A1 and A2 Modules are specific to the SRAAM concept, while the guidance loop is expanded by a midcourse and a terminal mode. In midcourse the shooter aircraft sends target data over data link to the missile INS navigator, which in turn delivers the kinematic LOS rates to the pro-nav guidance law. In the terminal phase the LOS rates are provided by an imaging infrared seeker. A brief description of the new modules follows.

The G1 Target Module implements realistic engagement scenarios are imple­mented. They are known by special designations, like Pre-Merge (shooter cen­tered), One Circle Fight, Two Circle Fight, Lufbery Circle, Target Centered En­gagement, Chase Circle, Head-On Circle, and Twin Circle. You just need to set the flag MTARG and thus invoke the preprogrammed initial conditions for target and shooter aircraft.

SI Seeker Module uses imaging IR sensors as the current state of the art for short-range air-to-air missiles. Although only generic data are used, the roll/pitch gimbals and the coordinate systems are quite realistic. The description of the seeker is at an advanced level and is therefore deferred to Sec. 10.2.6.

The S2 Air Intercept Radar is a simple kinematic model of an acquisition and tracking radar, located in the shooter aircraft. It is used to acquire and track the target and transmit that information to the missile at launch and during an optional midcourse phase.

S4 INS Module is used in midcourse only. The nine error state equations (three positions, three velocities, and three tilts) bring realism to the fly-out accuracy. The derivation of the error equations is postponed until Sec. 10.2.4.

The Cl Guidance Module provides a midcourse and terminal guidance phase. In midcourse a simple pro-nav law is implemented (see Sec. 9.2.4.1), whereas the terminal phase relies on an advanced formulation of the pro-nav law, described in Sec. 10.2.5.1.

The A1 Aerodynamics Module uses trimmed aerodynamic lift and drag coeffi­cients of a generic short-range air-to-air missile expressed in tables as a function of Mach and angle of attack, for power on/off, and three c. m. locations. The length of the missile is 2.95 m, and its diameter 0.1524 m.

The A2 Propulsion Module gives the thrust of a single-pulse rocket motor as a table of thrust vs time with backpressure corrections. Vehicle mass and c. m. shifts are also updated. Launch mass is 91.7 kg, and the motor fuel is 35.3 kg.

To your chagrin, the discussion of several features are postponed until the next chapter because of their advanced nature. Actually, I built the six-DoF version of SRAAM6 first and then converted the inner loop (equations of motion, aerody­namics and autopilot) to the five-DoF model. The outer (guidance) loop transferred with only minor modifications to the SRAAM5 simulation. If resources permit, I recommend this approach from six-DoF to five-DoF modeling because in the process we can validate our simplified model with the six-DoF truth model.

The AIM5 and SRAAM5 simulations are representative of highly maneuver – able missiles with tetragonal symmetry executing skid-to-tum maneuvers. Cruise missiles, requiring long range performance, are designed with high-aspect-ratio wings for efficient cruise. They are steered like airplanes by bank-to-tum maneu­vers. We turn now to the CRUISE5 simulation and all of the attributes of a typical cruise missile.

SRAAM5—Short-Range Air-to-Air Missile SRAAM5—Short-Range Air-to-Air Missile
SRAAM5—Short-Range Air-to-Air Missile

Fig. 9.55 CADAC CRUISE5 pseudo-flve-DoF simulation.

Vertical engagement

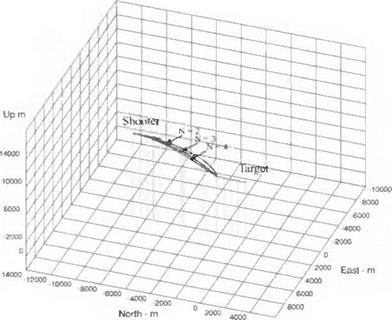
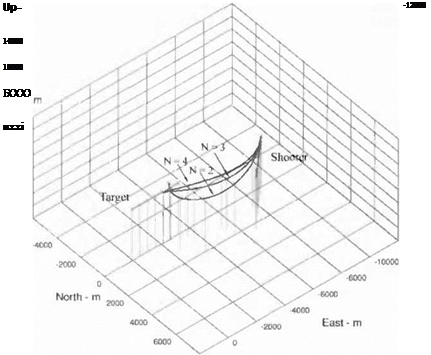
The second scenario is a shoot-down en­gagement in the vertical plane. The initial situation is given in Fig. 9.51. Both aircraft cruise at 0.9 Mach, but, because of different altitudes, they do not have the same velocity. As in the horizontal case, we study the sensitivity of the missile performance to the navigation gains N = 2, 3, 4 and compare flight time, Mach number, and miss distance at intercept.

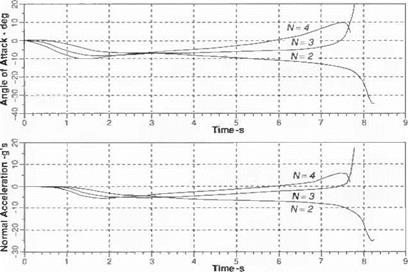
Figure 9.52 shows the vertical engagement of the three cases. In this shoot – down scenario the missile intercepts the target with all three navigation gains (see Table 9.2). The smaller gain values lead to trajectories with less depression because the acceleration command is reduced. This response of the missile acceleration is confirmed by Fig. 9.53. Observe how the angle of attack and the resultant normal acceleration depress down the missile quicker with higher gains. With N = 2 the missile almost overshoots the target, save for a final pull-down effort that exhausts its maneuvering capability. Higher gains exhibit the opposite trend. After the initial downward acceleration the missile has to pull up for the intercept.

This sample simulation of an air-intercept missile highlights several points. Any aerospace vehicle simulation should exhibit a modular structure to mirror the vehicle’s subsystems. With the interfaces clearly defined, several designers can craft the code in parallel, shortening the development time significantly. As these simulations multiply, a library can be maintained and modules exchanged with other applications. I have conserved many resources by reuse of modules and exchange with other organizations.

Table 9.2 Summary of vertical engagement

Navigation gain

Time of flight, s

Mach number at intercept

Miss distance, m

2

8.23

2.3

18.4

3

7.78

2.9

6.3

4

7.67

2.9

0.8

Vertical engagement

Fig. 9.52 Vertical missile engagements with navigation gain N = 2,3,4.

Vertical engagement

If you do not have your own modular simulation, you can adopt CADAC as your simulation environment. More than 20 years have been invested in its development and perfection. Although it abides by some stringent FORTRAN conventions, the reward is a code that can easily be modified and shared. Appendix В provides an introduction. More details can be found in the program documentation, made available on the CADAC CD. The vehicle’s modules are embedded in the executive routine CADX. FOR. It handles input/output and integration of state variables. Modules and CADX. FOR compiled together require at run time two input files CADIN. ASC and HEAD. ASC. The first defines the input and the second the output. To inspect these files, go to the CADAC AIM5 folder.

The output, as defined by HEAD. ASC, is written to a TRAJ. BIN file. Now, all of the postprocessing options of CADAC are available. With KPLOT you can display two- and three-dimensional trajectories, as I have done in Figs. 9.49, 9.50, 9.52, and 9.53. Other options allow you to build ASCII files of selected variables, make strip charts, plot footprints, and launch envelopes. If you run multiple stochastic trajectories, you can display histograms, bivariate distributions (error ellipses), and the mean traces of Monte Carlo replications.

After these detailed explanations of a simple pseudo-five-DoF simulation, you should be able to decipher on your own the source code of the more complex short-range air-to-air missile SRAAM5.1 will therefore be brief and refer you to the CADAC CD for the details.

. Horizontal engagement

Let us put this simulation to work and build two test cases. The first scenario is a coaltitude engagement at 10 km altitude. Both target and shooter fly at constant speed. The initial situation is given in Fig. 9.48. We study the sensitivity of the engagement to the navigation gain N using the values 2,3, and 4 and comparing the flight time, Mach number, and miss distance at intercept.

. Horizontal engagement

Figure 9.49 depicts the engagement for the three cases. We conclude that the higher the navigation gain the tighter the engagement and the smaller the miss

Table 9.1 Summary of horizontal engagement

Navigation gain

Time of flight, s

Mach number at intercept

Miss distance, m

2

No intercept occurred

3

8.05

2.5

2.59

4

7.69

2.8

1.31

distance. The missile with N— 2 fails completely to make the intercept. The details of the simulation can be found on the CAD AC CD. The INPUT. ASC file contains the parameters of the AIM5 missile like launch mass, reference area, autopilot parameters, initial conditions, etc., and aerodynamic tables and thrust character­istics are given in Modules A1 and A2.

Table 9.1 summarizes the engagement conditions. Based on this study we would select N = 4, wondering if we should not have increased the gain even further. How­ever, we must realize that the simulation is an idealized model of the engagement and does not include any noise sources. The effect of these real-world conditions requires a compromise between accuracy and stability. Higher gains lead to tighter but also less stable intercepts. The navigation gain of four is a good compromise.

To investigate further the reason for the failed run with N — 2, we plot the sideslip angle and the lateral acceleration for the three cases in Fig. 9.50. Note that higher navigation gains demand more lateral acceleration earlier, making the intercept more benign. With N — 2 the missile is so sluggish that it misses the target com­pletely and saturates its lateral channel after flyby.

. Horizontal engagement

. Horizontal engagement

AIM5 Air Intercept Missile

Подпись: ! Pitch.Yaw ! Trimmed C2 A1 A3 D1 D2 G4 Control Aerodyn. Forces Newton Rotation Impact

G1 _ G2

AIM5 Air Intercept MissileAIM5 Air Intercept MissileПодпись: | Pro-Nav I LOS I Straight C1 S1 G1 Guidance Seeker Target £ si

I Cl

сл C2 1 A2 I A1 « A3 D1 D2

Fig. 9.39 CADAC pseudo-flve-DoF air-to-air simulation: AIM5.

represents an air intercept missile with a solid, single-bum rocket motor, an accel­eration hold autopilot, simple proportional navigation, and a kinematic seeker.

Figure 9.39 depicts the modules of the AIM5 simulation. Each module in CADAC is identified by a two-character code, which is its subroutine name. For clarification a title is added. After the initialization the integration loop starts with the Target Module G1 and ends with the Kinematic Module D2. The integration loop continues until the missile has reached the closest point to the target. Then the Impact Subroutine G4 is executed to stop the mn and to display miss distance information. The sequence of execution is: Gl, G2, SI, Cl, C2, A2, Al, A3, Dl, D2, and finally G4.1 will describe these modules in the same order.

AIM5 Air Intercept Missile

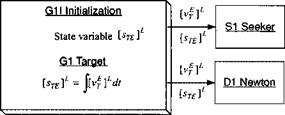
The Target Module Gl of an air-to-air missile can be very complex owing to the fact that airborne targets are highly maneuverable and take evasive actions. The SRAAM5 simulation has all of the details, but here we keep the model simple and limit ourselves to targets that fly straight at constant speed. The Target Module, see Fig. 9.40, consists of two subroutines: the initialization subroutine, which prepares the state variable |>г£]і for integration, and the actual target subroutine, which calculates the position of the target by integrating the velocity [vj ]L. Both vectors are sent to the SI seeker and Dl Newton Modules for further processing. Because we assume constant target velocity, the three components of the vector [vf ]L are provided just as input.

The Environmental Module G2 calculates the air density, pressure, temperature, and speed of sound. We make use of the ISO 1962 atmosphere (see Sec. 8.2.1). Accordingly, the temperature and pressure calculations are separated into two altitude layers: troposphere (< 11 km) and tropopause through stratosphere (11 —>• 80 km). The density calculations, based on the perfect gas law, are the same in both layers.

Figure 9.41 provides the atmospheric equations in SI units. In addition, the Mach number and dynamic pressure calculations are given. These parameters are used in the АЗ, C2, and A1 Modules. For backpressure calculations the atmospheric pressure is also needed in the A2 propulsion module. We encounter some problems with the input variable velocity V and altitude H. Following the calling sequence, they are established in D1 after the computations in G2. However, this is not too serious because the time lag is only the length of the integration interval. For the first time computation the initial values of V and H come from the input file.

The Seeker Module SI was discussed in the preceding section. We use the simple kinematic seeker as depicted in Fig. 9.30. In our case we do not model the INS module, i. e., we assume perfect knowledge of the transformation matrix [TBL, which is calculated in the D2 kinematics module.

The Guidance Module Cl has also been detailed earlier in Fig. 9.23, and again the INS is assumed perfect.

The Autopilot Module C2 fashions the acceleration feedback autopilot (Sec. 9.2.3.1) with integral and proportional feedforward. Six state variables are initial­ized in C2I. They correspond to the Laplace transform variable s in Fig. 9.42: the integrator of the PI compensator and the first-order transfer functions of the rate loop and incidence angle lag dynamics.

The acceleration commands come from the guidance module and are expressed in normal acceleration (positive up) and lateral acceleration (positive right). In an actual autopilot the feedback signals come from accelerometers, either body mounted or as part of the INS. For our simple simulation we use the idealized acceleration, calculated in the A3 Forces Module.

The output of our Autopilot Module is in terms of incidence angles. As you may recall from our discussion in Sec. 9.1.1, pseudo-five-DoF simulations use autopilot transfer functions to model the attitude dynamics. The incidence angles are the output, ready to be used in the aerodynamic tables of the A1 Aerodynamic Module. However, be aware that in the real world the autopilot output are pitch yaw and roll control commands to the control surfaces, which in turn, through the surface deflections, generate moments and produce incidence angles that generate the aerodynamic forces.

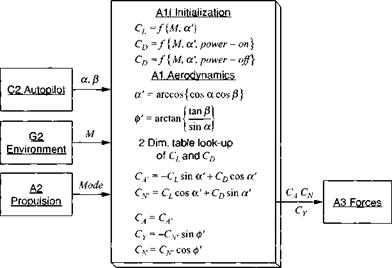
The Aerodynamic Module A1 determines the aerodynamic coefficients from the trimmed aerodynamic tables, provided in the A1 Initializing Module. Because our missile has tetragonal symmetry, we chose the model of Sec. 9.2.1.1. The lift and drag coefficients are a function of Mach number and total angle of attack a’. Drag is also affected by the exhaust plume of the rocket. We must therefore carry two tables power-on and power-off drag.

The two incidence angles, as depicted in Fig. 9.43, arrive from the autopilot and are converted into aeroballistic incidence angles a’ and ф’. With a’, Mach number, and the power flag, the tables are interpolated for Cl and C’D. Before the body coefficients CA, Су, and CV can be sent to the A3 Forces Module, we

AIM5 Air Intercept Missile

AIM5 Air Intercept Missile

Fig. 9.43 A1 Aerodynamic Module.


have to transform Cl and Co to aeroballistic axes and then through ф’ to body axes.

AIM5 Air Intercept Missile AIM5 Air Intercept Missile AIM5 Air Intercept Missile AIM5 Air Intercept Missile

The A3 Forces Module converts the coefficients into aerodynamic forces, com­bines them with the thrust from the Propulsion Module A2, and sends them to the Module D1 to be used in Newton’s equations (see Fig. 9.44). It also prepares the specific force [/sp]B, the ideal measurement of the accelerometers, to be available for the autopilot. The A3 Modules perform an additional task. The transformation

AIM5 Air Intercept Missile

Fig. 9.45 D1 Newton Module.

matrix [T]BV, derived in Eq. (9.8), is calculated from the incidence angles, pro­vided by the autopilot and is sent to the D1 Newton Module and the D2 Kinematics Module.

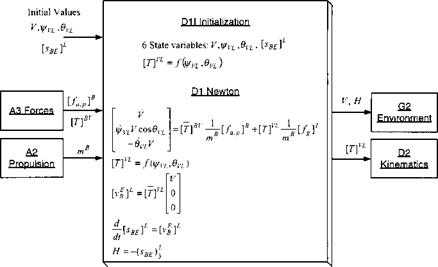
The D1 Newton Module is the center of the simulation. Here, the state variables of the vehicle (velocity and displacement) are integrated, starting from the initial conditions. The equations of motion, Eq. (9.27) for flat Earth, are programmed (see Fig. 9.45). They solve for the vehicle speed V and the flight-path angles i^vL, Ovl – At this point the [T]VL transformation matrix Eq. (9.21) is also required for the conversion of the gravity acceleration to velocity coordinates. However, for [T]VL to be available for the first integration, it must be initialized using the initial flight-path angles. After converting the velocity vector to local-level coordinates, the location of the c. m. В of the vehicle wrt an arbitrary Earth reference point E is obtained by integration. Speed V and altitude H are sent to the environmental module and the transformation matrix [T]VL to the Kinematic Module.

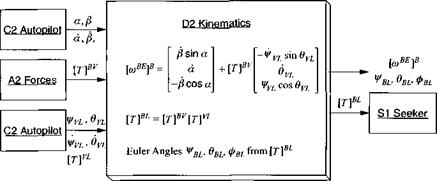
The D2 Kinematic Module, Fig. 9.46, is intrinsic to the pseudo-five-DoF im­plementation. Instead of integrating Euler’s equations, as in full six-DoF simula­tions, we derive the body rates [eoBE]B from kinematic relationships, as outlined in Sec. 9.1.5. From Eq. (9.26) we determine the body rates, and Eq. (9.22) provides us with the direction cosine matrix. Figure 9.46 reflects these equations and the extraction of the Euler angles iJ/BL, ввь, Фві from the direction cosine matrix.

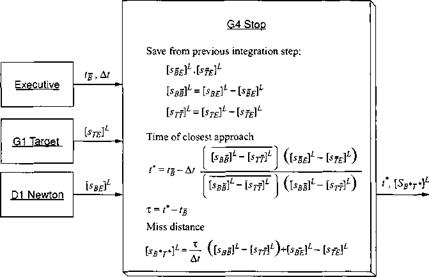
The G4 Stop Subroutine, Fig. 9.47, is not a module as CADAC defines it. It is just a subroutine, called by SUBROUTINE STAGE3, and without the initialization capability of a module. Its purpose is to stop the run and print out intercept time and miss distance.

To get an accurate calculation, a linear interpolation is carried out between the last two integration steps. When the closing speed between the missile and the

AIM5 Air Intercept Missile

Fig. 9.46 D2 Kinematic Module.

target aircraft switches sign, the run is terminated, and the two displacement vectors of the missile sHfj’ and the target sTg ]7 between the last two integrations are calculated. Refer to Fig. 9.47 for the equations, which were derived in Problem 2.9. The integration time step Af and the run time of the next to the last integration step tg are provided by the CAD AC executive routine.

We have circled the whole loop of Fig. 9.39 and defined the major features of each module. I have left off some minor calculations that would have only cluttered the figures. You can find these details in the source code of the AIM5 simulation, stored on the CAD AC CD.

AIM5 Air Intercept Missile

Simulations

Modeling and simulation are closely related subjects. So far, in this chapter, I concerned myself with the modeling of kinematics, dynamics, aerodynamics, propulsion, autopilots, guidance, and seekers. I derived the principal equations and indicated their validity, applicability, and limitations. To advance to the next stage of building a simulation, we have to proceed from theory to praxis. As often, the praxis is much more complex than the theory leads us to believe. Building a simulation is a tedious, time-consuming process, whose reward lies only in the final accomplishment. Hopefully, you have a sample simulation as a baseline, and your job is to modify it for a new application.

In this section we focus on the CADAC simulation environment. You should have read by now Appendix B, explaining the CADAC architecture and be familiar with its basic modular structure. By necessity, I had to be selective and chose as a prime example the simple air-to-air missile AIM5. The detailed description should enable you to build the simulation by yourself. However, just in case you do not have the time or patience, you can download it from the CADAC CD. A more sophisticated version of an air-to-air missile, the SRAAM5 simulation, is documented briefly and can also be found on the CADAC CD. For the cruise missile enthusiast I provide the CRUISE5 model with turbojet propulsion and GPS guidance. If you want to gain proficiency in five-DoF modeling, you should conduct the appended projects that will introduce you to the FALCON5 aircraft and the AGM5 air-to-ground missile.

The modular structure of CADAC allows us to deal with each subsystem of the vehicle separately. I have taken advantage of this characteristic already when I discussed the implementation of individual modules in the preceding sections of this chapter. One key feature is the control of the interfaces between the modules. Only because of their strict enforcement is it possible to exchange modules among simulations and across organizations. Utility programs, provided on the CADAC CD, help you to maintain these interfaces and integrate other modules with minimal effort.

EO sensors

9.2.5.4 The technology leaps in focal plane arrays have made the EO sensor an excellent candidate for missile seekers. Detector costs have

plummeted, whereas array sizes have increased. In military applications the in­frared (IR) spectrum is preferred because it opens the envelope to adverse weather and night operations. We are particularly interested in the 8.5- to 12.5-дт wave band, where mercury-cadmium-telluride detectors operate at temperatures of 70 to 80 K. Besides passive sensors receiving the thermal energy from emitting targets or reflected natural energy, there are also active sensors under development that emit and receive IR energy in radar fashion. They combine a laser emitter with radar processing techniques and are therefore called ladars. Modern C02-based ladars operate in the 10.6-дт wavelength, an area in the spectrum where atmospheric attenuation is at a relative minimum.

We will concentrate here on the modeling of passive IR sensors, either used as hot-spot trackers or as imaging seekers. As in radar, our ambition is not in the detailed modeling of the processing algorithms—I leave this to the experts— but our interest is in a top-level representation of the errors that corrupt the LOS between the sensor and the target. The active ladar sensor, on the other hand, can be treated like a radar, and you can refer back to the preceding section for details.

Some of the important error sources of passive IR sensors are atmospheric attenuation (water vapor, mist, fog, rain, clouds), ground clutter, processing delays, and, of course, countermeasures. In addition, we have to model the dynamic errors like spectral target scintillation, radome diffraction, gimbal friction, cross coupling, and rate gyro errors. The dynamic errors were addressed in the section on dynamic seekers. In the following we look at the physical properties of the passive IR sensor and how they affect the acquisition and tracking performance.

IR sensors measure the heat energy and calculate the temperature gradients to produce a TV-like image at night as well as during the day. For a given sensor the acquisition range is a function of the radiation intensity of the target Jt, the S/N, the number of detectors n, and the dwell time calculated from the frame time 7/ over the search area Q (in steradian)

EO sensors(9.91)

Notice the similarities with the radar equation (9.84), The radar cross section has been replaced by the radiation intensity of the target Jt, and the scan and frame time are synonymous. However, the detection range is inversely proportional to the square root of S/N, whereas the fourth root applies to radars. The difference is based on the fact that the emitted energy has to travel the distance twice for radars but only once for passive IR sensors. К represents the sensor specific constant that contains such terms as aperture, focal length, detector detectivity, and losses. Equation (9.91) is valid for point sources against a clear background and without atmospheric attenuation. It describes the acquisition performance of a hot-spot sensor under ideal conditions quite well.

If the target is embedded in a background with variable spectral radiation emit- tance, like a vehicle traveling over land, the noise level of the system is increased, and the acquisition range is decreased likewise. This deteriorating effect depends on many variables, e. g., terrain type, sun angle, and seasonal changes. For sim­ple simulations we just increase the threshold S/N by the background conditions (S/N)c.

Atmospheric attenuation is expressed as a loss per kilometer in decibels. It is a function of temperature, visibility, and humidity, as well as the spectral band of the sensor, and is formulated as an incremental signal-to-noise ratio A(S/N)a. The threshold S/N is then

S/N = (S/N), + (S/N)c + Д (S/N)e R (9.92)

This equation is similar to Eq. (9.90) but warrants further explanations. The thresh­old S/N establishes the acquisition range through Eq. (9.91), i. e., as the missile approaches the target, the signal strength in the detector increases to a level so that the S/N for target detection is reached. Without ground clutter and atmospheric attenuation the sensor specifications require, for target detection to occur, that the signal must be above the system noise by a certain factor. This is expressed by the sensor (S/N),. Ground clutter raises this factor and is additive because we use logarithmic units. Furthermore, the atmospheric attenuation increases this factor even more; however, it is not constant but is a function of acquisition range.

To implement Eq. (9.92) in your simulation, keep a running account of this threshold S/N and calculate the acquisition range from Eq. (9.91) (do not forget to convert from decibels to natural units: x — 10dB/I°). As the missile approaches, the target and its LOS range become equal to the acquisition range and target acquisition occurs.

Once the seeker starts to track the target, the uncertainties are dominated by dynamic errors and not signal processing phenomena. Just consider that the beam width of an IR sensor in the 10-/i m wave band and with an aperture of 10 cm is 0.1 mr, small enough to be overwhelmed by dynamic errors.

So far, we have limited our discussion to targets that are essentially point emitters—far removed targets and objects with a strong radiating heat source fall into this category. Vintage IR seekers, like those of the Stinger and Sidewinder missiles, can only track such point sources. One of their drawbacks is that they are very susceptible to flare countermeasures. With the introduction of IR focal plane arrays, it has become feasible to image the target and to correlate the image with stored templates. If a match is found, the sensor locks on to the target and guides the missile to intercept. Sophisticated processing does not only acquire the target, but also classifies it and selects a particular vulnerable aimpoint. Turn with me now to a top-level discussion of these imaging seekers.

The image of such a seeker is either produced by a line scanner or a staring array. In both cases we consider the number of pixels on target: the more pixels, the higher the resolution of the target. Processing the temperature gradients from the pixels forms the image.

As the missile approaches the target and the threshold S/N is exceeded, the seeker starts to image the area where the target is expected to be located. The processor compares the temperature gradients with a prestored template of the target. When a match is found, the difference between the predicted and actual target location is used to improve the navigation solution. This imaging/update cycle repeats until the target fills the array completely.

Modeling of the acquisition phase consists of two parts. First, we calculate the threshold S/N from Eq. (9.92) and the associated acquisition range, Eq. (9.91). This procedure represents a deterministic approach. An alternate stochastic model is based on curves of the probability of acquisition vs range-to-target with the

target size and the atmospheric conditions as parameters. These curves, calculated or measured, approximate parabolas with vertices at the probability of one and de­crease with range. With p, the parabola parameter, the probability of acquisition is

Подпись: (9.93)р*ч ~ 1 4p

Developing the tables of p = f {target size, atmospheric conditions} can involve time-consuming tests and calculations. So, be forewarned! As a simplified model, I have used a linear curve fit of p as a function of target size at fixed weather con­ditions. To determine the occurrence of the in-range event of a particular computer run, draw a number from a uniform distribution. If Eacq is greater than that number, the seeker starts imaging the scene.

To ensure that the target is contained in the scene, the pixels must cover an area large enough to account for the pointing uncertainty of the sensor’s centerline. This uncertainty is primarily determined by the midcourse navigation accuracy. With the INS position error given by its standard deviation ctins and the targeting error by OTar, the pointing error is (in units of length)

EO sensors(9.94)

The second effect to be modeled is the target acquisition time, consisting of the template imaging and matching process. Before launch the three-dimensional target template is stored onboard the missile processor. It consists of high-contrast facets in the form of a wire frame model. Once the sensor is within acquisition range, the three-dimensional template is readied for correlation by projecting it into the plane normal to the LOS. The pixels of the focal plane must cover this two – dimensional picture and the uncertainty area surrounding it. The time to image and process the data is directly proportional to the number of the pixels such engaged.

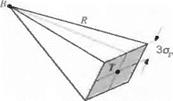
Each pixel has an instantaneous field-of-view of e,-, given in radians. A typical value is 0.75 mr. We calculate the number Na of pixels involved in the search process by covering three standard deviations or 99.7% of the pointing error (see Fig. 9.38):

EO sensors(9.95)

EO sensors

If we designate each pixel’s imaging time as At; and its processing time as Atp,

340 MODELING AND SIMULATION OF AEROSPACE VEHICLE DYNAMICS then the duration of the acquisition Ta is

Ta = Na(Ati + Atp) (9.96)

In your simulation tracking of the target should begin at the time the missile enters the acquisition range and acquisition time period Ta has elapsed. At this instant the first navigation update is sent to the INS and both the target location and INS navigation errors are reduced to the sensor’s uncertainties.

After the first update the error basket has been reduced significantly, particularly by the elimination of the targeting error. Before acquisition the navigation solution was carried out in an absolute frame of reference. After acquisition the missile guides relative to the target, thus making the absolute targeting error irrelevant.

During tracking, the size and dynamics of the target determines the numbers of pixels engaged in the imaging and correlation process. For a stationary target we take three times the linear size of the target lj. The number of active pixels is then

EO sensors

and the duration of imaging and processing is

T, — Nt(Ati + Atp)

Tt is significantly smaller than Ta, and, therefore, the update rate during tracking is faster than the acquisition time. Furthermore, most imaging seekers take advantage of the fact that imaging of the next frame can occur during processing of the preceding image. Because imaging is faster than processing, the update rate is determined by the processing of the pixels only. A 20-Hz update rate is the current state of the art. For a maneuvering target all pixels may be required to keep the target in the field of view. Then T, may not be much smaller than Tu.

The tracking accuracy of imaging seekers is not determined by the beam width of the pixels, but by the template matching process. During mission planning, photography is used to build a three-dimensional wire frame model of the target. If the aspect angles and the range at which the picture was taken are known imprecisely, an error will creep into the tracking performance. Moreover, during target tracking the aspect angles and the range are corrupted by the INS errors. Both phenomena, prelaunch and in-flight distortions, contribute primarily to the tracking errors.

The sensor measures the azimuth and elevation angles of the LOS to the target aimpoint. These angles are taken relative to the missile body. For gimbaled seekers they are the gimbal angles. The measurements are corrupted by the correlation process, consisting of the mission planning and tracking errors and the dynamic errors of the gimbals. For a well-designed and fabricated seeker the dominant errors are not caused by the gimbals but by the template matching process.

We model the mission planning and tracking angular distortions by em and er, respectively, and the range errors as Д Rm and Д Rt. The measurement errors in the azimuth and elevation plane can then be formulated by

£az — ^e, az(^m "b £f) "b ^ R, az{ARm + ARf) £el = Kss i(gm + £() + KR^(ARm + AR,)

where К are constants for a particular target, obtained from extensive testing and analysis. In your simulation you can keep the values of sm and A Rm fixed, whereas st and A R, are provided directly by the INS error model. If you execute Monte Carlo runs, you could interpret the values of sm and A Rm as standard deviations of a random Gaussian draw.

I have led you from simple kinematic seeker formulations to fairly complex imaging sensors and discussed both radar and IR implementations. As long as you pursue top-level system simulations, you should have enough information to model the seeker for your particular application—by the way, you can include these seeker models also in your six-DoF simulations. However, I caution you, if you should embark on building a specific simulation for the development of a seeker you must consult the seeker specialist and learn the finer points of seeker modeling.

Kinematic seeker

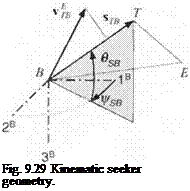
The main purpose of a seeker is to establish (acquire) and to maintain (track) the LOS to the target. We make use of this fact by defining the LOS displacement vector s tb of the center of the target T wrt the c. m. of the body B. With the help of the differential velocity vEB of the center of the target T wrt the vehicle frame B, we can calculate the inertial LOS rate ui0E of the LOS frame О wrt the inertial Earth frame E and send it to the guidance processor. The orientation of the LOS is measured relative to the body by the two angles psth вsb. the seeker azimuth and elevation angles, respectively. Figure 9.29 depicts the geometric situation.

We can derive from purely kinematic considerations the most important vari­able, i. e., the inertial LOS rates ujoe. We form the LOS vector *tb from the two displacement vectors of the vehicle sBE and the target s TE, where E is an arbitrary reference point on the Earth

Подпись:

Подпись: Fig. 9.29 Kinematic seeker geometry.

sTB = ste — sBE

then generate the unit LOS vector

S ТВ

НТВ = (9.75)

Is га I

We need also the differential velocity vector vfB, which we obtain from the inertial velocities of the vehicle and the target vf and vE, respectively:

vtb = vt~vb (9.76)

Now, the cross product of the two vectors will provide us with the LOS rate из0Е

Ш°Е = _L Utbvetb (9.77)

Isral

This equation has been derived without reference to a coordinate system and is therefore valid in any coordinate system. We express the LOS rate in body coordinates and the right-hand side in local-level coordinates

W0EB = ~^[T]BLUTB]L[vlB]L (9.78)

lira I

The onboard INS supplies the transformation matrix [T]BL.

For display purposes you can also calculate the seeker angles фзв and в$в from the unit LOS vector expressed in body axes

Подпись: (9.79)[utb]B — [T]bl[utb]L

from which you get the seeker angles as polar angles

(ига)|

— (итв)в

(ига)?

■y/[(Mra)f] + [(Mra)f]

ifsb = arctan

(9.80)

Also of interest is the closing speed, which is the relative velocity projected on the LOS

Подпись: (9.81)Vc = wFSl[v$b]L

It is negative if the target is closing on the vehicle. The time it takes the vehicle to intercept the target is calculated from the absolute value of the closing speed and the distance to the target. With the assumption of constant relative velocity and nonmaneuvering target, the time-to-go is

Подпись:_

g0_ |VC|

This simple kinematic model serves both radar and EO-type seekers. It rep­resents their ideal performance, unencumbered by field-of-view limits, gimbal dynamics, tracker errors, environmental and target effects. It is useful for simple simulations with emphasis on other than seeker phenomena. I use it to calculate synthetic LOS rates in midcourse based on INS information and to debug guid­ance simulations before incorporating the actual seeker model. Therefore, you will

Kinematic seeker

find it as a kinematic option in most of the CADAC simulations that incorporate seekers.

Figure 9.30 shows the implementation of the kinematic seeker in the S1 Module of a five-DoF CADAC simulation. The target and dynamics modules provide the kinematic variables to calculate the inertial LOS rates, converted to body axes by the transformation matrix obtained from the INS. Pay particular attention to the absolute velocity V that is sent to the guidance module. When I discussed the PN implementation, 1 distinguished between pure PN with V = | uf | and true PN with V = vjB. The INS can provide the vehicle velocity vf, but not the differential velocity VjB nor can a seeker measure the latter directly. Radar seekers, however, can supply the closing speed Vc of Eq. (9.81).

Although the kinematic sensor model serves mostly ideal seeker representations, it can be adapted to situations that are more realistic. For instance, for acquisition calculations you can use the ideal LOS range-to-gostb I: for field-of-view limits the seeker angles i! jsb and Osb give you the values to establish break-lock conditions; you can add noise to these angles or to the LOS rates to corrupt the true LOS, or you can even apply uncertainties to the target vector Vj to represent target measurement errors.

More realistic sensor models require detailed gimbal dynamics, system noise, target signature, environmental effects, and countermeasures. Most of these error sources depend on the operational frequency band. We will first treat the common dynamic effects and then address radar and FO sensors separately.

9.2.5.2 Dynamic seeker. Tracking of a target necessitates the persistent pointing of the sensor’s beam at the target. The difference between the true LOS and the beam is the tracking error, which is exploited by the tracking mechanism to keep the target in the field of view. Mechanical or electronic gimbals serve this purpose. In the case of mechanical gimbals, the sensor is isolated from the body by a gimbaled platform and is therefore called a gimbciled seeker. On the other hand, if the beam is steered electronically, the antenna is mounted on the vehicle body and is referred to as a strap-down seeker. Radar seekers can be of both types, whereas EO seekers are generally gimbaled. I will concentrate here on the more pervasive gimbaled seekers.

A voltage proportional to the tracking error torques the gimbals of the seeker. This voltage is proportional to the inertial LOS rate. You may remember that the PN law requires just this inertial LOS rate as input. Because the torquers are not

Kinematic seeker

Oiircr

Kinematic seeker

Fig. 9.31 Seeker platform with two gimbals.


fixed in the inertial frame but rather mounted on the body or the gimbals, rate gyros compensate for the body rates.

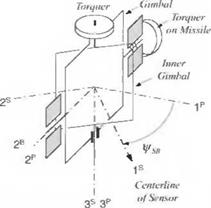
A typical gimbal arrangement is shown in Fig. 9.31. A motor, mounted on the vehicle body, torques the outer gimbal or pitch gimbal. Its associated coordinate system is p with the 2P axis coinciding with the vehicle’s 2B axis and the 1p axis displaced by the pitch seeker angle 6$в from the Iй axis (not shown). The inner gimbal, or yaw gimbal, is torqued about the 3P axis through the angle i]/sb to arrive at the inner gimbal coordinate system ]s. Lastly, the sensor’s beam is aligned with the Is axis.

Of interest is the TM [T]SB of the inner gimbal wrt the body coordinates. We acquire it by the sequence of transformations


о ФSB p f>SB

]s<— ]F<—


]B


depicted in Fig. 9.32


cos 6SB 0 – sin6sB 0 1 0

sin 6SB о cos 6SB


[T]PB


COS rj/sB – sin Ij/SB 0


sin iJ/sb о

COS lj/SB 0

0 1


and the multiplication of the two matrices


cos i]/SB cos 6SB – sin ф8в cos 6SB sin 6SB


sin rj/sB – cos Фзв sin eSB COS iJ/SB sin її/SB sin eSB 0 cos 6SB


[T]S£ = [r]sp[T]P£


(9.83)


Kinematic seeker

Kinematic seeker

Подпись: 1BПодпись: 3P = 3sKinematic seekerПодпись: Fig. 9.32 Seeker and body axes.
®SB’-

The angles foe and в$в are called seeker gimbal angles. You must limit them in your simulation to model the seeker gimbal limits and, for more realism, limit their time derivatives to represent the gimbal rate limits. Typical values for limiting gimbal angle and rate are 63 deg and 400 deg/s, respectively.

We now build the block diagram that is the basis for our gimbaled seeker model and consider several error sources and dynamic effects. Target scintillation is caused by spatial fluctuations of the reflected energy. If the wavelength is in the radio frequency (RF) spectrum, scatterers that are distributed over the target reflect different amounts of energy as a function of target attitude and aspect angles. For EO sensors energy in the visible or infrared spectrum is emitted or reflected from the target surfaces, giving rise to a similar phenomenon. We model scintillation as a random shift of the aimpoint О from the center of the target T. The stochastic model is a first-order Gaussian-Markov process applied independently to the three coordinates of the aimpoint displacement [sar]T in target axes. The standard devi­ations could be made a function of the aspect angles вот and – фот of the LOS wrt the target axes. Scintillation shifts the true LOS vectors re to a point at the apparent aimpoint О (see Fig. 9.33). We express the corrupted LOS [s0b in the local-level coordinate system ]L and therefore need to include the transformation matrix [T]TL

[s0BL = [T]tl[sot]T + bra]1

Подпись: 7OT

Подпись: Scintillation

Wot

Подпись: О[sor ] Istb ] _j_

Fig. 9.33 Scintillation.

Kinematic seeker

Fig. 9.34 Tracking errors.

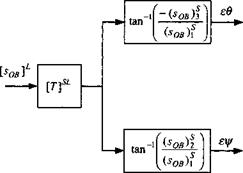
The tracking error is the deviation between the apparent LOS and the centerline of the sensor beam and is measured by the tracker in the inner gimbal coordinates. We transform sobl to the inner gimbal coordinates using Eq. (9.83) and the TM of missile wrt local-level coordinates [T]BL (see Fig. 9.34)

[^b]S = [Гр[Г]в1[^

The pitch and yaw tracking errors єв and єіД are obtained from the components as shown in Fig. 9.34. Because the tracking errors are small angles, we do not expect any trouble from the arc tangent function.

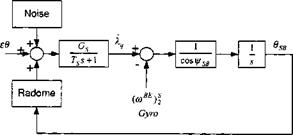
The tracking errors are corrupted by noise and radome errors. Processing of the incoming signal intoduces Gaussian-distributed noise with its standard deviation possibly a function of signal strength. The beam, penetrating the radome, is de­flected by the material properties of the radome such that the larger the seeker gimbal angles the greater the deviations. A linear relationship is commonly as­sumed with a typical value of 1% of the pitch and yaw gimbal angles. Signal processing introduces also a time lag that is modeled by a first-order transfer func­tion with time constant 7s and gain Gs. The output of the tracker torques the gimbals in order to zero the tracking error. This is in effect the inertial LOS rate kq that drives the PN guidance law (see Fig. 9.35).

Kinematic seeker

Fig. 9.35 Pitch tracker loop.

Kinematic seeker

Fig. 9.36 Cross coupling and output.

The torquing signal must be compensated by the vehicle body rates, as measured by rate gyros, mounted on the inner gimbal. For the pitch loop it is the variable (o)B£)f as shown in Fig. 9.35. Furthermore, because the pitch torquer is not located on the inner gimbal but is mounted on the vehicle body, the torquing signal is divided by cos i(rSB. Finally, the integrating effect of the torquing moment produces the pitch gimbal angle 6sb■ A similar loop exists for the yaw channel.

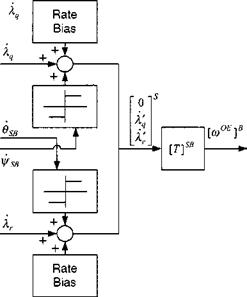
A possible rate bias and coulomb friction cross coupling can further corrupt the inertial LOS rate. The rate bias is caused by friction in the torquers about their respective axes, whereas coulomb friction is dry stiction, a function only of the direction of the angular rate, which couples the two gimbals. Figure 9.36 shows the signal flow of both the pitch and yaw LOS rates. Although the LOS rates are wrt the inertial frame, they are still expressed in inner gimbal coordinates. A final coordinate transformation [T]SB brings them into the form used by the guidance law, i. e., the angular velocity of the LOS frame О with respect to the Earth frame E (inertial frame), expressed in body axes, namely [coOE]B.

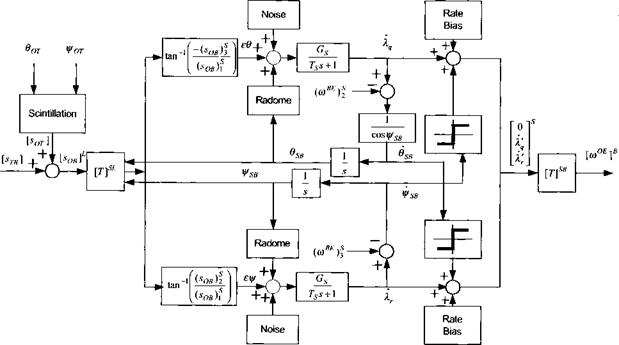
To sum up, Figs. 9.33-9.36 are combined and presented in Fig. 9.37. The tracker loops are now closed, feeding back the gimbal angles to form the TM [T]SB, which multiplied by [T]BL yields [T]SI.

Figure 9.37 represents a fairly detailed seeker model, suitable for five – and six-DoF simulations. With the appropriate error values it models missile seekers, both for air-to-air active radar and air-to-ground EO seekers. It can also be used for aircraft acquisition and tracking radar. If the gimbals are reversed, i. e., the outer gimbal rotates about the vehicles vertical axes (outer yaw gimbal), then Eq. (9.83) must be changed, but the block diagram remains essentially intact. The

Kinematic seeker

Fig. 9.37 Dynamic seeker block diagram.


Подпись: FIVE-DEGREES-OF-FREEDOM SIMULATION 333

only modification is in the tracker loop. The 1 / cos ifrSB term is removed and the 1 / cos 6sb term instead inserted into the yaw channel. One feature that I have left out in the model is the gimbal dynamics. However, they are of such high bandwidth that they have little effect on the LOS rates and can therefore be neglected.

Primary challenges in seeker simulations are the building of the acquisition tables and the generation of error statistics. They will depend on the operational frequency of the sensor. Therefore, we have to discuss the physical implication of microwave and optical systems separately. First, let us treat radar seekers, followed by the EO systems.

9.2.5.3 Radar. The modeling task of radar can be extremely tedious if the signal processing details are the focus. Fortunately, for our simple five-DoF simulations we can adopt a top-level viewpoint and proceed with an error model that corrupts the true LOS. The error sources are target glint, clutter, radome diffraction, and, for gimbaled systems, servo noise, coulomb friction, and rate gyro bias. Electronic countermeasures can degrade both the acquisition and the tracking performance.

The acquisition capability of a given radar sensor is essentially a function of the radar cross section of the target a, the radar scan time Ts (scan duration), and the search area £2 (in steradians). The required level of the signal-to-noise ratio S/N for target detection can vary as a function of ground clutter, atmospheric backscatter- ing, or environmental conditions. For modeling purposes we consider a functional relationship of the acquisition range R, derived from the radar range equation

Kinematic seeker(9.84)

where К represents the sensor specific constant that contains such terms as av­erage power, aperture, receiver noise temperature, and system losses. To evaluate Eq. (9.84), S/N is expressed in natural units and not in decibels.

The radar cross section of the target, as presented to the seeker, is a function of the target attitude. We can therefore include the target aspect angle in the range cal­culations, possibly using tables that are functions of azimuth and elevation angles.

A more sophisticated model looks at the individual scattering points that inter­cept the transmitted electromagnetic energy and reflect portions of it toward the transmitting antenna. The total reflected energy, expressed in radar cross section, is in the form of a Rayleigh distribution (see Sec. 10.3.1.2). From one radar scan to the next, the radar cross section fluctuates according to the random draw from this distribution. This phenomenon is called scintillation. Given an acceptable false alarm rate, the probability of detection becomes a function of the S/N ratio, which is a function of the radar cross section. The greater the S/N ratio is, the higher the probability of detection. Tables relate these three parameters (false alarm rate, S/N, and probability of detection) for a particular radar and target configuration. If you want to bring your model to such a level of sophistication, consult the reference by Hovanessian and Ahn.23

These discussions are equally valid for aircraft and missile radars. In addi­tion, the aircraft radar may have the capability to keep track of several targets while scanning the search area for new opportunities. With this search-while-track
capability the radar computer maintains multiple target tracks that are displayed in the cockpit. The pilot assigns a missile to a target, thus transferring the target state to the missile guidance computer. After launch the missile steers toward the target, possibly receiving (via data link) further target updates. When the missile comes into acquisition range, it turns on its seeker and initiates the search mode. Assuming constant frame time Ts, the acquisition range is according to Eq. (9.84) inversely proportional to the fourth root of the search area. Therefore, the better the midcourse accuracy, the smaller the volume that needs to be searched, and the longer the range at which the target is acquired.

Once target lock has occurred, the seeker must continue tracking the target under adverse conditions like countermeasures, clutter, and atmospheric backscattering. If the noise should increase, the radar may be unable to retain track and may break lock. Hopefully, enough time remains to reacquire the target, or, if the countermeasures emanate from the target, the seeker can switch over to the home – on-jam mode.

A radar sensor measures four quantities: range, range rate, azimuth, and elevation angles of the LOS. These measurements are converted into the displacement Stb of the target relative to the missile and the velocity v j of the target c. m. relative to the missile frame. The angular noise sources, depicted in Fig. 9.35, are of Gaussian nature with the same standard distribution for the pitch and yaw channels:

Obw

Oq = —— г—-

2VS/N

(9.85)

where 6bw is the antenna beam width in radians and the S/N ratio is decreasing with range according to the radar range equation.20 Range and range-rate measurements are also random with the following standard deviations

C X

°R ~ 4ys7N

(9.86)

Ws R 4VS7N

(9.87)

where c is the speed of light, г the pulse length, к the wavelength of the carrier, and Afs the Doppler filter bandwidth. As the missile approaches the target, the signal strength increases and so does the S/N ratio, resulting in improved measurements in all channels. Yet, disturbances like countermeasures, clutter, and backscattering can drive up the noise level, and scintillation becomes more pronounced toward the target.

Kinematic seeker Подпись: (9.88)

Clutter is the unwanted energy return from scatterers on the ground, which may enter the seeker through the main or side lobes. Particularly the altitude return through the side lobes can interfere with the target detection process. It is, in general, a difficult undertaking to model clutter accurately. We must be satisfied here with an approximation based on the modified radar range equation. The ground clutter S/N is a function of equivalent clutter radar cross section ac, radar scan time Ts (scan duration), and the search area Q:

Note that ground clutter decreases with the third power of range (as long as the radar beam is smaller than the clutter background.)

Atmospheric backscattering is particularly noticeable in heavy rain. It is a func­tion of the frequency band. The higher the frequency is, the stronger the effect becomes. Again we use the modified radar range equation, introduce the equiva­lent rain scattering cross section as, and formulate the backscatter S/N

(S/N), = К(9.89)

which decreases with the second power of range and, therefore, not as fast as ground clutter.

Fortunately, Doppler radar can detect targets in clutter and backscattering pro­vided these targets are moving like airplanes and cruise missiles. In effect, the clut­ter rejection of modem airborne radars is so good that the acquisition range is solely determined by system noise and can therefore be calculated by Eq. (9.84) alone.

For air-to-ground radar against stationary targets, clutter and backscattering are restricting the acquisition range severely. As an example, let the required system (S/N), for target detection be 10 dB. For a given radar against moving targets (no clutter or backscattering corruption), the acquisition range is, let us say, 10 km. If the target is stationary, it can be corrupted by ground clutter (S/N)e = 12 dB and possibly by rain scattering of (S/N), = 20 dB. Under these circumstances, the acquisition range moves closer to the target where the reflected energy from the target is at the higher level of S/N of

S/N = (S/N), + (S/N)c + (S/N), = 42 dB (9.90)

At that range the detectable signal is still 10 dB above the accumulative noise, as required. For our example, the acquisition range has been reduced from 10 to about 1.2 km by the ground clutter and rain scattering.

Once target acquisition has occurred, clutter and backscattering effects are low­ered significantly by predictive filtering. Therefore, system noise characterized by Eqs. (9.85-9.87) adequately models the radar tracking noise.

For a pseudo-five-DoF simulation you can start with a kinematic seeker and check out your code thoroughly. If you model an air-to-air missile, you can analyze its kinematic performance adequately and establish launch zones. However, if your interest is in miss distance, you need to upgrade your model to a dynamic seeker and include the major noise sources. For radar seekers you can follow the preceding format and generate the numerical values from the seeker’s specifications. If you design a new missile and the seeker does not exist, you should query the experts— good luck!—and establish several levels of error models. As a result of your analysis, you may be able to define these specifications and thus guide the radar developer in the design process.

Radar sensors, although they exhibit robust performance, may not be accurate enough for missiles with small warheads. Furthermore, their cost can be prohibitive for low-cost solutions. A viable alternative is the EO sensor operating in the visible or infrared spectrum.

Sensors

Sensors measure the states of a vehicle relative to a reference frame, process the data, and send the information to the cockpit display or the guidance computer for further action. They execute a distinct navigation task, contributing to the situational awareness of the vehicle. We restrict ourselves to sensors that establish the LOS to a point, be it an IP, aimpoint, or target. They are often referred to as seekers because they seek out the location of an object. At the risk of disappointing you, I will not discuss such navigation aids as star trackers, altimeters, angle of attack vanes, etc., but concentrate on microwave radar and electro-optical (EO) sensors found in aircraft and homing missiles.

Radar was conceived by the British during World War II to track incoming German aircraft. Ever since, it has been improved in power, accuracy, and flexibil­ity. EO seekers also had their crude beginnings during WWII in German guided missiles. They proved their deadly accuracy in the Gulf War. As we search the literature, we find many books on radar and optics, but few that relate to the task of sensing the LOS of an object. My favorite introductory text is by Hovanessian.20 He treats radar and EO sensors from an application-oriented standpoint. In addi­tion, I can recommend two handbooks that should be on your shelf as you wrestle with the modeling task of sensors: the infrared handbook by the company ERIM21 and the radar handbook by Skolnik.22

The main distinction between radar and EO systems is their operational fre­quency in the electromagnetic spectrum. The radar bands we consider are the X, Ku, and Ka bands. The EO wavelengths span the visible spectrum 0.38—0.76 ц. m

and the infrared spectrum 3—14 /im. Radars are active sensors, i. e., they emit the energy that they receive, whereas most EO systems are passive systems, relying on natural energy sources. An exception is the laser radar or ladar, which is an active sensor.

An aircraft or missile sensor has two distinct tasks: to acquire the target during the acquisition phase and to track the target during the tracking phase. Each phase makes different demands on the sensor. The acquisition phase requires the sensor to detect a target rapidly in a large search area, followed by accurate tracking possibly under adverse conditions.

Another distinguishing feature of sensors is the mounting type of the sensing element. A dish antenna would be mounted on a gimbal, but an array of wave guides can be mounted on a plate and bolted to the aircraft. EO seekers are usually placed on gimbals; however, advanced focal plane arrays lend themselves to body – fixed arrangements. Accordingly, we distinguish between gimbaled and strap – down sensors. Before we embark on these detailed models, let us take the kinematic approach of an ideal LOS pointing continually at the target—a simple but useful model.

CADAC implementation of line guidance

9.2.4.5 For the five-DoF CAD AC implementation, the guidance law is programmed in the Cl Guidance Module and provided with the necessary input from the INS Module S4, possibly updated by seeker information (see Fig. 9.28). Two components of the acceleration signal are converted to units in gs and sent as normal acceleration command aNc and lateral acceleration command aLc to the autopilot (see Autopilot Sec. 9.2.3.1).

CADAC implementation of line guidance

The key input parameters are the guidance gain К, the bias gain G, and the representative norm-distance d. The autopilot will convert the lateral acceleration commands to bank-angle commands if the vehicle is an aircraft or cruise missile.

You can find the line guidance law used in the CADAC CRUISE5 simulation for waypoint guidance and approach to an IP. Given these examples, you should be able to adopt line guidance to your particular needs.