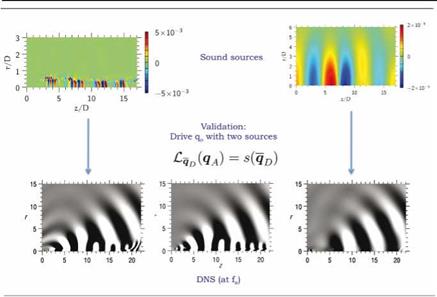
Category Noise Sources in Turbulent Shear Flows

Case study 2. High-resolution LES

The foregoing case study was considerably simplified by the relatively organised character of the flow solutions obtained using DNS and LESmr. In this case study (taken from Kerherve et al. (2010)) we consider a Large Eddy Simulation (Bogey et al. (2003)) with a higher order numerical scheme, which provides a flow solution with a broader range of turbulence scales in the noise producing region of the flow. This flow thus presents a greater
challenge in terms of flow feature eduction, and is in this respect a step closer to the high-Reynolds number experimental context.

tll/D=5.143

ORIGINAL LES CALCULATION

Case study 2. High-resolution LES

О г 4 6 8 10 13 14

x/D

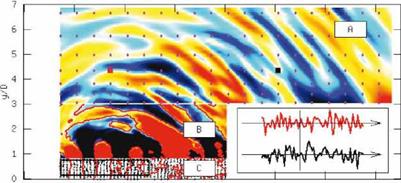
Figure 25. Large Eddy Simulation solution of Bogey et al. (2003), as used by Kerherve et al. (2010). Zones A: linear acoustic region; zone B: nearfield, transition from non-linear hydrodynamics to linear acoustics; zone C: non­linear turbulent region.

A two-dimensional slice of the flow solution is shown in figure 25. Again, in the spirit of the analysis methodology outlined in section §3, we consider, separately, the acoustic region, where we define what is to be our observ­able, q^, and the flow region, where we are interested in reducing qD down to qD. As seen in figure 25, the flow zone has been further split into zones B and C; the reason for this is that these zones present quite different be­haviour. In zone C the flow is turbulent, non-linear, dominated by confused vortical motion, whereas in zone B fluctuations are predominantly irrota – tional, and a transition is observed, as we move radially through this region, the flow motions going from being dominated by hydrodynamics to being dominated by acoustics. It is often in this region of the flow, particularly in high Reynolds number experimental contexts, as the short historical note in section §3 outlined, that the signature of coherent structures is most easily observed.

Because of the greater complexity of both the flow and sound fields computed by this LES, we refine our definition of qA by filtering the sound field so as to only retain fluctuations associated with low-angle emission, which is believed to be predominantly contributed to by coherent structures. A frequency-wavenumber transform and subsequent filtering allows this to be achieved. The procedure works as follows. For each y— position in zone A, the pressure field is Fourier transformed from (x, t) to (kx, a):

p(kx, y,u)= [(p(x, y,t)e~j(ut+kxX’> dtdx. (110)

1

(кх-и/с(ві))4

a4

Подпись: ^(a? kx) Подпись: exp Подпись: if kx < ш/с(ві) otherwise Подпись: (111)

A bandpass filter is then applied, which, for a given frequency, retains wavenumbers in the range w/c(61) < kx < ш/с(в2) where c(ei)=co/cos(ei) and в і denotes a given radiation direction. The bandpass filter is defined as

The filtered pressure is then recovered by inverse Fourier transform after application of the frequency-wavenumber filter,

Подпись: Pf (x,y,t)pj(kx, y, a)Q(a, kx)ej(ut-k*x) dA dkx. (112)

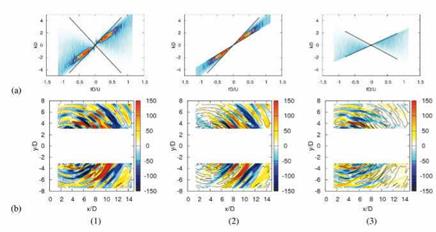
The results of the filtering are shown in figure 26. On the left the en­tire propagating field is shown in both frequency-wavenumber and physical space. The middle and right figures show, respectively, sound radiation in the angular sectors 0° < в < 60° and 60° < в < 120°. The space-time field corresponding to the middle image is considered the acoustic observ­able, qA, and we now use this to construct a filter, FqA, by which we can eliminate, from the full flow solution, any information not directly associ­ated with sound production. What remains is then considered the sound producing flow skeleton, which we can subsequently proceed to analyse and model.

Linear Stochastic Estimation The method used in order to perform the said filtering is based on Linear Stochastic Estimation, which provides a means by which an approximation of a conditional average

q(x, t)=< q(x, t)|qA(x, t + t) > (113)

can be obtained. For the specific case considered in this study, q will be either the hydrodynamic pressure or the turbulent velocity, associated with

Case study 2. High-resolution LES

Figure 26. Top row: segments of frequency-wavenumber spectrum corre­sponding to radiation in different angular ranges; bottom row: correspond­ing instantaneous fields. Left column: 0° < 9 < 180°; middle columne: 0° < 9 < 60°; right columne: 60° < 9 < 120°

the full LES solution, in zones B and C; qA is the acoustic pressure, filtered so as to only retain components radiating in the angular range, 0 < 9 < 60. The approach is used to determine, independently, conditional averages (which are here a function of space and of time) of the turbulent velocity and the pressure in zones B and C[18]:

U(x, t) =< u(x, t)pA(y, t + T(x|y)) > (114)

p(x, t) =<p(x, t)pA(y, t + T(xy)) >, (115)

where the time delay t(xy) corresponds to the propagation time between each flow point and each observer (obtained by means of ray-tracing).

As LSE is comprehensively dealt with in section §5 we here simply re­call the main result, which is that the above conditional average can be

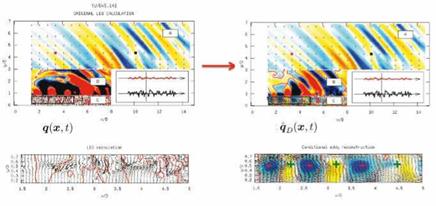
A sample of the result is shown in figure 27. Note the differences in flow field structure, in zones B and C, between the full Large Eddy Simulation solution (q(x, t); figure on left) and the result obtained by Stochastic Esti­mation (q(x, t); figure on right). The quantity shown in zone B is pressure, while in zone C both pressure and velocity are shown (the bottom part of the figure shows a zoom on the section of zone C indicated by the black rectangle in the top part of the figure). In zone C, the velocity field is indi­cated by means of black arrows (showing the velocity vector in the plane), and the skeleton of the pressure field can be discerned by means of red iso-contours indicating p(x, t) = 0 or p(x, t) = 0. In the case of u(x, t) the gamma criterion has been used to colour the velocity field. This quantity, often used as a visual aid for the study of coherent structures (Graftieaux et al. (2001),) is defined as:

Подпись: UP = U UMdS, (119) Г(Р) = U PM * ,(Um – Uf,>| A dS with

S Js ||PMH • IIUm – UP||

Case study 2. High-resolution LES

Figure 27. Left: Zone A: Low-angle filtered acoustic field; zones B and C: full LES solution. Right: Zone A Low-angle filtered acoustic field; zones B and C: conditional (filtered) flow, qp

where P is the point where the function is evaluated, M lies in the region S centered on P-generally chosen as a rectangular area, z is the unit vector normal to the measurement plane, UM and Up are the velocity vectors at point M and P respectively, and N is the number of point in S.

The result shown in figure 27 suggests the kind of wavepacket radiation observed in the previous studies. In zone C we observe a convected train of coherent vortical structures carrying a corresponding succession of positive and negative hydrodynamic pressures. The fact that the pressure and ve­locity fields are estimated independently, and yet produce a result that is, qualitatively, physically consistent (high and low hydrodynamic pressures carried, respectively, by vortical structures and saddle points ), justifies our thinking about the result, q(x, t), as a sub-space of the flow.

We can now study this filtered field with a view to understanding what kind of simplified models might be appropriate where sound production is concerned. Two avenues appear worth pursuing: (1) We can decompose the field q(x, t) into orthogonal building blocks by means of Proper Orthogonal Decomposition; (2) we can study q(x, t) during periods of high-level sound emission in order to get a sense of what loud and quiet periods of flow activity look like. The first of these steps is of interest for two reasons. Firstly, the orthogonal building blocks constitute a basis that can help to characterise, and quantitively assess the degree of complexity (the number
of degrees of freedom) of, the flow kinematics. And, secondly, the same basis provides a possible framework within which to begin studying the dynamics of the reduced-complexity flow skeleton.

Proper Orthogonal Decomposition Proper Orthogonal Decomposi­tion (POD) is presented in some detail in section §5, we therefore here sim­ply recall the main equations and results, before applying it to the both the complete flow solution, q(x, t), and the reduced-complexity, filtered flow,

q(x, t).

The snapshot POD is used in this situation. The eigenvalues and eigen vectors of the two-time correlation function, R(t, t’), are first computed:

Подпись: (120)/ C(t, t’)a(n) (t’)dt’ = X(n)a(n)(t) JT

Подпись: C (t,t') Case study 2. High-resolution LES Подпись: i(x,t)ui(x,t')dx Подпись: (121)

where a(n)(t) are the eigen-vectors, X(n) the eigenvalues and the two-time correlation function, C(t, t’), is defined as,

with nc = 3 the number of components of the vector velocity field (when POD is effected on the pressure field, nc = 1) and T the duration of the data set. An associated set of spatial functions T(n)(x) can be obtained by projection of a(n) (t) onto the velocity or pressure fields:

T(n)(x) = / a(n)(t)uj(x, t)dt with i = 1,..,nc. (122)

iT

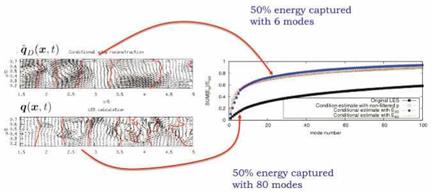
The result of the POD can provide two pieces of information. The con­vergence of the eigenspectrum, shown in figure 28, gives a sense of how many POD modes are required to represent the flow: if the convergence is rapid a large portion of the flow energy is captured with relatively few modes, if it is slow we require a large number of modes to capture the same energy. The former situation indicates that the flow is relatively organised, while the latter indicates a more disorganised flow. The spatial modes Ф) give us a sense of the characteristic spatial structures that dominate the flow.

The eigenspectrum, shown in figure 28, shows that while the eigenspec – trum associated with q has a slow convergence, 80 modes being required to capture 50% of the energy, that of q is considerably more rapid, only 6 modes being necessary to represent the same percentage of the associated fluctuation energy.

Case study 2. High-resolution LES

Case study 2. High-resolution LES

Figure 28. Eigenspectra associated with q and q


(a)


(b)


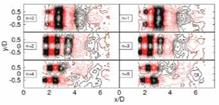
Figure 29. Eigenfunctions associated with q; (a): axial velocity; (b) radial velocity


Case study 2. High-resolution LES

Figure 30. Eigenfunctions associated with q: pressure.


Case study 2. High-resolution LES

The eigenfunctions, shown in figures 29 and 30, emphasise once again the orderly, wavelike character of q, in terms of both the velocity and the pressure fields, over the first five or so diameters. Two characteristic space scales can be distinguished in the velocity eigenfunctions: one is of the order of the jet diameter, manifest in modes 0 and 1, representative of activity towards the end of the potential core, and a second, smaller space scale is ob­served, in modes 2 through 5, representative of structures further upstream in the annular mixing-layer region of the flow. The pressure eigenfunctions are all characterised by similar scales; they peak farther upstream and there appears to be a distinction between modes 0 through 3, which have reflec – tional symmetry with respect to the jet axis, and modes 4 and 5 which are antisymmetric. These symmetries are most likely the two-dimensional signatures of axisymmetric and helical wavepackets.

Source mechanism analysis We now, finally, consider the space-time characteristics of q associated with high – and low-level sound emission. Comparison of the pressure signature on the centerline of the jet gives a

Case study 2. High-resolution LES

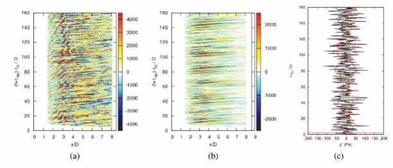
Figure 31. (a): (x, t) structure of full pressure (qp) on jet centerline; (b) (x, t) structure of reduced pressure (qp) on jet centerline; (c): black line: acoustic pressure (q^) at 30°; red line: short-time Fourier series of signal. Figure (c) has been time-shifted to account for propagation times, such that events at a given time are comparable with events in (a) and (b) at the same time-coordinate.

clearest indication of how the orderly component of the flow fields behave. Figure 31 shows this quantity for the full LES solution, qp(x,t) and the reduced flow, qp(xi, t), and these are compared with the acoustic signature,
q^(t), sampled at an angle of 30°. The latter has been time-shifted such that a direct comparison can be made with the two signals. Furthermore, the acoustic signal has been transformed by means of a short-time Fourier series and the result is shown in red. This operation provides a means by which the loud portions of the signal can be more easily identified.
Case study 2. High-resolution LES Case study 2. High-resolution LES

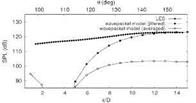
Examination of the figure shows the following. While it is difficult to discern any particular relationship between the hydrodynamic centerline signature of the full flow solution and the radiated sound, analysis of the same metric of the reduced field, qp, reveals a clear correspondence between the growth and decay of wavepackets (modulation of both their amplitude and axial extent is observed) and high-amplitude sound radiation. The fitting procedure applied in the previous study is repeated here using the filtered flow field, q, and the jittering line source ansatz. The result is shown in figure 32. Good agreement is found between the acoustic observable, q^,

(a) (b)

Figure 32. Comparison of sound field computed by Large Eddy Simulation with time-averaged and jittering wavepacket ansatz. (a) ansatz fitted with conditional field data, q, after radial integration; (b) ansatz fitted with conditiona field data, q taken from mixing-layer axis.

and the modelled sound field, q^, showing once again that the filtering procedure has been effective in the eduction of the sound-producing flow skeleton (kinematics).

4.2 Conclusions

Two case studies have been used, by way of example, in order to illus­trate implementation of the analysis methodology outlined in section §3. In both cases, by following the methodology, kinematic models are con­structed that mimic the sound-producing behaviour of the three different jets analysed. The quantitative accuracy is in all cases better than 1.5dB, showing the analysis methodology—which combines the data-analysis tools
presented in section §5 with the theoretical reasoning outlined in section §3—to be effective with regard to the kinematics of sound source mecha­nism identification. For the dynamic aspect further tools are necessary; these are presented briefly in section §6.

Case study 1. Moderate-resolution LES and DNS

We begin by performing a Large Eddy Simulation of a Mach 0.9, isother­mal jet, with nominal Reynolds number, Re = 400000. The details of the computation can be found in Cavalieri et al. (2010a). An image of the flow solution is shown in figure 17, where the first stage in the analysis method­ology is illustrated. We, of course, verify that the simulation shows good agreement with experimental results: at peak sound radiation frequencies

the LES is within 2dB of experimentally observed values.

Case study 1. Moderate-resolution LES and DNS

Figure 17. First stage of analysis: obtain Navier Stokes solution, q, which contains the acoustic observable, q^.

The next stage is to analyse the observable, q^. To do so we imple­ment the following signal processing: azimuthal Fourier decomposition is performed on the acoustic data on a cylindrical surface of radius, r = 9D, and which extends from x/D = 0 to x/D = 20; wavelet transforms are applied in the time direction, for each azimuthal Fourier mode. The rea­sons for this choice of data-processing can be found in the previous section: we saw in the experiment that the sound field is dominated by only three azimuthal Fourier modes; this being the case, it is legitimate and useful to break the sound field down into these building blocks. This will allow us to simplify the analysis. Also, we saw that coherent structures in jets display intermittency, and in peak radiation directions much of the overall sound energy arrives in temporally localised bursts. This suggests a link between the intermittency of coherent structures and peak sound radiation, and the models developed in the previous section illustrate how such source behaviour can indeed enhance the sound radiation efficiency of organised flow structures.

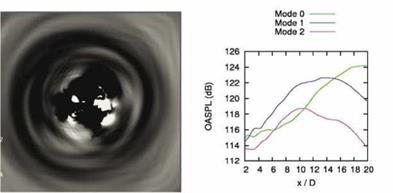
We can see in figure 18 that the downstream direction is, in agreement with what was observed experimentally, dominated by axisymmetric sound radiation. We will therefore focus on this component of the sound field, and see if we can ascertain the associated flow kinematics. Note the procedure that is being followed here: we are gradually eliminating flow information, thereby homing in progressively on the dominant aspects of the flow with regard to the acoustic observable. By doing so we simplify the task of analysing and later modelling the jet as a source of sound.

We now consider the temporal structure of the axisymmetric component of the sound field. Application of a wavelet transform[17] to the time history

Case study 1. Moderate-resolution LES and DNS

Figure 18. Left: instantaneous image of the jet, taken in a cross-section at x/D = 7; note the azimuthal organisation of the radiating pressure wave. Right: jet directivity as a function of azimuthal Fourier mode; note, con­sistent with image on the left, dominance of the axisymmetric mode in the downstream direction.

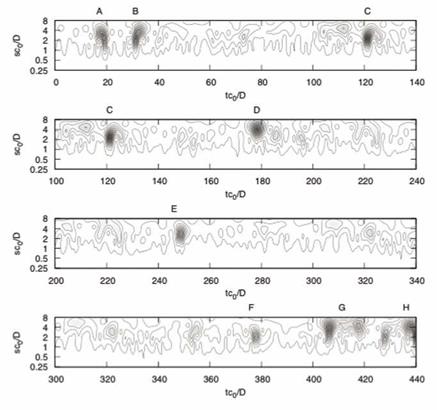
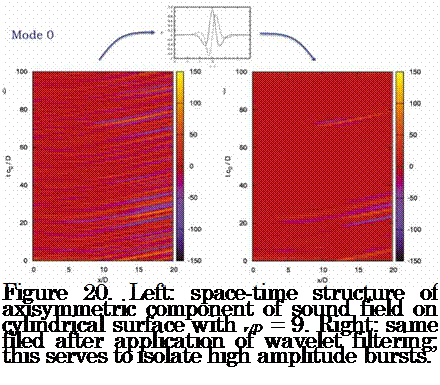
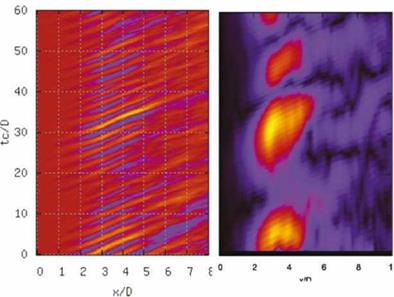
of the axisymmetric mode of the sound field at each axial station provides a corresponding scalogram. Figure 19 shows an example for the axial station, x/D = 17 (i. e. at low emission angle, в « 30°). A series of high-amplitude events, labelled A – H, stand out. By setting a threshold the scalogram can be filtered and the time signal reconstructed such that only the said events are retained. In what follows we concentrate on the first high-amplitude event. This filtering procedure is applied to the sensors at all axial stations and the result is shown in figure 20. We have here isolated one particular piece of the observable, ц_л(т = 0 ; 19 < tc0/D < 30), and from this filtered information we will now work our way back into the flow, qD, in order to analyse and understand the flow events that caused the high-amplitude sound pressure fluctuation.

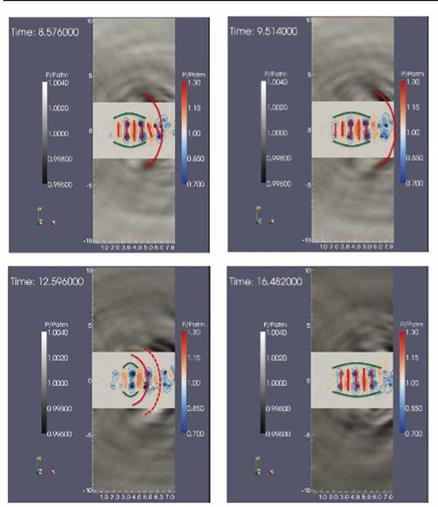
Figure 21 shows the flow at four consecutive times during the pro­duction of the said fluctuation. The following behaviour is observed. At t = 8.576 (top left) we see an axisymmetric wavepacket extending out to about x/D = 5, downstream of which the structures are tilted into some­thing closer to mode 1. As far as the axisymmetric component of the flow is concerned we therefore have a truncated wavepacket. We saw in section §3 how such behaviour can lead to enhanced acoustic efficiency, and, indeed, consistent with this, a high-amplitude depression is emitted from the flow

Case study 1. Moderate-resolution LES and DNS

Figure 19. Scalogram computed from the time history of the axisymmetric acoustic mode at r/D = 9, x/D = 17

at this time. This propagating wave is the same observed in figure 20 at (tc0/D « 20; 15 < x/D < 20). After the emission of this wavefront the axisymmetric wavepacket extends axially, as seen in figure 21 at t = 9.514, and then undergoes a second truncation, at both the upstream and down­stream ends (t = 12.596), at which point a second wavefront is released from the flow: this corresponds to the second depression observed, after wavelet transform, in figure 20, at (tc0/D « 25; 15 < x/D < 20). Finally, the axisymmetric wavepacket increases in both intensity and axial extent, as seen in figure 21 at t = 16.48, before collapsing a third time (not shown)

Подпись: Figure 20. Left: space-time structure of axisymmetric component of sound field on cylindrical surface with r/D = 9. Right: same filed after application of wavelet filtering; this serves to isolate high amplitude bursts.

and thereby releasing the third wavefront observed in figure 20.

The flow kinematics associated with the high-amplitude axisymmetric acoustic wavepacket is thus seen to comprise a drifting of the flow in and out of axially-extended axisymmetry; i. e. we have space-time modulation, or ‘jitter’ of an axisymmetric wavepacket. This behaviour is reminiscent of the observation of Crow and Champagne (1971) cited earlier: “three or four puffs form and induct themselves downstream, an interval of confused flow ensues, several more puffs form, and so on”. The third wavepacket ansatz proposed in section §3 would therefore appear to be appropriate. We recall the source model

By application of a short-time Fourier series (figure 22), followed by the fitting of a Gaussian envelope function (figure 23), values of A(t) and L(t) are obtained. Inserting these into equation 109 and then solving the wave equation with this as source allows us to assess to what degree our kinematic

Case study 1. Moderate-resolution LES and DNS

Figure 21. Visualisation of the hydrodynamic pressure within the jet at times corresponding to the acoustic wavepacket identified by wavelet trans­form in figure 20

source model, s(q, o), reproduces a result, q^, which is close to the acoustic observable q^- The result is shown in figure 24 , where the result of the model is compared with both the OASPL of the axisymmetric mode of

Case study 1. Moderate-resolution LES and DNS

Figure 22. Left: space-time structure of axisymmetric component of axial velocity fluctuation at r/D = 0.5; right: short-time Fourier transform of the data in figure on the left.

Case study 1. Moderate-resolution LES and DNS

Figure 23. Gaussian functions are fitted to the result of projecting the flow data on the short-time Fourier series. In this way, values for the instanta­neous wavepacket envelope amplitude, A(t) and length scale, L(t) can be obtained.

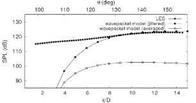
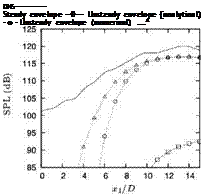
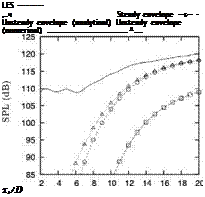
the LES, and a result obtained using a wavepacket ansatz where the time – averaged values of the A(t) and L(t) are used, i. e. a wavepacket that does not jitter. Whereas the non-jittering wavepacket shows a 12dB discrepancy

Подпись: DNS Steady envelope —0—- Unsteady envelope {analytical) - о - Unsteady envelope (numerical) A
Подпись: LES ,.ч Steady envelope —s— - Unsteady envelope (analytical) Unsteady envelope (numerical) д x1/D

Figure 24. Comparison of the DNS and LES sound fields, left and right, respectively, with those obtained using simplified, jittering source models.

with the LES, showing it to be clearly incorrect, the jittering wavepacket is within 1.5dB, suggesting that this kinematic description is physically pertinent: this confirms that this behaviour comprises flow directions that are aligned with the propagation operator. The same procedure applied to the DNS database produced similar agreement, as can be seen in figure 24.

The next stage in the analysis methodology, which is work in progress, is to repeat the above analysis with respect to the other azimuthal Fourier modes of the sound field, in that way building up a composite, simplified kinematic description of the jet as a sound source, at which point it will be possible to address the question of the associated simplified dynamic law. Tools for reduced order dynamical modelling are outlined briefly in section §6.
Two case studies

In this section we provide two examples of applications of the analysis methodology outlined earlier, focusing on the organised component of the turbulent jet discussed in the previous section; we also make use of the wavepacket sound source models of that section.

Let us begin by briefly recalling the analysis methodology: (1) we equip ourselves with complete or partial data from full Navier-Stokes solution[14]; (2) we then identify the acoustic observable, qA, and design a correspond­ing filter, FqA [15], used to extract the radiating flow skeleton, qD; (3) we construct a simplified kinematic source model, s(qD) (based on the models developed in section §3), and verify that solution of Lqa = s(qD) is such that |qA — qA| be acceptably small. The final stage of the analysis method­ology involves identifying the associated dynamic law; this aspect will be outlined briefly in section §6.
We use three different databases for the analysis, two LES and one DNS. The two LES use different numerical schemes, leading to one having higher space-time scale resolution than the other. We will refer to these as LESmd and LEShr, the subscripts denoting, respectively, moderate and high reso­lution. The DNS and LESmr therefore constitute databases where coher­ent structures are relatively easy to identify, on account, respectively, of the low Reynolds number and the moderate scale resolution. LEShR is more challenging, as it contains a broader range of turbulence scales, making the coherent structures more difficult to educe. In this case we are required to construct a filter based on Linear Stochastic Estimation (LSE).[16]

Coherent structures as a sound source

We now turn our attention to the mechanisms by which such coherent structures may be active as sound sources. We will work in the context of Lighthill’s acoustic analogy, whence by means of theoretical considerations it will be possible to gain some insight regarding pertinent simplifications. We are, therefore, in what follows, working in the context of steps 3, 4 and 5 of the analysis methodology outlined earlier; and with regard to the filtering operation, FqA, we are in context (iii).

The wavepacket source ansatz Mollo-Christensen (1967) appears to have been first to propose a mechanism by which coherent structures might be active as a source of sound. Observing that the nearfield pressure sig­nature of the subsonic jet presents a surprising degree of organisation in the (yi, t) plane, he suggested that such organisation could result in the jet behaving as a ‘semi-infinite antenna for sound’. Where this kind of sound production is concerned, a convected wavepacket constitutes a pertinent model for the organised component of the flow. Such a model, first ex­plored by Michalke (1971) and Crow (1972), continues to be widely used by researchers today, even if there is probably some disagreement with regard to the salient sound-producing features and dynamic law of such wavepack – ets.

Our presentation of the wavepacket sound source is organised as follows:

• We begin by introducing the basic wavepacket source ansatz, as pro­posed by Michalke (1971), Crow (1972) (see also Crighton (1975)),

• We then outline some of the arguments used to justify its simple line – source form: the elimination of the radial dimension is a good example of observable-based simplification,

• We next present a comparison of experimentally obtained acoustic data with the sound field characteristics of the wavepacket model,

• We then discuss, in greater detail, the radiation mechanism associated with wavepackets, exploring a number of different kinds of behaviour which lead to its being enhanced:

1. Spatial modulation,

2. Temporal modulation,

3. Temporally-localised wavepacket truncation,

4. Space-time ‘jitter’.

• Finally, we present, in section §4, two case studies, in which a num­ber of numerical databases (obtained both by Large Eddy Simula­tion and by Direct Numerical Simulation) are analysed, following the methodology outlined earlier, and the salient sound-producing fea­tures of wavepackets thereby educed.

The basic wavepacket model First attempts to explore the wavepacket ansatz as a kinematic model for the organised component of the jet were made by Michalke (1971), Crow (1972) (see also Crighton (1975)). The physical problem considered is that of small amplitude acoustic disturbances propagating through a quiescent, homogeneous medium, as a result of an externally-imposed source term:

9 p(x t) -^p(x, t) = s(y, t), (71)

Подпись: s(y,t) Coherent structures as a sound source Подпись: (72)

where the source takes the following form:

Подпись: p(x,t)Подпись:

Подпись: poUuM2(kD)2L^/n cos2 в 8|X Є

The solution of the spherical wave equation to an externally-imposed exci­tation of this kind is:

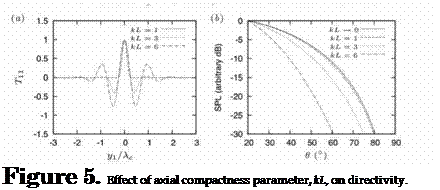
Подпись: Figure 5. Effect of axial compactness parameter, kL, on directivity.

where Mc is the Mach number based on the phase velocity of the convected wave, Uc.

As outlined in section §2, equation 73 results from a convolution of the source ansatz with the free-space Green’s function, this operation identify­ing the source characteristics to which the radiated sound field is sensitive.

Coherent structures as a sound source

One of these characteristics, visible in the solution, is the source compact­ness, kL. Figure 5 shows how for small values of kL the source is com­pact, while for larger values it becomes non-compact, exhibiting numerous oscillations over its spatial extent. The corresponding dependence of the sound field directivity is shown in the right-hand figure: the less compact the source, the more the sound field is ‘beamed’, due to an antenna ef­fect, to shallow axial angles. For kL = 6 the directivity pattern is close to exponential; sources exhibiting such exponential directivity are termed superdirective (Crighton and Huerre (1990)).

It can be seen in equation 72 that the source is concentrated on a line (by 5(y2)5(y3)). This may seem strange considering that the turbulent re­gion of a propulsive jet fills a volume that is approximately bounded by a conical surface. This simplification can be justified, however, by appeal­ing to the radiation efficiency of different azimuthal modes of a cylindrical source (which is a slightly better approximation to the real dimensions of a jet, particularly when one considers the regions of maximal turbulence intensity: these lie on such a cylindrical surface). In the following section we outline this justification; this is an exercise in system reduction based purely on theoretical arguments: we use the Lighthill acoustic analogy for­mulation to demonstrate how certain ‘directions’ of the source system can be disregarded: the conclusion that we come to is that equation 72 is a rea­sonable approximation for the coherent structures where low-angle sound emission is concerned.

Подпись: Tn(y,r) = p0UuR6(r — R)ei(uT-kyi)e Подпись: V2 . , L2 Cmeim* Подпись: (74)

Radiation efficiency of azimuthal modes The following is taken from Cavalieri et al. (2010b) and Cavalieri et al. (2011a), similar analysis being found in Michalke (1970). Consider a source term of the form

Подпись: _ PQUUR2 d2 P(x,t) = 4^c2|x| dt2 Подпись: e’K — ^ )-kyi]e Coherent structures as a sound source Подпись: (75)

Where m denotes azimuthal Fourier mode number, and Cm the correspond­ing Fourier coefficient. The corresponding solution of the wave equation can be written

We assume, without loss of generality, that the observer is at Ф = 0 and x2 = 0 in cartesian coordinates, where Ф = tan-1(x2/x3). The distance can be expressed, with a far-field assumption, as,

p(x, t) = poUUR2 d2 4nc2|x| dt2

Coherent structures as a sound source Подпись: |x|—yi cos 6— R cos ф s Подпись: 6 Подпись: -kyi Подпись: e Подпись: y? Подпись: m Подпись: (77)

where в is the angle of x to the jet axis. The solution thus becomes

p(x, t) =

poUuR2 d2 Г“ 4nc2|x| dt2 J_c

p2n

I1 = e1(mф)e(_1пStM cos ф s1n в)(ц

0

Подпись: e
Coherent structures as a sound source
Coherent structures as a sound source Подпись: )dф. (78) (79) (80)
Подпись: Фф,

which can be rearranged as

Coherent structures as a sound source Подпись: 0 Coherent structures as a sound source Подпись: (81)
Подпись: p2n

indicates the radiation efficiency of azimuthal mode m; i. e. the capacity of that azimuthal source mode to couple with the acoustic field.[13] This integral can be expressed in terms of Bessel functions Jm,

giving

I1 = (-i)m 2nJm(nStM sin в). (82)

For StM sin в = 0 the I1 integral yields 2n for m = 0, and 0 for all other values of m. This means that, if we neglect retarded time differences along the azimuthal direction, which is justified if this direction is acoustically compact (i. e., the acoustic wavelength is much larger than the azimuthal wavenumber, which being always smaller than the jet diameter, D, allows

Coherent structures as a sound source

Coherent structures as a sound source

the compactness criterion to be expressed in terms of the jet diameter: D/X = StM) only axisymmetric wave-packets can radiate. In other words, if the wave-packet diameter D is compact, or, if the observation angle в is small, only the axisymmetric wave-packet has significant radiation. This is always true for в = 0 and в = n, i. e. for an observer on the jet axis (Michalke (1970); Michalke and Fuchs (1975); Michel (2009)).

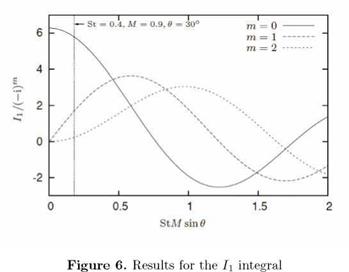
Figure 6 shows the Ii integral, divided by (— i)m so as to yield a real quantity. We see that the integral of m = 0 decays from its compact value of 2n, eventually goes to zero, and then oscillates. The integrals for the higher azimuthal modes are zero at the compact limit, as expected from the properties of the Bessel functions; they go from zero to a certain value, which is of the same order of the m = 0 integral, and then oscillate.

In order to appreciate the implications for a realistic jet flow, consider the sound radiation to low axial angles from a high Mach number subsonic jet. Taking в = n/6, M = 0.9 and St = 0.4, we have StM sin в = 0.18, and in this case, as seen in fig. 6, we can, if we have similar amplitudes Cm for the different m values, neglect all modes m > 0 and consider the compact limit (Ii = 2n for m = 0) as a first approximation; the Ii integral for m = 1 yields a sound intensity 10dB lower than that for m = 0, the integrals for higher m modes being lower still. Suzuki and Colonius (2006) have provided experimental evidence showing that the peak amplitudes, Cm, for azimuthal modes m = 0 and m =1 are similar, the amplitudes of mode m = 2 being

somewhat lower.

Подпись: p(x,t) Подпись: poUUR2 d2 2c2 |x| dt2 Подпись: Cce1 K‘ Подпись: | x | — y 1 cos 0 Coherent structures as a sound source Подпись: L dyi Подпись: (83)

If we retain only the axisymmetric wave-packet and approximate Ii as 2n, we have

Подпись: p(x,t) Coherent structures as a sound source Подпись: L2k2(1 Coherent structures as a sound source Подпись: (84)

and integration gives

which is the same result obtained using the line source in equations 71, 72 and 73. This means that for small values of the parameter StM sin в, the use of a wave-packet concentrated on a line leads to the same result as a surface wave-packet, justifying therefore the use of a line distribution for Til, whose amplitude is that of the azimuthal mean of the и fluctuation on the jet lipline. We will see, later, the extent to which this considerably sim­plified source model, and variants thereof, can mimic the sound-producing behaviour of a turbulent jet. In particular, we will be interested in some important additional modifications, identified thanks to the application of the analysis methodology outlined earlier, which are necessary in order that the ansatz be capable of producing quantitative agreement with the sound field radiated by the turbulent jet. First, however, let us examine some ex­perimental data, comparing, qualitatively, with the basic wavepacket ansatz outlined above.

Experimental evidence of wavepacket radiation The following re­sults are taken from Cavalieri et al. (2011b). The experiments were per­formed at the Bruit & Vent jet-noise facility of the Pprime Institute. The setup is shown in figure 7. The exit diameter of the jet is D = 0.05m, the flow is isothermal, and the exit velocity is varied over the Mach num­ber range 0.3 < M < 06; the corresponding Reynolds number range is

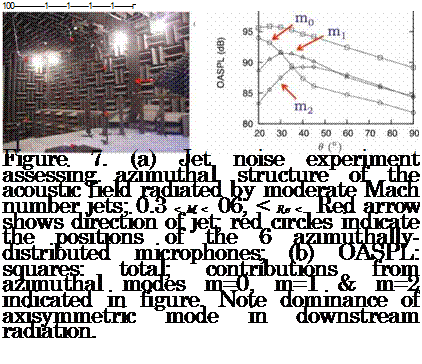
3.7 x 10⁵ < Re < 5.7 x 10⁵, and the boundary layer is tripped in all cases so as to ensure that at the outlet it is fully turbulent. Acoustic measurements are performed by means of an azimuthal distribution of six microphones at a radial distance of 35D, and the axial position of the ring array was variable. In this way the directivity of the sound field, decomposed into azimuthal Fourier modes, can be studied. These measurements can then be compared with the sound field of the wavepacket ansatz discussed above; in particular we focus on the axisymmetric component. Figure 7(b) shows the directivity in terms of both the overall SPL and the contributions from

(a) (b)

Подпись:
each of the first three azimuthal Fourier modes, m = 0, m =1 and m = 2. The axisymmetric component, m = 0, dominates the downstream radiation, sideline radiation comprising larger contributions from modes m = 1 and m = 2.

The dominance of the low-angle radiation by the axisymmetric mode is consistent with the foregoing analysis of the efficiency of azimuthal source modes, suggesting the existence of wavepacket radiation. By continuing to interrogate the experimental data with respect to the wavepacket model characteristics, we can evaluate the extent to which this model is pertinent.

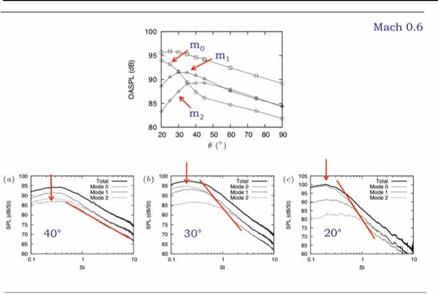
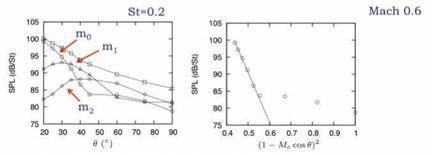
Concentrating now on the lower emission angles, assessing the power spectral density as a function of emission angle and azimuthal Fourier mode, we obtain the result shown in figure 8. As we move from 40° to 20° we observe the progressive emergence of the axisymmetric component of the power spectrum, and we note that this emergence occurs over a relatively narrow spectral range, with peak frequency StD = 0.2. The energy of the axisymmetric component of the sound field finds itself concentrated at low angles (highly directive) and across a relatively narrow range of frequency. At the lowest emission angles the peak of the overall spectrum is almost entirely axisymmetric, the energy of mode m = 0 being 10dB (that is one

Coherent structures as a sound source

Figure 8. Power spectra of azimuthal modes 0, 1 & 2 at low emission angles.

Coherent structures as a sound source

Figure 9. Narrowband-filtered (at StD = 0.2) directivity of azimuthal modes and comparison of axisymmetric mode with wavepacket ansatz. Ax – isymmetric component of experimentally obtained sound field is superdirec­tive (exponential polar decay) in agreement with the wavepacket model

Coherent structures as a sound source

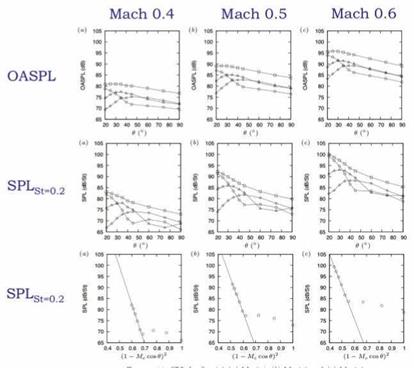
Figure 10. Azimuthal mode directivities as a function of Mach num­ber. Axisymmetric mode is superdirective for all Mach numbers; indicates wavepacket radiation even at low Mach number

order of magnitude) greater than the next most energetic azimuthal mode, m =1. The narrowband character of the emergence of the axismmetric mode, whose energy is concentrated at StD = 0.2, justifies an assessment of the directivity of the SPL in a narrow frequency range centered at this frequency. The result is shown in figure 9(a), where the downstream direc­tivity of the axisymmetric component at this frequency is even more marked. Comparison can now be made with the directivity factor of the wavepacket ansatz, (1 — Mc cos d)2; this is done in figure 9(b). The exponential char­acter of the axisymmetric component of the sound field, when plotted as a function of this wavepacket directivity factor again suggests that the asso­ciated underlying source mechanism is associated with an axially extended wavepacket of the kind modelled by equation 72. The term superdirectivity was coined by Crighton and Huerre (1990) to describe such directivity.

It is now of interest to study two further aspects of the experimental sound field: the Mach number dependence and the spectral scaling; both will allow further insight with regard to the possibility that the downstream radiation is underpinned by these relatively simply wavepacket source func­tions. Figure 10 shows the OASPL and narrowband-filtered SPL as a func­tion of emission angle for the different azimuthal Fourier modes of the sound field, as a function of jet Mach number. The result shows that precisely the same behaviour observed at Mach 0.6 is also observed at lower Mach number, suggesting that wavepacket radiation is a dominant mechanism for low-angle emission, even at low Mach number.

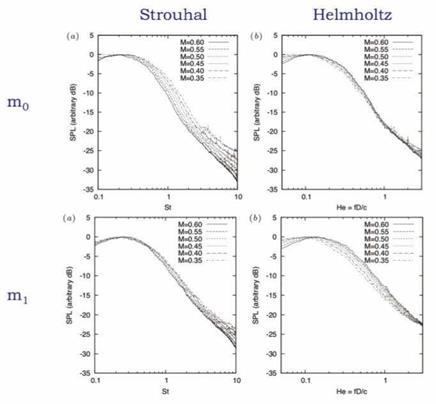
Finally, we assess the scaling of spectra for the modes m0 and mi, as a function of Mach number, for emission angle в = 30°. The result is shown in figure 11, where both Strouhal (StD = fD/Uj) and Helmholtz (He = D/X) numbers are assessed. For the axisymmetric component of the sound field we find that Helmholtz scaling best collapses the sound spectra. As the Helmholtz number is the ratio of a characteristic flow scale to a characteristic scale of the sound field, the fact that this parameter collapses the axisymmetric component of the sound field suggests that the associated source is non-compact, as it suggests that this component of the sound field is sensitive to the ratio between flow scales and acoustic scales; this would not be so for a compact source, where a clear scale separation exists between acoustic waves and flow eddies.

By comparing the experimental data with the details of the wavepacket ansatz, it is possible to make a quantitative estimate of the wavepacket compacntess parameter, kL, which can be written as

2П T

Lk = Mc HeD – (85)

Considering the jet at M = 0.6, we have, Mc = 0.36, He = 0.12 and D = 0.05. For the same jet the directivity of the axismmetric mode is char­acterised by a decrease of 15.6dB over the angular range 20° < в < 45°, which allows us to estimate that the compactness parameter, Lk = 6.5. Comparison with figure 5, gives a sense of the corresponding wavepacket structure; this value, which suggests that the wavepacket extends over an axial region of about 6D, is consistent with the analysis of Hussain and Zaman (1981), who educed coherent structures from low Mach number tur­bulent jets by means of conditional averaging of hotwire measurements.

Coherent structures as a sound source

Figure 11. Scaling of azimuthal modes 0 and 1. Axisymmetric mode scales best with Helmholtz number, He = D/X, suggesting that it is associated with a non-compact source. Substituting the experimental parameters into the wavepacket model we can deduce that Lk = 6.5; comparison with figure5 shows that this implies wavepacket with a spatial structure com­prising about three oscillations, extended over approximately 6D, i. e. from the jet exit to beyond the end of the potential core.

The radiation mechanism Let us now consider the details of the mecha­nism by which sound sources, and in particular, ‘coherent structures’, excite acoustic modes in turbulent flows. The mechanism can be understood by considering the acoustic analogy, written down either as a partial differen­tial equation, or expressed in terms of its integral solution; time-domain, frequency-domain and linear alebrai’c formulations of both the inhomoge­neous PDE and its integral solution can be helpful in understanding the essentials: the sound production mechanism can be thought about in three different ways; we can say that:

1.Space-time inhomogeneity of the source field is such that cancellation (in time-delayed coordinates) between regions of positive and negative stresses is incomplete; the fluid medium thus finds itself subjected to compressions and rarefactions that engender a propagative energy flux,

2.The propagation operator has an acoustic response to only those com­ponents of the source field that are acoustically-matched: those that satisfy the dispersion relation ш2 = c0|^|2; in terms of the integral solution we can say that the Green’s function filters out, from the full range of source scales, only those that satisfy that dispersion relation,

3.In terms of linear algebra we can say that the propagator maps to the farfield those components of the source with which it is aligned:

L У s(q).

In the case of the wavepacket, these different scenarios can be represented schematically as in figure 12.

Let us now consider a number of different kinds of physical wavepacket behaviour that can lead to such radiation, before going on to explore data from turbulent jets. The following is taken from Cavalieri et al. (2011a) and Cavalieri et al. (2010b).

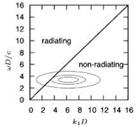
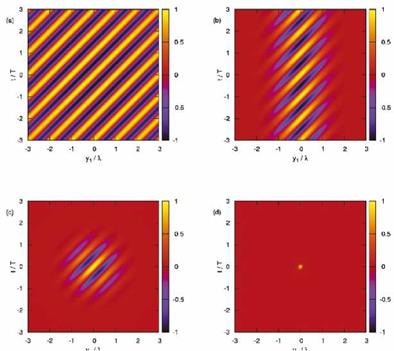
Spatial modulation The wavepacket characteristic most often referred to in the literature as important for the production of radiating sound en­ergy is its spatial modulation. A subsonically-convected spatial sinusoid of constant amplitude and infinite spatial extent contains only non-radiating scales, because ш < kxc. However, any truncation or spatial modulation of the amplitude of that wavepacket will cause its axial wavenumber spectrum to broaden, and in this way some of the wavepacket energy will find itself in the acoustically-matched region of the spectrum. Figure 12 illustrates this: (a) shows non-radiating and radiating space-time structures; (b) shows the frequency-wavenumber spectrum of a radiating wavepacket—the tail of the spectrum that finds itself in the radiating sector causes sound radiation.

Temporal modulation A further feature of the unsteadiness associated with the orderly part of a turbulent jet is its intermittency. The earlier cita­tions from Mollo-Christensen recognise this. A further citation from Crow

(c)

Coherent structures as a sound source
Подпись: (a)
Подпись: Cp - «(dl

Figure 12. Different ways of thinking about the wavepacket radiation mechanism: (a) Space-time representation: amplitude inhomogeneities lead to incomplete cancellation, and associated compressions and rarefactions; (b) frequency-wavenumber representation; mechanism can be thought of as a filter that only passes the source components that satisfy ш2 = c^l^l2; (c) Representation in terms of linear algebra: mapping to the farfield of source by propagation operator: directions of the source, s(q), that are parallel to the propagator, L, get mapped to the farfield.

and Champagne (1971) is also relevant; they observed, by means of flow visualisation, the appearance of a train of coherent ‘puffs’ of turbulence. These were characterised by an average Strouhal number of 0.3, but the authors noted how “three or four puffs form and induct themselves down­stream, an interval of confused flow ensues, several more puffs form, and so on”.

Coherent structures as a sound source
The effect of such intermittency can considered in a number of ways. Ffowcs Williams and Kempton (1978) were the first to consider a kinematic model for such behaviour; this took the form of a random variation of the phase velocity of the convected wavepacket, as shown in equation 86. In this case the wave envelope remains time-invariant.

Coherent structures as a sound source

changes in time, as does the position where it breaks down. A model for the former effect is

Coherent structures as a sound source

Examples of this kind of space and time modulation are shown in figure 14 and this leads to a radiated sound pressure:

Coherent structures as a sound source

Coherent structures as a sound source

Figure 14. Space – and time-modulated wavepackets.


with


Coherent structures as a sound source

(90)


f (yi


Coherent structures as a sound source

where c is the speed of sound in the undisturbed fluid and в is the angle of x to the jet axis.

Подпись: with Подпись: iwt p(x,t) = PQe Подпись: 2 Coherent structures as a sound source Подпись: 2itr cos $]2 Подпись: (91)

Evaluation of the integral of equation 90 leads to an analytical expression for the pressure in the far field:

which, after substitution in eq. (91), leads, as expected, to the earlier result for a purely spatially modulated wavepacket,

p(x, t) = — P0UuMc(kD)2Wncos2 вe-L2k2(1-Mc8)2 eiw(t-X), (98)

where Mc is the convective Mach number given by w/(kc).

We can define a source efficiency as the ratio between the acoustic energy,

the far field, and the turbulent kinetic energy, or “source” energy, given by

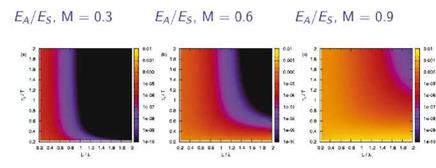
This allows an evaluation of the impact of changes in the space and time scales of the wavepacket envelope on the acoustic efficiency. Figure 15 shows this dependence. Note that the colour scale is logarithmic: at high Mach number small reductions in either the spatial or temporal extent of the wavepacket can lead to considerably enhanced radiation efficiency; the space-time localisation of a wavepacket is thus an important source param­eter: such behaviour in a jet comprises a flow ‘direction’ to which the wave operator is highly sensitive.

Coherent structures as a sound source

Coherent structures as a sound source

Figure 15. Wavepacket efficiency, as a function of space – and time-envelope scales, for different Mach numbers.


Подпись: Tii(y,r) Подпись: 7"T2 2 2poUUS(y2)S(y3)ei(^T-kyi)e-^ Подпись: (101)

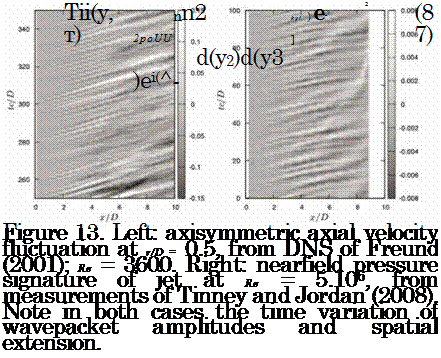
Temporally-localised envelope truncation In order to provide tem­poral changes in the spatial extent of the envelope function, in an effort to better model the wavepacket characteristics observed in figure 13, we can model Tii as

With this expression the peak amplitude of the convected wave is kept constant, but the characteristic length of the envelope, L, changes with time. We model the changes in L as

-t0)2

L(t ) = L0 — кє TL, (102)

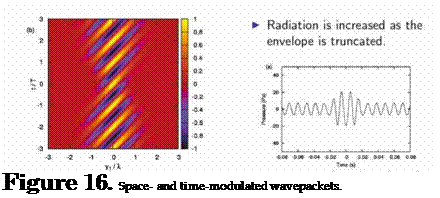
where L0 is an initial envelope width and к is the maximum envelope reduc­tion, which happens at t = t0. This reduction of the envelope occurs over an interval characterised by the temporal scale tl, and is modelled by a Gaussian function. Examples of this source behaviour are shown in fig. 16. The sound radiation is obtained in this case by numerical integration using this line source. A sample result is shown in figure 16: we note that the envelope truncation also leads to an enhancement of the sound radiation, again suggesting that this kind of unsteadiness, observed in the numerical and experimental data, may underpin the emission of high-amplitude acous­tic perturbations to the far field of turbulent jets: again, in the spirit of the system reduction at the heart of the analysis methodology evoked earlier,

Подпись: Figure 16. Space- and time-modulated wavepackets.

the propagation operator is sensitive to this kind of flow behaviour, and so such flow ‘directions’ should, again, be retained, i. e. explicitly modelled.

We now consider a final model, which takes us closer again to the be­haviour we observe in the data shown in figure 13. We wish to mimic the space-time ‘jitter’ manifest in the data, we must therefore capture the time variation of the wavepacket envelope in terms of both its peak amplitude and its axial extent. This final model combines the effects modelled individually in the two previous models.

Coherent structures as a sound source Подпись: (103)

Space-time ‘jitter’ Tii is now modelled as

Подпись: p(x,t) Подпись: p0UUD2 cos2 в d2 8c2|x| dt2 ei [w(V lx-yy°6) Coherent structures as a sound source Подпись: (104)

where we allow temporal variations of the amplitude Л, and also tempo­ral changes in L. This expression, used in conjunction with the far-field assumption, leads to:

If the amplitude Л and the characteristic length of the envelope, L, change slowly when evaluated at retarded-time differences (y1 cos в/c) along

Подпись: and Coherent structures as a sound source Coherent structures as a sound source Coherent structures as a sound source

the wave-packet, we can consider axial compactness for these functions in the integration, such thatConclusion

In this section we have considered the source modelling problem from the perspective of ‘coherent structures’. It has been shown how consider­able simplifications can be justified where the associated sound production mechanisms are concerned, these simplifications being for the most part de­rived from theoretical reasoning based on Lighthill’s acoustic analogy. In what follows we will explore some numerical databases, from which we will endeavour to extract and evaluate the salient source features through the application of a number of different analysis tools. These analyses closely follow the methodology outlined at the beginning of this section; and a de­tailed exposition of the various analysis tools implemented are described in section §5.

Order in chaos

The following series of citations gives a sense of the impression that this discovery made on researchers working in the field of both turbulence and aeroacoustics.

“The apparently intimate connexion between jet stability and noise gen­eration appears worthy of further investigation” – Mollo-Christensen and Narasimha (1960)

“[jet noise] is of interest as a problem in fluid dynamics in the class of problems which involve the interaction between instability, turbulence and wave emission” – Mollo-Christensen (1963)

“There appear to be at least two distinguishable types of emitted sound, one dominating at very low frequencies and another dominating at high frequencies. A relation which gives a smooth interpolation between these asymptotic ranges would prove useful, if one could be invented.” – Mollo – Christensen (1963)

“The data suggest that one may perhaps represent the fluctuating [hy­drodynamic] pressure field in terms of rather simple functions. For example, one may consider the jet as a…semi-infinite antenna for sound…” – Mollo – Christensen (1967)

“…although the velocity signal is random, one should expect to see in­termittently a rather regular spatial structure in the shear layer.” – Mollo – Christensen (1967)

“We therefore decided to stress measurements near and in the jets, hop­ing to discern some of the simpler features of the turbulent field. We also did measure for field pressures, and intended to see if we could not connect the two sets of observations somehow, using the equations of sound propa­gation.” – Mollo-Christensen (1967)

“It is suggested that turbulence, at least as far as some of the lower order statistical measures are concerned, may be more regular than we may think it is, if we could only find a new way of looking at it.” – Mollo-Christensen (1967)

“The mechanics of turbulence remains obscure, so that it comes as a matter of some relief to find that the motions which now interest us are co­herent on a large scale…Such large eddies might be readily recognisable as a coherent transverse motion more in the category of a complicated laminar flow than chaotic turbulence. In any event the eddies generating the noise seem to be much bigger than those eddies which have been the subject of in­tense turbulence study. They are very likely those large eddies which derive their energy from an instability of the mean motion…” – Bishop et al. (1971)

“These [measurements] suggest that hidden in the apparently random fluctuations in the mixing layer region is perhaps a very regular and or­dered pattern of flow which has not been detected yet” – Fuchs (1972)

“Whether one views these structures as waves or vortices is, to some extent, a matter of viewpoint.” – Brown and Roshko (1974)

“All this evidence suggests that the turbulence in the mixing layer of the jet behaves like a train similar to the hydrodynamic stability waves propa­gating in the shear flow.” – Chan (1974)

“The dominant role of the dynamics and interaction of the large struc­ture in the overall mechanism that eventually brings the two fluids into in­timate contact becomes apparent. It is clear that any theoretical attempts to model the complex mixing process in the shear layer must take this ubiq­uitous large structure into account.” – Dimotakis and Brown (1976)

“Turbulence research has advanced rapidly in the last decade with the widespread recognition of orderly large-scale structure in many kinds of tur­bulent shear flows…some measure of agreement seems to have been reached among investigators on the general properties of the coherent motions.” – Crighton and Gaster (1976)

“…the turbulence establishes an equivalent laminar flow profile as far as large-scale modes are concerned.” – Crighton and Gaster (1976)

“In the last years our understanding of turbulence, especially in jets, has changed rather dramatically. The reason is that jet turbulence has been found to be more regular than had been thought before.” – Michalke (1977)

“This ‘new-look’ in shear-flow turbulence, contrary to the classical notion of essentially complete chaos and randomness, has engendered an unusually high contemporary interest in the large-scale structures.” – Hussain and Zaman (1981)

The last twenty years of research on turbulence have seen a growing

realisation that the transport properties of most turbulence shear flows are dominated by large-scale vortex motions that are not random.” – Cantwell (1981)

“Suddenly it was feasible and reasonable to draw a picture of turbulence! The hand, the eye, and the mind were brought into a new relationship that had never quite existed before; cartooning became an integral part of the study of turbulence.” – Cantwell (1981)

As we see from many of the above citations, stability theory is frequently evoked as a possible theoretical framework for the dynamical modelling of the flow behaviour described above. However, a full treatment of hydrody­namic stability is beyond the scope of this lecture, and so we will simply list, briefly, a few of the different kinds of stability frameworks that are sometimes used to model the organised component of turbulent shear flows. We would also point out that the application of stability theory to turbu­lent flows, where the stability of a time-averaged mean-flow is considered, is not entirely rigorous (hydrodynamic stability analysis is self-consistent only when applied to laminar flows), involving a number of assumptions: one of these is that there exists a scale-separation between a large-scale organised component of the flow and a finer-grained, stochastic, ‘background’ compo­nent; the latter establishes a mean-flow profile that can sustain large-scale instabilities, and acts, furthermore, as a kind of eddy viscosity that damps the large-scale instabilities.

The first stability calculations with respect to the round jet were per­formed by Batchelor and Gill (1962) who studied the temporal stability problem for a plug flow. Michalke and Timme (1967) looked at the temporal instability of a finite-thickness, two-dimensional shear layer, while Michalke (1971) considered the spatial instability of a finite thickness axisymmetric shear-layer. Crighton & Gaster (1976) took account of the slow axial varia­tion of the shear-layer thickness. Mankbadi and Liu (1984) made an attempt to include the effect of non-linearities. Tam and Morris (1980) used matched asymptotic expansions to obtain the acoustic field of a two-dimensional com­pressible mixing-layer; Tam and Burton (1984) then extending this effort to the case of a round jet. More recent approaches have been based on linear and non-linear Parabolised Stability Equations, as used by Colonius et al. (2010) for example, and Global Stability approaches, applied for instance to the problem of heated jets by Lesshafft et al. (2010).

Turbulence and ‘coherent structures’

Soon after the first attempts by Lighthill and his successors to predict the sound radiated by turbulent jets a change occurred in the way turbulence is perceived. Turbulent flows were observed to be more ordered than had previously been believed, and a new conceptual flow entity was born, some­times referred to as a ‘coherent structure’, or, alternatively, a ‘wave-packet’. Mollo-Christensen (1967) was one of the first to report such order in the case of the round jet: “…although the velocity signal is random, one should expect to see intermittently a rather regular spatial structure in the shear layer.”. A series of papers followed, confirming these observations and pos­tulating on the nature of this order (Crow and Champagne (1971), Brown

Turbulence and ‘coherent structures’

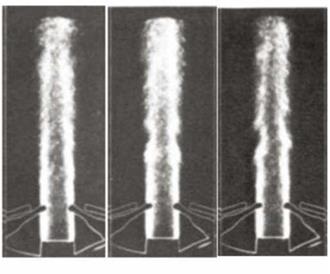
Figure 4. Flash Schlieren images of jets (Re = 5 x 10⁵; M = 0.83), taken from Moore (1977). Left: random ensemble average; middle: conditional av­erage using axisymmetric nearfield pressure signature as trigger; right: con­ditional average using a single nearfield microphone as trigger (this educes the antisymmetric organisation).

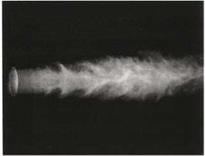
and Roshko (1974) and Moore (1977) to cite just a few). Figure 3(b), taken from Crow and Champagne (1971), provides a visual sense of this under­lying order: by changing visualisation technique, using sheet illumination and carbon dioxide fog, rather than the fine grained patterns revealed by the schlieren technique, an axially-aligned waveform with wavelength of the order of the jet diameter is observed.

A further illustration of the underlying organisation present in high Reynolds number jets is shown in figure 4, which shows the difference be­tween time-averaged and conditionally-averaged images of round jets at high Reynolds and Mach numbers. We will discuss conditional averaging tech­niques later in more detail.

Turbulence: as a space-time chaos

When Lighthill first provided us with a theoretical foundation from which to model, study and understand jet noise, turbulence, both generally and in the specific case of the round jet, was considered to comprise a space­time chaos, devoid of any underlying order. The standard at that time for the kinematic description of turbulence structure could be found in turbu­lence theories such as that of Batchelor (1953): attempts to understand and model turbulence were based on the Reynolds Averaged Navier-Stokes (RANS) equations, where the only conceptual constructs invoked, aside from those expressed in the conservation equations, are those required for closure (Boussinesq’s notion of eddy viscosity, for instance) on one hand, and, on the other, the flow entities supposed to participate in the physical processes associated with the various terms that appear in the RANS equa­tions: fluctuation energy is ‘produced’, ‘transported’, ‘dissipated’ by virtue of interactions between stochastic flow ‘scales’ or ‘eddies’.

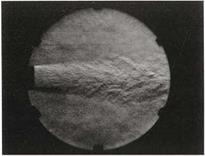
Figure 3(a), which shows a schlieren photograph of a turbulent jet, gives a visual sense of this stochastic character. Source terms in acoustic analogies

Turbulence: as a space-time chaos Turbulence: as a space-time chaos

were constructed in accordance with this conceptual picture of turbulence. Lighthill (1952) assumed a statistical distribution of uncorrelated eddies throughout the source region, and this led to the well known U8 power law for the isothermal turbulent jet. However, predictions based on Lighthill’s analogy, using such kinematic models for the turbulence, do not explain all of the features of subsonic jet noise: at low emission angles (with respect to the downstream jet axis), for example, the U8 power law does not hold, and the narrower spectral shape is generally not well predicted. Something is missing from this combination of acoustic-analogy formulation and source representation.

(a) (b)

Figure 3. Different visualisation techniques of jets at similar Reynolds number, taken from Crow and Champagne (1971). (a) Schlieren photogra­phy; Re = 1.06 x 10⁵; (b) CO2 fog visualisation using sheet illumination; Re = 7.5 x 10⁴.

A systematic approach to modelling

Analysis of aeroacoustic systems is, like that of most of complex fluid systems, largely an exercise in system reduction. We are interested in dis­cerning the essential aspects of the fluid system with regard to the quantity (observable) that interests us (the radiated sound in the present case), our end objective being to come up with a simplified model of the flow (both kinematically and dynamically). And, of course, it is a prerequisite that this simplified model provide as accurate as possible a prediction of the radiated sound field: how best to model the flow turbulence as a sound source. The acoustic analogy can be useful as an aid, but, as we saw in the previous section, used in isolation it is not sufficient.

The information neglected in a simplified model of an aeroacoustic sys­tem can be seen as an error, and the success or failure of that model will be reflected by the degree to which the acoustic analogy considered is sensitive to that error. Note, however, that such errors can arise, or be perceived, in two quite different contexts. The errors might be due to there being incomplete flow information available to us. Or, alternatively, the ‘error’ might be something that we intentionally introduce, through the removal of flow information that we consider non-essential where the sound production problem is concerned. In the latter case, the missing information is some­thing that we are required to consider and choose carefully. An analysis methodology is outlined in this section, concerned with such a considered

removal of non-essential information: we intentionally introduce considered and calculated ‘errors’.

The sensitivity issue has been studied in an ad hoc manner by Samanta et al. (2006) with the former idea in mind: how sensitive are acoustic analogies to unwanted errors? The authors considered a DNS of a two­dimensional mixing layer, which they used in conjunction with a number of acoustic analogy formulations (Lighthill-like and Lilley-like formulations were assessed); the sound fields computed by all analogies showed good agreement with the DNS, consistent with the results of the model problem considered in the previous section. The full solution of the DNS was then artificially modified so as to introduce an error, which we here denote Js(q). This error was produced through a manipulation of the coefficients of the POD modes [11] of the full solution. The sound field was then recomputed, by means of the different acoustic analogies, using the contaminated flow data, and the error in the sound field so computed was assessed in each case.

Different kinds of source error were explored: effects analogous to low – pass filtering, and the reduction of energy in narrow frequency bands, are two examples. In many cases the resultant error in the sound field was found to be similar for all of the acoustic analogies considered. For one par­ticular case, however, where the error corresponds to a division of the first POD mode coefficient by 2 (this amounts to a significant reduction of the low frequency fluctuation energy of the flow), the Lighthill-like formulation showed greater sensitivity than the other formulations.

The problem can be thought about as follows. Consider an acoustic analogy, written in the general form Lp = s(q). The parameter space of the source, s(q), can be expressed in terms of an orthonormal basis, to which there corresponds an inner product; such is the case, for instance, for the POD basis of Samanta et al. (2006). If we now consider the eventual impact of the introduction of a small disturbance (which simulates a modelling error) to the source, Js(q) (as per Samanta et al. (2006)), we are interested in the impact that this will have on the acoustic field, i. e. 5p. The problem comes down to the following situation: if Js(q) || VL then the sound field will be sensitive to small perturbations in the source, Js(q). Js(q) is in this case aligned with the direction of maximum sensitivity of the propagation operator L in the parameter space considered. If, on the other hand, Js(q) T VL, then changes in s(q) will have no impact on the sound field, p. [12]

This way of viewing the aeroacoustic problem means that the modelling

problem can be formulated in the following way: beginning with full flow information q, from a numerical simulation for example, we are required to find the directions (in a suitably chosen parameter space) of the flow solution that can be eliminated without adversely affecting the quality of sound prediction. We must identify the ‘errors’ dq, such that we obtain a simplified flow field, q = q — dq; the source computed from this simplified flow field, s(q), has an associated error, and this error must be such that the component of s(q) aligned with the propagation operator is unaffected.

The following analysis methodology, based on the above reasoning, is intended as a guide for the analysis of complex aeroacoustic systems, from the point of view of source mechanism identification and the design of sim­plified models (from both kinematic and dynamic standpoints).

Analysis methodology

1.Obtain full or partial information associated with the complete flow solution, q (whose dynamic law we know: the Navier-Stokes operator, N(q) = 0); this data could be provided by experimental measurements or from a numerical simulation;

2. Identify and extract, from q, the observable of interest: the radiated sound in our case, q^;

3. Construct an observable-based filter, FqA, which, applied to the full solution removes information not associated with sound production, and thereby provides a reduced-complexity sound-producing flow skele­ton (kinematics), q_p = FqA (q);

4. Analyse qD with a view to postulating a simplified ansatz for the source, s(qD);

5. Using an acoustic analogy, compute q^ = L-1s(qD), and verify that min || q^ — q^||;

6. Determine a reduced-complexity dynamic law, N(<d) = 0, that gov­erns the evolution of qd.

Let us consider step 3 for a moment, as the observable-based filter, FqA, can be defined with varying degrees of rigour. The following are some pos­sible scenarios. (i) In some situations the application of FqA might be quite heuristic, e. g. no more than the simple observation of the flow—we see with relative ease that this structure interacted with that to produce this aspect of the sound field, whence we propose a model. (ii) Alternatively,

VLi and VL2 (where the subscripts 1 and 2 indicate the two analogies) have different directions in the parameter space, one will always be able to find a perturbation that causes one operator to appear less robust than the other.

it could comprise a more sophisticated flow visualisation, or perhaps a se­ries of measurements giving quantitative access to the flow solution, from which a simplified model might be proposed, provided the essential mecha­nisms show themselves clearly in this data. However, in the context of high Reynolds number turbulent flows, it is frequently necessary to approach the design of FqA in a more rigorous, methodological and objective, manner. Two further avenues can be pursued in this regard: (iii) it may be possible, using a purely theoretical deduction, to identify flow (or source) information that can be safely removed (examples are provided in what follows); and, (iv) signal processing tools can be used to decompose the complex system into more easily manageable ‘building blocks’, whose relative importance for sound production can then be tested.

Early analysis in aeroacoustics (1950s-1980s) was largely undertaken in contexts (i) and (iii), due to the limited capabilities of measurement and signal-processing. With the progressive improvement of the two latter dis­ciplines, analysis in contexts (ii) and (iv) has become more common. In what follows we will show how a complete analysis will generally involve a combination of (i)-(iv).

In the following, we provide a short historical sketch (contexts (i) and (iii) are preponderant) outlining how the complexity of the turbulent jet was observed, considered, discerned and finally modelled with respect to both its internal turbulence mechanisms and the associated sound sources.

The modelling challenge

3.1 Introduction

As outlined in the previous section, estimation of the sound radiation from a turbulent flow, using an acoustic analogy, requires the solution of a propagation equation given a corresponding source term. If the source is not known exactly (such exact knowledge implies knowledge of the full Navier Stokes solution) it must be modelled, and the question of how best to construct this model arises.

Regardless of the acoustic analogy used, the source is a function of the flow turbulence, and so the question of source modelling is inseparable from that of turbulence modelling. In this section we consider the turbulent jet, and the link between this and sound sources. The way turbulence is perceived and modelled has changed considerably in the last fifty years, as has, correspondingly, our understanding of the jet as a source of sound. We therefore briefly trace out these evolutions, providing examples of some recent developments where the source modelling question is concerned.

Acoustic analogies of Phillips and Lilley

A difficulty with the Lighthill analogy, for the problem of jet noise, is that the wave equation describes propagation through a medium at rest. While this model is approximately correct outside the region of turbulent flow, it is not so within the turbulent jet. Two subsequent developments, due to Phillips (1960) and Lilley (1974), were aimed at improving this aspect of

the model. Both were motivated by the desire to explicitly describe effects associated with interactions between the sound field and the jet.

Phillips (1960) proposed an alternative rearrangement of the Navier – Stokes equations, leading to:

d 2n d f 2 dn dui duj d f1 дт – d f 1 ds

dt2 дхі V dx-) dxj dxi dx p dxj ) + dt V Cp dt /

where n = log(p). This equation comprises, explicitly, in the wave operator, some effects of the mean velocity (via the material derivative), in addition to the effects of variable speed of sound that can occur due to temperature or Mach number gradients. The right hand side, which again is considered a source term, comprises, as did Lighthill’s source term, terms associated with non-linear momentum fluctuations, viscous stresses and a term due to entropy unsteadiness.

The modification due to Lilley (1974) comes about from recognising that if we linearise Phillips’ equation about some mean flow, and we con­sider the fluctuation to be entirely acoustic, the source contains a term associated with flow-acoustic interaction in the form of refraction of the small-amplitude acoustic disturbances by mean shear. To see this, consider acoustic disturbances propagation in two-dimensional shear-flow with mean velocity profile U(y) • x. Linearising Phillip’s equation about this mean flow, and neglecting thermal and viscous effects, the LHS reduces to

Подпись: (32)1 d2 p d2p c2o dt2 dx2 ’

Acoustic analogies of Phillips and Lilley Подпись: (33)

while the RHS reduces to

When it is possible to verify that the perturbation about the mean flow is indeed an acoustic disturbance, this term describes the refraction of sound by the mean flow, and one can argue that it should appear on the LHS, in the wave operator.

With this in mind, Lilley took the material derivative of Phillips’ equa­tion:

Подпись:dvA d / о dn dvA dvk dvj

2— ——- ( c2 ) = -2—-—-—- + Ф,

dxi dx – V dxi) dxi dx – dx – ’

Acoustic analogies of Phillips and Lilley Acoustic analogies of Phillips and Lilley Подпись: (35) Подпись: 1 &Tij p dxj Acoustic analogies of Phillips and Lilley

where

and we see that by linearising this equation about a base-flow comprising mean shear, we obtain a wave operator that describes acoustic propagation in that shear-flow. It is important to point out however, that a Reynolds decomposition of the velocity field (into U+u), does not correspond to a split into hydrodynamic and acoustic disturbances, and so it is not clear that the linear term so obtained does indeed correspond to a refraction effect in the case of a turbulent jet, where the fluctuation about the time-averaged mean, within the jet, is largely hydrodynamic. This problem of decomposing a flow into acoustic and non-acoustic components lies at the heart of much of the controversy that surrounds acoustic analogy approaches for the description and study of aeroacoustic systems. The most recent attempt to address this difficulty has been proposed by Goldstein (2003) and Goldstein (2005).

2.1 The generalised acoustic analogy

Goldstein (2003, 2005) has shown how the formulations typified by the efforts of Phillips (1960) and Lilley (1974) amount to particular cases in a more general framework. In what follows we provide, firstly, a compact exposition of this generalised formulation, in order to facilitate description and interpretation. We then proceed to give a more complete presentation, following the work of Sinayoko et al. (2011). We end with an overview of a model problem, proposed by these authors, which serves as an instructive illustration of the differences between different acoustic analogy formula­tions.

In a nutshell Consider the Navier-Stokes equations, expressed in the compact form

N (q) = 0, (36)

where q is here a vector containing all of the dependent flow variables, and N represents the Navier-Stokes operator. Goldstein’s generalisation of the acoustic analogy proceeds as follows.

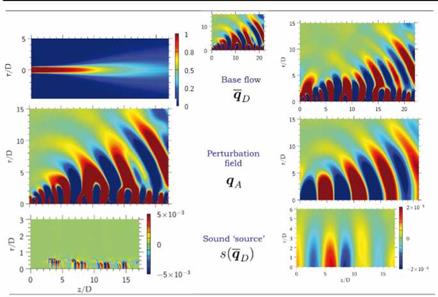
The full solution is first decomposed into a (possibly unsteady) base-flow and a perturbation:

q = qD + qA, (37)

the subscript D indicating non-linear fluid dynamics, as opposed to lin­ear acoustic dynamics, which are denoted by the subscript A. From this
decomposition an equation of the following form can be written

LqD Ыл) = s(qD)> (38)

where CqD is a linear operator describing the evolution of дл> a disturbance generated and carried by qD. Let us consider this equation for a moment, as it has certain uses, but also some limitations.

A first difficulty associated with an equation constructed in this manner is that, if we are to interpret it in terms of a non-acoustic, causal, source, s(qD), that drives an acoustic effect, дл, we need to be sure that the full flow solution has been decomposed into acoustic and non-acoustic, or radiating and non-radiating, components: there is presently no consensus as to how such a decomposition might be unambiguously effected.

A second difficulty becomes apparent when we consider what has been gained by identifying s(qD) in this way. If we consider equation 38 to be physically pertinent—in other words we believe that we have successfully decomposed the flow solution into acoustic and non-acoustic components— at best we can consider the decomposition of equation 37 to provide us with the kinematic structure of the flow, qD, that underpins sound radiation. However, as we will see in the following example, qD is almost identical to q, the full flow solution, as one would expect given the large amplitude disparity between hydrodynamic and acoustic fluctuations at the heart of the flow; and so the question that arises is the following: in what way does the information provided by decomposition 37 and equation 38 enlighten us with regard to the physical flow mechanisms associated with sound produc­tion? The answer appears to be: it constitutes a powerful means by which the radiating flow structure can be visualised and probed. For instance, by superposing s(qD) and qD, and studying, simultaneously, the space-time (or frequency-wavenumber) structure of the two, it may be possible to gain some insight regarding what it was about the flow motions qD that led to the radiating source structure s(qD): this structure (є qD) interacted with that structure (є qD) to produce this or that aspect of the source field (є s(qD)).

However, having clarified the kinematics in this way, it is then necessary to address the question of the dynamics, as the flow motions associated with the generation of sound can only be fully understood in the context of their underlying dynamic law. In the context of high Reynolds number turbulent jets, qD will be no less complex than q, and thus the dynamic law of the source is approximately the Navier-Stokes operator; in which case we arrive at the conclusion that the sound-source mechanism is the turbulence! The point on which we insist is the same evoked in the introduction: while the acoustic analogies can provide simplified models for the propagation
and connection-to-turbulence parts of the problem, they do not directly provide any such simplification where the “fluctuating shearing motions” are concerned. These points will be further discussed in section §3.

Full derivation The following derivation, taken from Sinayoko et al. (2011), shows, in detail, how a generalised acoustic analogy, such as that evoked more compactly above, can be formulated for a homentropic fluid medium. The derivation is followed by the presentation and discussion of a model problem chosen by those authors; the problem considered constitutes a useful illustration of the differences between this and more conventional acoustic analogies; it also serves to illustrate the limitations of acoustic analogies in general.

Acoustic analogies of Phillips and Lilley Подпись: дп d d + dXjnv- Подпись: 0 0. Подпись: (42) (43)

Using a modified pressure variable п = pl/l, the momentum and energy equations can be rewritten as

Note that the pressure equation now appears in conservative form.

For the moment consider that a filter capable of extracting acoustic, or radiating, disturbances, q’, from the full flow variable, q, exists: L = I-L.

Application of this filter to the conservation equations gives:

Подпись:др’ d, w

д + щ {p’> > = 0

д д д

+ dxj >’ + dxn >’ = 0

д (п)’ д.

ow + dx (",J) =0-

The non-linear momentum flux term can be expanded as

pViVj = pViVj + Vj (pvi)’ + Vi(pVj )’ – ViVj p + O(p’2),

where

(PVi) p ‘

O(p’2) terms, being quadratic in the radiating (acoustic variables), are several orders of magnitude smaller than radiating components, and can be neglected. Thus, application of the filter L to the expanded momentum flux term gives

Подпись:(pViVj)’ & (pViVj)’ +(Vj(pVi)’ + Vi(pVj)’ – ViVjp’)’. A B

Term A is the acoustically-matched part of the non-linear momentum flux term, i. e. it comprises only those components of the triple correlation pViVj that present radiation-capable space-time scales, and that can thereby couple with the sound field. The second group of terms, B, corresponds to acoustically-matched components of hydrodynamic-acoustic interaction terms: refraction, scattering, convective transport, etc.

Acoustic analogies of Phillips and Lilley Подпись: (50) (51)

Similarly the modified pressure term, which is also non-linear, can be expanded and filtered:

AB

On account of the homentropic character of the fluid medium, it can be shown (see Sinayoko et al. (2011) for details) that the radiating component
arising due to the non-linearity of the non-radiating pressure term, A, is equal to zero:

Ж)’ = ^(pry f P^Y p)’ = 0. (52)

Р<Ж ПЖ J

Similarly, the energy flux term, (nvj)’, can be decomposed as follows

П П

(nvj)’ – + ( = (pvjУ + v jп – pvjр’)У (53)

A ‘———————- v—————- ‘

B

and the radiating component of the non-linear part shown also to be equal to zero:

(Щ)’ = ^ (pvj)’ = ^ (pvj)’ = 0. (54)

Acoustic analogies of Phillips and Lilley Acoustic analogies of Phillips and Lilley

The filtered Navier Stokes equations can now be re-written, placing all of the non-zero sound source terms, A (which comprise radiating components of non-linear interactions of non-radiating components) on the right hand side, and the flow-acoustic interaction terms, B, on the left:

This is a generalised acoustic analogy, the source and propagator compo­nents of which depend on how the filter, L is defined.

Application to a model problem We here provide a brief exposition of the model problem and main results. For more complete details the reader should refer to Sinayoko et al. (2011).

A Direct Numerical Simulation is performed wherein a laminar, axisym – metric jet is driven at the inflow by two different frequencies. The response of the jet comprises the growth of two hydrodynamic instabilities; these

Acoustic analogies of Phillips and Lilley

Figure 1. Top center: full flow solution; Left and right columns show, from top to bottom: base flow, perturbation and sound source corresponding to the two flow decompositions; left column :q0 + q"; right column: qD + qA.

undergo a non-linear interaction which results in a difference wave, and it is this difference wave that dominates the generation of sound waves. The instability waves each couple directly with the sound field, but this linear mechanism is weaker than that of the non-linear interaction.

The full solution of the model problem is shown in figure 1. The filtering operation used to separate ‘radiating’ and ‘non-radiating’ components of the flow is based on the free-space Green’s function, and in this particular implementation the ‘perturbation’ is defined as the radiating component of the flow at the dominant radiation frequency only. It is for this reason that some radiating components remain in the base flow, qD.

The considerable differences between what is referred to as ‘base flow’, ‘perturbation’ and, consequently, ‘source’ are illustrative of the degree to which different acoustic analogies will yield different interpretational frame­works: the mechanisms that we infer from the equations can differ as widely as the decompositions, base-flows, perturbations and sources with which they are associated. Much contemporary debate regarding the true physics

of sound production is fueled by this lack of universality.

We here draw attention to one importance difference in particular. In the case of the time-averaged base flow (which is what is used in Lilley or Lin­earised Euler formulations), the fluctuation is largely dominated, as stated earlier, by hydrodynamic unsteadiness, whereas the radiating fluctuation obtained by means of an acoustic filter is mainly acoustic. The difference in both amplitude and space-time structure between the two attests to this. As seen in figure 1, when a time-averaged base-flow is considered, the per­turbation within the jet is dominated by hydrodynamic, convective scales. When the radiating/non-radiating decomposition is used, the perturbation shows an acoustic (radiating) scale throughout the jet. A corresponding difference in amplitude between the two perturbations (not shown in the figure, where colour scales are saturated) is also observed. This illustrates the extent to which it is incorrect to think of interactions terms of the kind q0q" as corresponding to mean-flow/acoustic interaction; the correct interpretation is that these terms are dominated by mean-flow/turbulence interactions, as is the interpretation attributed to such terms by students of incompressible turbulence (cf. George et al. (1984)), where such terms are referred to as slow-pressure terms.

Finally, Sinayoko et al. (2011) verify that when the time-averaged base flow is driven by the two source terms, the correct result is obtained in the acoustic field. Figure 2 shows this.

2.2 Conclusion

Two things are worth pointing out with regard to the results of the model problem considered above. The first is the difference between the two source terms; it clearly cannot be correct to refer to both of these as the ‘source of sound’. Furthermore, because in this model problem the flow has been care­fully manipulated so that the fluid dynamics and acoustic mechanisms are clear, we know that the dominant source mechanism comprises a non-linear interaction between two hydrodynamic instabilities; this interaction creates an acoustically-matched difference wave. The source identified by the for­mulation based on the decomposition into a predominantly non-radiating unsteady base-flow and a monochromatic, purely radiating disturbance re­sembles such a difference wave. The source obtained using a time-averaged base flow and corresponding disturbance does not. The former system does therefore appear to constitute a more physically pertinent description of the problem than the latter. The causal reading of the problem, as a one way transmission of fluctuation energy from ‘source’ to ‘sound’, also ap­pears to be more justified by the former formulation. As evoked earlier,

Acoustic analogies of Phillips and Lilley

Figure 2. Result of driving the time-averaged base flow by both sources. Result is compared with the DNS result at the peak acoustic frequency. While the source term constructed from the non-radiating, unsteady base flow elicits a purely acoustic response, the source term associated with the time-averaged base flow causes the mean-flow to respond with both hy­drodynamic and acoustic components. Both give the correct result in the acoustic field.

this improved consistency is also manifest in the response of the base-flow to excitation by the two sources; in the former case the response is purely acoustic, consistent with what has been denoted ‘perturbation’, whereas in the latter case the response is dominated, within the flow, by hydrodynam­ics: we therefore have a case in the latter situation where the cause is part of the effect and vice versa; this is clearly problematic. It should also be noted, however, that in both cases the correct solution is obtained in the sound field. This shows, as has been borne out over the past 10 years or so by means of numerical simulation, that all acoustic analogies are capable of providing a link between turbulence and sound; however, the differences illustrated by the foregoing study shows that we need to be careful with regard to the physical interpretations that we infer from analysis based on

acoustic analogies.

Where the question of the relationship between qD and s(qD) is con­cerned, further visualisation and analysis will always be necessary. The same is true with regard to the question of the dynamic law that underpins qD. These observations constitute useful departure points for the experi­mental approach, and the remainder of these lectures will be concerned with outlining methodologies and tools that can be useful in this regard.