Category Noise Sources in Turbulent Shear Flows

Lighthill’s acoustic analogy

Lighthill’s acoustic analogy is a peculiar kind of object: it amounts to a model representation of the jet-noise problem, but one which is described by an exact fluid dynamics equation (nothing less than the Navier-Stokes equations is stated). This dual quality constitutes both the elegance of, and the crux of the interpretational difficulties associated with, the acoustic analogy formulations in general.

Lighthill sought to rearrange the equations of mass and momentum conservation—taken in their full, non-linear form—such that the wave op­erator would appear. In order to do so, he followed the same basic steps used in the derivation of the wave equation, but without performing the linearisation. Taking the time derivative of the mass conservation equation, the divergence of the momentum conservation equation, and combined the

Lighthill’s acoustic analogy

These inhomogeneous wave equations can be interpreted in terms of a source term (the right hand side) that drives density or pressure fluctuations, as described by the left hand side.

We can now examine integral solutions to Lighthill’s equation, and it is at this point that we make a first connection between radiated sound energy and the flow characteristics of a turbulent jet.

These solutions can be considered on three levels: that of (1) elementary dimensional analysis; (2) time-averaged (second and higher order) statistics; and, (3) space-time analysis. The third of these gives us the most direct insight, in so far as it allows a local (in space and time) grasp of the sound production mechanisms; it is most useful for highly organised flows, and/or for understanding the organised component of high Reynolds number flows (‘coherent structures’). In the second approach, detailed understanding is hampered by time-averaging, and we are obliged to consider the connection between the radiated sound power and the jet flow via the second and higher order statistical moments of the unsteady flow; this kind of approach is most useful for the more random components of the flow unsteadiness. The first of the approaches is the most elementary of the three, where very little physical insight is provided regarding the underlying mechanisms. In section §3 we will revisit these representations when we discuss the role played by coherent structures in the generation of sound.

Lighthill’s acoustic analogy Подпись: (19)

Integral solutions to equations 17 and 18 can be obtained using the Green’s function formalism outlined earlier. Henceforth we will change to tensor notation, we will only consider the equation expressed in terms of p’, and we will consider the simplified source quantity

the term associated with viscous effects t can be neglected for most flows of interest, and the third term on the right hand side of equation 18 is believed

3See Lighthill (1952) for full details.

to correspond to the effect of temperature fluctuations (this is often referred to as the entropy source term). This is probably an oversimplification, as in high Mach number flows there is evidence to suggest that the first and third terms on the right hand side of equation 18 are correlated (cf. Bodony and Lele (2005)). However, as our objective in this lecture is to make as clear as possible, and in as simple a manner as possible, the essential workings of acoustic analogies, we will continue to use this simplified scenario. Once the reasoning has been clearly understood in terms of the simplified source term, it is conceptually straightforward to extend to more complex source terms.

The free-field Green’s function is Go = ^—r, and so solution to

Подпись: p'(x,t) Lighthill’s acoustic analogy Подпись: dVy dT 4nx - y Подпись: (20)

Lighthill’s equation can be written as follows:

From equation 20 we can proceed in two ways: (1) we can do the most basic kind of dimensional analysis, which will lead to the simplest expressions of the relationship between radiated sound power and flow characteristics; or, (2) we can take things from the statistical standpoint. We will here do both.

Подпись: p'(x,t) Lighthill’s acoustic analogy Lighthill’s acoustic analogy Подпись: y,t Подпись: x - У I 5 dVy Co y x - y ' Подпись: (21)

First, however, we introduce two simplifications that are frequently used. The first exploits the reciprocity property of the Green’s function, which means that source and observer can be interchanged. This allows the double divergence in equation 20, which is in terms of the source coordinates y, to be expressed in terms of the observer coordinates, x, at which point it can be taken outside the volume integral:

Now that differentiation is being performed in the observer frame (assumed to be in the farfield), where fluctuations are entirely acoustic, the spatial derivatives are related to temporal derivatives through

Подпись:d xi 1 d

dxi x co dt ’

because we are dealing with a non-dispersive wavefield: if you want to know the spatial gradient of the waveform, rather than walk along the wave and measuring the slope as you go, you can simply stay put, letting the

XiXj d2

4nc2x3 dt2

Lighthill’s acoustic analogy Подпись: y,t Подпись: (23)

wavefield pass you by, at the speed of sound; by then measuring its temporal rate of change, knowing it’s propagation speed and considering that the sound waves are locally plane, you immediately have access to the spatial derivative. The solution can thus be written, because we are in the farfield (Іж — y « |ж|), in the following simplified form:

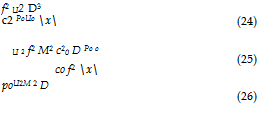
Dimensional analysis Let us consider the problem of the subsonic propul­sive jet, which is the system that Lighthill’s analogy was first used to as­sess. If we consider that a characteristic eddy dimension in the turbulent jet plume is of the order of the jet diameter, D, which corresponds, ap­proximately, to the vorticity thickness of the mixing-layer at the end of the potential core of a subsonic jet[8], a characteristic frequency is f = Uo/D, where Uo is the exit velocity of the jet, and Df/co = Uo/co = M, where M is the Mach number (a measure of compressibility). This means that
Подпись: f2 U2 D3 c2 PoUo x (24) U 2 f2 M2 c20 D Po o co f2 x (25) poU2M 2 D (26) p

I!2

and so the acoustic intensity, I = , should scale as

I =- pU3Ms(x) – U8. (27)

This very simple analysis immediately shows the very strong dependence of the sound power radiated on the velocity and Mach number of a jet. This was the first major result of Lighthill’s theory. In terms of jet noise control, if we are to judge an analysis in terms of the impact it has had on the design of the application, it remains the most significant result to date: it was clear from this analysis that the jet velocity and Mach number would need to be reduced, and that moderate reductions could lead to significant reductions
in sound power. In order to do so, without losing thrust, larger diameter jets would be required: the introduction, and subsequent optimisation of, the (low and high) by-pass jet engine led, between 1950 and 2000, to a 20dB reduction in the sound power radiated by jets exhausts at take-off.

16п2с0х[9] JV n Jv, dt2

d2UiUj ( t _ x – y’

Lighthill’s acoustic analogy Подпись: o

Statistical analysis We now consider the second way in which it is pos­sible to relate radiated sound power to flow/source characteristics. Us­ing equation 23, expressions for the autocorrelation of the farfield pressure (which is related to the power spectrum of the pressure by a Fourier trans­form) can be obtained; this can then be related to the turbulence through the term puiUj. Assuming constant density in the source term (p = po), the autocorrelation function of the farfield pressure fluctuation is given by

^’t-‘^ + Ty^. (28)

And, if the turbulence is considered to be statistically stationary, the equa­tion can be rewritten as

n< ч xixjxkxi [ f d4 / ( , . x – y’ 15

Подпись: У” У

C(x’t) = poйлухрА,,, V, дт-ЛщиАу •t -~^—>

Uk Ui( y” ,t-][X – y 1 + ^ ^dy’ dy". (29)

By virtue of this equation we now have a far more detailed description of how the sound power radiated by a jet flow is related to that flow: for a single observer in the farfield, at x, the sound power, as a function of frequency,[10] is given by a volume integral, over the entire extent of the jet, of the two-point, two-time correlation of the Reynolds stress field.

Instantaneous analysis The two approaches presented above, both of which involve considerable data compression when compared to the full space-time fields from which they begin (and where mechanisms show them­selves most exactly), necessarily hide a certain amount of information.6

Some kind of compression is of course indispensable: the formidable com­plexity of the full space-time structure of turbulence is such that useful assimilation and description is only possible at the expense of some such information loss. However, the ever-increasing capabilities of numerical simulation, experimental data acquisition and data post-processing, mean that new kinds of analysis and modelling methodologies, which deal more directly with the local space-time details of flow mechanisms, can be con­sidered. Such methodologies and tools, which are outline sections §3, §5 and §6, are essential from the point of view of real-time, closed-loop con­trol, towards which fluid dynamics research is headed. It is therefore useful to consider the space-time-local representation of the solution to Lighthill’s equation 20.

Подпись: p(x,t) Подпись: 1 4n Lighthill’s acoustic analogy Подпись: (30)

As outlined above, the physical system described by an inhomogeneous wave equation, such as Lighthill’s, involves a coupling between a source term—which in this sub-section we will simply refer to as q(x, t)—and some base-flow medium that can sustain propagative, wavelike perturbations in accordance with the balance expressed by the wave equation. In the context of Lighthill’s formulation, the mechanism by which a propagative wave is set up, in the quiescent medium, by the source, amounts to the acoustic matching described earlier. In order therefore to have access to what is happening in real time, we need to examine the integral solution in its most primitive form

What this equation tells us is that if we consider the excitation field in a distorted space-time reference frame, q(y, t — c y), the farfield pressure is given by simply summing all the points of that distorted field. If the source field is considered in undistorted space-time, additional time-delays, corresponding to wave-propagation times, weight the summation. Physi­cally, this summation corresponds to the time-delayed constructive and de­structive interference phenomena that underpin, respectively, loud or quiet source activity. We will discuss this in the next section when we consider the antenna-like wavepacket radiation associated with ‘coherent structures’.

Green’s functions

So, what do these wave equations represent? Well, simply stated: they describe propagative wave-like fluctuations of the density or pressure in a

quiescent fluid medium[6]. Such wave-like motion will only be sustained by the medium for space-time scales that satisfy the balance expressed by the equation. A Fourier transform of the wave equation can help illustrate this:

w p = c0k p,

wp’ = Cokp’. (13)

This is known as the dispersion relation for the wave equation, and what it states is that for propagation to be supported in the quiescent, homoge­neous fluid medium considered, the time scales of the motion, w-1, must be matched with the space scales, к-1, by the speed of sound, co. When such a system is excited by a disturbance that does not satisfy this criterion, the associated motions will not be supported as a propagating wave, and will tend, rather, to evanescence (very rapid decay). This concept is central to understanding the mechanisms by which a given source structure [7] gener­ates a propagative energy flux, and these mechanisms can be most clearly seen by looking at integral solutions of the wave equation, which can be obtained by means of an appropriate Green’s function.

The Green’s function, G(x, ty, r), describes the wave-like response (as described by the wave equation) of the quiescent fluid medium to an im­pulse localised at x = y and at time t = т. Where the free-field Green’s function is concerned, a single clap of your hands in a large open space is an approximate equivalent of this. Mathematically, this can be expressed as:

rf-G

-д£Г – c2ag = s(x – y)s(t – т). (14)

Once we have found the Green’s function we are equipped with a filter which, when convolved with a given source, will extract the space-time scales of the source structure that match the balance expressed by the propagation operator (-дрг = c2o Ap’), and which are therefore capable of producing a propagating wave. For example, consider the physical problem described

by ‘

^2 – clAp’ = q(x, t), (15)

where q(x, t) is some (known) source (this could be an unsteady, spatially – distributed force field, or an unsteady, spatially-distributed, addition of
mass), that drives sound waves in a quiescent medium. Multiplying equa­tion 14 by p’, equation 15 by G, integrating in both space and time (ne­glecting the effect of initial conditions), and subtracting the former from the latter, we get, provided there are no solid boundaries, and after a little manipulation

Green’s functions(16)

The right hand side of this equation describes the filtering of q(y, t) by G(x, ty, r): G(x, ty, t) allows us to extract, from the heart of what might be an extremely complex, and largely (acoustically) ineffective, source struc­ture, q(y, T), only those scales that are acoustically-matched.

This is the key to analysing and understanding aeroacoustic systems, experimentally, numerically or theoretically. It is necessary to identify the space-time scales (or flow behaviour that leads to the generation of such scales) that are actually efficient in the generation of sound waves—the vast majority are not. In the context of Lighthill’s acoustic analogy the problem is exactly that described here, insofar as the wave equation used has the same form as 15. For the more sophisticated acoustic analogies, while the wave equations and source descriptions change, conceptually we are dealing with the same scenario: the dispersion-relations and Green’s functions will change, and this will modify the criterion by which we identify the pertinent space-time scales of the ‘source’ quantity (which it is then necessary to relate to the turbulence characteristics of the jet). Further discussion on this point is provided in the next section.

Acknowledgements

I would like to acknowledge Laurent Cordier, Joel Delville, Yves Ger – vais and Bernd Noack, all of whom have contributed to the development of the ideas contained in this document. Anurag Agarwal, Tim Colonius and Jonathan Freund, who continue to stimulate and enrich my general appre­ciation of aeroacoustics, also deserve to be mentioned. Finally, very special thanks are due to Andre Cavalieri and Franck Kerherve, on whose research a good deal of the material contained herein is based.

2 Aeroacoustic theory

In this section we provide a brief presentation of the basic mathematical constructs necessary for an understanding of aeroacoustic theory: the wave equation and its integral solution by means of the free-space Green’s func­tion. This is followed by a detailed exposition of the theory of Lighthill (1952), where its dimensional, statistical and instantaneous representations are used to illustrate some aspects of the relationship between turbulence and sound. The first theoretical evolutions of Lighthill’s theory, due to Phillips (1960) and Lilley (1974), are then evoked, more briefly, followed by a presentation of the most recent theoretical developments, due to Gold­stein (2003) and Goldstein (2005), and which amount to a generalisation of the earlier acoustic analogies. Our exposition of Goldstein’s generalised theory follows the slightly modified formulation proposed by Sinayoko et al. (2011), and we use a model problem computed by these authors in order to illustrate some of the essential aspects of aeroacoustic theory as it pertains to subsonic jets.

e motion of a viscous, compressible, heat-conducting fluid continuum is governed by the equations of mass, momentum and energy conservation, and the equation of state, which are, respectively:

where

Acknowledgements

represents fluid stresses associated with the thermodynamic pressure, p, and the viscous stresses, т; q is the heat flux due to conduction, given by Fourier’s law, q = —KVT; T is the temperature, s is the entropy, and

Taken together, these equations constitute a closed system of differential equations that governs all classes of motion of a fluid continuum. The
mechanisms that underpin the generation of propagative acoustic energy are contained within this system. However, due to the non-linear nature of the equations, general solutions are not available; and, furthermore, in the general case it is not clear how to: (1) classify motions as turbulent, thermal and acoustic—this classification being possible only in certain limited cases, as shown by Chu and Kovasznay (1958); and, (2) identify clear relationships of cause and effect between different regions of a fluid in motion, or between different kinds of fluctuation of that motion (between velocity and pressure for example).

In acoustics, the situation is considerably simplified, as we focus on one particular class of fluid motion: that which is characterised by small am­plitude fluctuations of a potential nature. In this case it is legitimate to linearise the equations of motion, which reduce, in the case of a quiescent fluid medium, and in the absence of external sources of mass or momentum, to

dp’ „ ,

д + PoV’U

= 0

(7)

dU

P.-gt + W

= 0

(8)

ds’

dt

= 0

(9)

p’

= c2oP’.

(10)

Подпись: dy Подпись: Ap' = 0. Подпись: (11)

The velocity perturbation, U, can be eliminated by subtracting the time derivative of the mass conservation equation from the divergence of the momentum conservation equation, giving:

Acknowledgements Подпись: (12)

p’ and/or p’ can then be eliminated, by means of the constitutive equation p’ = c. p’, to give wave equations in either the density or the pressure:

Analysis techniques for aeroacoustics:. noise source identification

P. Jordan

Institut Pprime, UPR-CNRS-3346,
Universite de Poitiers, ENSMA, France

1 Introduction

Aeroacoustic analysis is concerned with the problem of sound source mech­anism identification. Let us consider for a moment what we mean by this, because, depending on the context, the same terminology can be interpreted differently. Two different contexts for the analysis of an aeroacoustic sys­tem, or indeed a fluid flow system in general, are: (1) the kinematic context; and, (2) the dynamic context.

When we are interested in kinematics, we are concerned with description of the space-time structure of a fluid flow, and perhaps with phenomeno­logical explanations vis-a-vis our observation of that structure: this vortical structure interacted with that one to produce this or that result. Such kine­matic descriptions will very often be with regard to some observable; in aeroacoustics that observable is the radiated sound field: this vortical struc­ture interacted with that one to produce this or that property of the sound field.

Aeroacoustic theory was constructed from such a kinematic standpoint. Lighthill (1952) states on the second page of his seminal paper that he wishes to provide “…a general procedure for estimating the intensity of the sound produced in terms of the details of the fluid flow…”. He makes it clear that the search for sound source mechanisms, as he intends it, “is concerned with uncovering the mechanism of conversion of energy between…the kinetic energy of fluctuating shearing motions and the acoustic energy of fluctuating longitudinal motions.”. The “details of the fluid flow”, the “fluctuating shearing motions”, are considered as given.

However, if we are to consider more broadly the problem of source mech­anism identification, we realise that, in order to be able to speak clearly about source mechanisms we need to be able to speak clearly about fluid

R. Camussi (Ed.), Noise Sources in Turbulent Shear Flows: Fundamentals and Applications, CISM International Centre for Mechanical Sciences, DOI 10.1007/978-3-7091-1458-2_4,

© CISM, Udine 2013

dynamics mechanisms, and it is difficult to do so without placing ourselves in the context of dynamics: we would like to be able to explain why this vortical structure interacted with that one to produce this or that property of the sound field; i. e. we wish to discern the dynamic law that underpins the observed interactions, where sound production is concerned. Of course there is one very simple, correct, but not terribly useful, reply to such an inquiry: the Navier-Stokes equations constitute the underlying dynamic law, both of the “fluctuating shearing motions” of the turbulence and the “fluctuating longitudinal motions” of the sound field. But for high Reynolds number turbulence this law, and the space-time flow structure that it engenders, are—from the point of view of perspicacious phenomenological description, flow-state prediction, or design guidance—invariably too complex to be use­ful; we are thus forced to seek simplified models.

Lighthill (1952) provided us with a tool that allows the “fluctuating longitudinal motions” of the sound field to be modelled more simply, and then connected to the “fluctuating shearing motions” of the turbulence; but the same tool does not provide an analogous clarification with regard to how the latter should be modelled. His theory and its descendants are probably best thought of as means by which the connection between the two kinds of motion can be modelled; and by virtue of this connection-model, some insight can be provided regarding the kinematic structure of the underlying flow motions. However, these theories cannot inform with regard to the dynamic law of the “fluctuating shearing motions” that underpin sound radiation.

These lectures are concerned with the exposition of an analysis method­ology which, while it uses aeroacoustic theory as a central tool, attempts to take the problem of source mechanism identification beyond the kine­matic limits imposed by that theory. The methodology, whose objective is source mechanism identification on both kinematic and dynamic levels (implicit is assumption is that the Navier-Stokes dynamics can be mod­elled in a simplified manner, that simplification being specifically tailored with respect to the acoustic observable), is largely an exercise in system re­duction, and relies both on theoretical considerations and signal-processing tools. The document has therefore been organised as follows. In the next section, §2, an overview of aeroacoustic theory is provided; we focus on the earliest (Lighthill (1952)) and most recent theoretical developments (Gold­stein (2003), Goldstein (2005), Sinayoko et al. (2011)). This is followed by a discussion, in section §3, of the source modelling problem, the bulk of the attention being focused on ‘coherent structures’. It is in this section that the analysis methodology evoked above is outlined. Example implementa­tions of the methodology are presented in section §4, where two specific case studies are considered. The various signal processing tools used to support the analysis methodology, and which are implemented in section §4 without detailed explanation, form the basis of section §5. Finally, a brief outline of two reduced-order dynamical modelling approaches is given in section §6.
Nonlinear Propagation

The noise generated by high performance military aircraft engines is so intense that the propagation of the sound to the far field observer is no longer linear. The earliest evidence of nonlinearity in jet noise was provided by the Olympus engines for the Concorde. Ffowcs Williams et al. (1975) observed a phenomenon they called “crackle.” These were intermittent “intense spas­modic short-duration compressive elements of the wave form.” Though these

Nonlinear Propagation

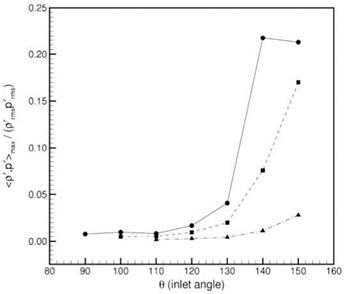
Figure 22. Directivity of normalized (p’,p’)max correlation. Laser probe locations are at r/D = 0, x/D = 12 (Mach 1.8), 10 (Mach 1.4 and Mach 0.95), •, M =1.8; ■, M =1.4; *, M =0.95. (From Tam et al. (2008), with permission).

are not easily characterized by a change in the spectral shape, the skewness increases and the sound is very annoying. Ffowcs Williams et al. (1975) ar­gued that the source of this change in the signal was associated with wave steepening at the source rather than from nonlinear propagation. However, though the character of the time history is set at the source, nonlinear prop­agation occurs and does maintain the skewed and annoying nature of the sound into far field.

Methods to predict the nonlinear propagation of jet noise have used the Burgers equation (see Morfey and Howell (1981), Gee (2005), Saxena et al. (2009) and Lee et al. (2010)) and the one-dimensional Navier-Stokes equa­tions (see Wochner et al. (2005)). Morfey and Howell (1981) introduced a nonlinearity parameter that indicates those regions of the spectrum where nonlinear effects are either increasing or decreasing the intensity. However, their solution was based on a knowledge of the spectrum of the noise in the near field rather than the time history, so the propagation results were not

Nonlinear Propagation

ST

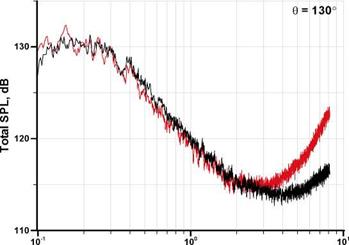
Figure 23. Comparison of spectra from sideline microphones at different locations normalized to a fixed distance; M =1.72, and Tt/Ta =2.7. Gray: 25-ft polar, and black: 15-ft constant sideline. (From Viswanathan (2009)).

satisfactory. The more recent studies make use of the measured time history and then propagate this wave form, using solutions to the Burgers equation, in the same way that sonic boom propagation is calculated. The algorithm used by Gee (2005) is based on the “Anderson algorithm” (see Anderson (1974)). The nonlinear steepening is calculated in the time domain using the “Earnshaw” solution ( Earnshaw (1860)) and the atmospheric absorption effects are calculated in the frequency domain. The calculations by Saxena et al. (2009) and Lee et al. (2010) determine both the nonlinear and atmo­spheric absorption effects in the frequency domain. This has computational and accuracy advantages as shown by Lee et al. (2010). The effects of non­linear propagation are best seen when the experimental data are represented in lossless or standard day form and propagated linearly to a common ob­server location. A good example is shown in Figure 23 from Viswanathan et al. (2009). Here, measurements in a jet with M =1.72 and Tt/Ta =2.7 are shown for a microphone distances of 15 and 25 feet. If linear propagation were present at all frequencies then the curves would fall on top of each other (assuming that the measurements are in the far field). However, it is clear that at high frequencies the curves don’t collapse. This is evidence on the presence of nonlinear propagation. Care should be taken not to as­sume that the spectra shown are “as-measured” spectra. The lift at high frequencies is purely because the data have been made lossless assuming linear propagation. The “as-measured” spectra would still show a roll-off at high frequencies, but it would be less rapid if nonlinear propagation were present.

6 Acknowledgements

These notes are based on a earlier version written by the authors that was intended to be part of a book on high speed jets. We have added some new material and some topics have been removed to prevent excessive length. For example; jet noise reduction, dual-stream jets, and non-circular jets are not discussed. The authors plan to add these topics to a future publication that emphasizes progress in jet noise modeling, prediction and experiments in the last ten years. The original version was reviewed by Prof. Geoffrey M. Lilley who, as always, offered some valuable and insightful criticism.

The Role of Large Scale Structures in Jet Noise

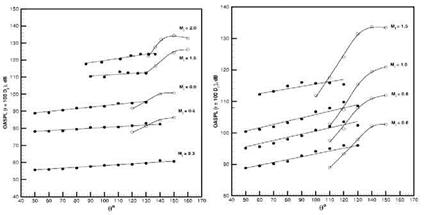
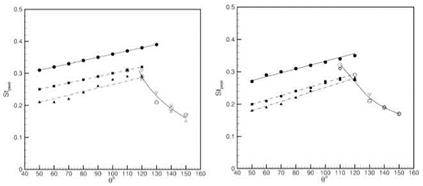
In Section 3.2 the role of large scale turbulent structures and their model­ing as instability waves was discussed. In addition, in Section 3.3 the ability of two similarity spectra to successfully collapse the measured noise spectra at all angles was described. This is only a part of a growing body of exper­imental evidence that there are two noise generation mechanisms – though this remains a very contentious issue. At issue is the role played by the large scale turbulent structures in subsonic or convectively subsonic jets. Excel­lent discussions of recent experimental evidence are given by Tam et al. (2008) and Viswanathan (2009). In particular it is noted that the noise characteristics at small angles to the jet downstream axis, including the peak noise directions, and that at larger angles to the downstream axis are very different. In addition, these differences are observed, whether the flow is subsonic or supersonic. For example, Figure 20 from Tam et al. (2008) shows the variation of the OASPL with inlet angle. The levels are deter­mined by fitting the FSS and LSS spectral shapes to the measured data. So at some angles, for example 120-140 degrees, both spectra are used to match the data. The FSS levels vary very slowly with angle, whereas the LSS lev­els increase rapidly with increase in inlet angle. Note that the effects are similar whether the flow is unheated or heated, except that in the heated case (higher exit velocity) the LSS dominates at more angles. A similar trend is observed in terms of the peak Strouhal number. This is shown in Figure 21 from Tam et al. (2008). The peak Strouhal number for the FSS noise increases slowly with increase in inlet angle, whereas the LSS peak Strouhal number decreases rapidly. Additional evidence of the differences associated with noise radiation in the two regions comes in the form of the correlations between fluctuations of velocity and density in the jet and the radiated pressure. For example, Figure 22 from Tam et al. (2008) shows the directivity of the normalized correlation between density fluctuations in

The Role of Large Scale Structures in Jet Noise

Figure 20. Variation of OASPL with inlet angle. (a) Tt/Ta = 1.0, (b) Tt/Ta =2.2. (From Tam et al. (2008), with permission).

the jet and the far field pressure as a function of jet operating conditions and inlet angle. Again there is a clear demarcation of two regions: one of very low correlation at smaller inlet angles and one of very high correlation at large inlet angles. Tam et al. (2008) argue that the flow measurement, using Rayleigh scattering, is for a very small probe volume. For small or fine scale turbulent blobs, the probe will only sense the contribution from a single blob and so the correlation would be expected to be very low as many blobs would contribute to the total radiated noise. This explains the very low correlations at smaller inlet angles where the fine-scale mechanism dominates. However, though a single point measurement, the flow probe signal would be representative of larger turbulent structures that are coher­ent over a larger volume of the turbulence. The strong correlations at the larger inlet angles are consistent with the noise at these angles being radi­ated by these large scale structures. Also, though the correlation levels do decrease with at lower Mach numbers, there is still a significant correlation in the subsonic case.

As noted in Section 3.2, the large scale structures can be represented by instability waves or wave packets. There have been several recent stud­ies that have used this concept. For example, Reba et al. (2010) devel­oped a wavepacket model and determined the parameters needed to define the wavepacket (amplitude, phase velocity, and growth and decay rates) from microphone measurements on a conical cage array of near field micro-

The Role of Large Scale Structures in Jet Noise

Figure 21. ; Variation of peak Strouhal number with inlet angle. (a) Mj =0.6; •, ▽, TfJTa =1.0, ■, o, TfJTa =1.8, a, Д, TfJTa =2.7. (b) Mj =1.0; •, ▽ , Tt/Ta =1.0, ■, O, Tt/Ta =2.2, a, д, Tt/Ta =3.2. (From Tam et al. (2008), with permission).

phones. They then projected the noise associated with the wavepacket to the far field and compared with measurements. The measurements show good agreement at large inlet angles in the peak noise direction. Mor­ris (2009) examined large-scale mixing noise generation. He used the LSS spectrum to extract only the large-scale mixing noise from measured far field spectra for both subsonic and supersonic jets. From the directivities for different Strouhal numbers he was able to project back to a cylindrical surface around the jet and determine the axial wavenumber spectrum of the pressure fluctuations on the surface. He showed that the shape of the spec­trum for all the jet operating conditions was consistent with that produced by wavepackets. However, only the lowest wavenumbers (the ones that give a sonic phase velocity to a far field observer) were able to radiate in the subsonic cases. This provides further evidence that the noise radiation in the peak noise direction is controlled by the large-scale turbulent structures.

New Acoustic Analogies

As noted in Section 3.1 little success has been achieved with the predic­tion of the noise spectra in the peak radiation direction based on acoustic analogies. Two recent approaches appear to have overcome some these ear­lier problems. Goldstein and Leib (2008) and Karabasov et al. (2010) have extended earlier approaches and achieved some success. However, it should be noted that both studies were limited to convectively subsonic, unheated jets. The work by Goldstein and Leib (2008) builds on the gener­alized acoustic analogy developed by Goldstein (2003). Goldstein and Leib (2008) rearranged the equations of continuity, momentum, and energy for an ideal gas into a system of five formally linear equations. The equivalent sources on the right hand sides of the system of equations have zero time average. The problem is split into two parts: first, find the vector Green’s function for the system of equations, and then model the statistical proper­ties of the noise sources. Goldstein and Leib (2008) stress the importance of accounting for the slow divergence of the jet flow in the Green’s func­tion. They base their statistical model for the sources on their expected symmetry properties as well as experimental measurements. Predictions are presented for unheated jets with Mach numbers 0.5, 0.9 and 1.4 and the comparisons with measurements are very encouraging. Karabasov et al. (2010) take a slightly different approach. They also used the generalized acoustic analogy of Goldstein (2003), but they calculate the vector Green’s function numerically using an adjoint approach (see Tam (1998a)). In addition, they use a companion Large Eddy Simulation (LES) to provide source statistics, including the general shape of the two-point space-time cross correlations as well as the relative amplitude of the different com­ponents. However, they choose to use very simple Gaussian functions to model the correlations. They present results for an unheated jet with Mach number 0.75 and compare with noise measurements. Again, the agreement is quite good. The authors argue that the important effects to be included are; the divergence of the mean flow, the use of non-isotropic source models, the inclusion of the radial variation of the Green’s function, and the use of the same observer location as in the experiments. A careful examination of these two works indicates that different assumptions are made in order to achieve similar agreement with measurements. The two studies do agree on the importance of including the mean flow divergence in the propaga­tion calculation and the need for an anisotropic source model. The other differences have yet to be reconciled.

Intensity and Directivity Prediction

The prediction of the screech tone intensity remains a challenging prob­lem. The phenomenon of mode switching or staging adds an additional layer of complication, which makes the development of a prediction method even more intimidating. Numerical simulations, with detailed specification of the entire upstream geometry, could provide a means for computing the intensity of the screech tone for a particular geometry. Such simulations using computational aeroacoustics methods have been attempted for simple geometries. Shen and Tam (1998) carried out such a simulation for a low supersonic Mach number jet for which the toroidal instability mode is dom­inant. This axisymmetric numerical simulation provided good qualitative details of the screech phenomenon. Features such as mode switching and the principal radiation lobes of the fundamental and second harmonics were reproduced in this study. The predicted screech intensities were close to the values measured on a large reflecting surface placed upstream of the nozzle exit. Shen and Tam (2000) have also examined the effects of jet temper­ature and nozzle-lip thickness on the screech tone intensity. The results of their simulations were in agreement with the experimental observations.

It has been observed that the intensity of the screech tones decreases with increasing jet temperature. The reasons for this observed change in intensity appear to be understood. In the previous section it was shown that, in the weakest link theory, the frequency of screech is determined by the characteristics of the feedback acoustic waves. Tam et al. (1994) exam­ined the role of the other two factors responsible for screech generation; that is, the instability waves and the shock cell structure. They suggested that the characteristics of the instability waves dictated the intensity and occur­rence of screech tones. By carrying out a hydrodynamic stability analysis, they examined the evolution of the instability waves for a variety of Mach numbers and jet temperatures. This study revealed that the axisymmetric or toroidal modes have the highest total amplification at lower supersonic Mach numbers. Above a Mach number of approximately 1.3, the helical or flapping mode becomes dominant. Since the feedback mechanism is driven by the instability waves, which function as the energy source, the observed switching or staging of screech mode from toroidal to flapping at about this Mach number can be attributed to the change in the dominant instability wave mode. Secondly, the Strouhal number of the most amplified instabil­ity wave decreases with increases in jet temperature and jet Mach number. In terms of frequency, even though the jet velocity increases as fTt, the decrease in Strouhal number is greater than 1Д/Т). Hence, the frequency of the most amplified instability wave decreases with increasing tempera­ture. The measured screech frequencies, on the other hand, increase as the jet temperature increases. The implication is that the feedback mechanism is not driven by the most amplified instability waves, thereby leading to a reduction in tone intensity. At elevated temperatures, these tones may not be easily observed above the background noise. Tam et al. (1994) summa­rized that the observed reduction in tone intensity or the non-occurrence of the tone is the direct result of the mismatch between the screech tone frequencies and the band of the most amplified instability waves. As men­tioned earlier, screech tones are not considered to be important in most real engine applications. The non-symmetric geometric features of installed engines and the reduction of screech intensity with increase in temperature, provide an explanation of this observation.

5 Recent Developments

Research in jet noise prediction is an ongoing activity. Significant progress has been made in recent years in the direct simulation of the jet flow and the noise it radiates. An example of such a computation is the work by Shur et al. (2005). These authors used a hybrid RANS/LES method and then propagated the near field solution to the far field using a permeable surface Ffowcs Williams – Hawkings equation solution (see Ffowcs Williams and Hawkings (1969), Brentner and Farassat (1998)). In this section, three additional topics will be covered very briefly: new acoustic analogy predic­tion methods; new views on the role of large-scale structures; and nonlinear propagation.

Jet Screech Tones

Experimental measurements have shown that screech tones are very sen­sitive to upstream conditions, as discussed in Section 2.3. The amplitude of the tone could be altered by as much as 10 dB, just by changing the nozzle lip thickness. It is not surprising then, that the prediction of screech amplitude is very difficult and no method for its prediction existed until recently. Shen and Tam (1998), Shen and Tam (2000), Shen and Tam (2002) have provided the first direct numerical simulations of axisymmetric and three-dimensional screech tones. The simulations use a finite difference

Jet Screech Tones

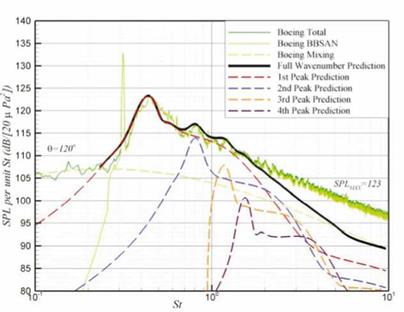
Figure 17. Total BBSAN prediction and the accompanying contributions from selective integrations over contributing wavenumbers of the shock cell structure wavenumber spectrum. Md = 1.0, Mj = 1.5, Tt/Ta = 1.0, R/D = 100, inlet angle = 60°. (From Morris and Miller (2010)).

methodology with optimized algorithms used for both space and time dis­cretizations. The effects of the fine-scale turbulence are included through the use of a к – є model. Comparisons of screech frequency, mode staging, and amplitude are made with experiments. Good agreement is obtained for all these phenomena. However, the calculations are computationally very expensive, even though three-dimensional effects are included in a simplified fashion. Thus, much work remains to be done in this area. On the other hand, several formulas for the prediction of the screech frequency have been developed over the years, based on different theoretical models.

4.1 Prediction of Screech Tone Frequency

The screech tone generation mechanism is very similar to the mechanism of broadband shock noise generation. For the generation of tones, a single excited instability wave is responsible, while for the generation of broadband

Jet Screech Tones

Figure 18. Comparison of BBSAN predictions with experiments for an AR = 1.75 rectangular jet. Md = 1.50, Mj = 1.70, Tt/Ta = 2.20, and R/De = 100, in the minor axis direction. (From Morris and Miller (2010)).

shock noise, a spectrum of instability waves is involved. Tam et al. (1986) examined the relationship between the two shock noise components and provided experimental and theoretical evidence that the two are indeed related. From the shock noise data of Norum and Seiner (1982a), they observed that the fundamental screech frequency was always at a lower value than the peak frequency of broadband shock noise and that the half-width of the broadband shock noise spectrum decreased rapidly as the observer position moved towards the jet inlet. They also showed that only a narrow band of frequencies are radiated in the upstream direction when acoustic waves are generated by the interaction mechanism. Based on their analysis and experimental observations, they suggested that the screech frequency could be regarded as the limiting case of broadband shock noise as the observer angle approaches the nozzle inlet, ф = 0°. The decrease in the spectrum half-width and peak frequency, and the approach of the broadband shock noise spectrum peak frequency to the screech frequency, is evident in

Figure 10.

Tam et al. (1986) also noted that the feedback mechanism was not similar to that for the generation of cavity tones or impingement tones since there was no constraining geometric feature that would set the feedback path length for a shock containing jet and thus set the frequency of the tone. They proposed that the screech frequency is determined by the weakest link of the feedback loop, which is the connection between the outer and inner parts of the loop at the nozzle exit. This connection is responsible for triggering the instability waves. Therefore, sound waves of sufficient strength must reach the nozzle exit in order to excite an instability wave of large enough amplitude, so as to maintain the feedback loop. However, the interaction mechanism generates only a narrow band of frequencies with high intensity that travel in the upstream direction. Hence if the feedback loop is to be self-sustaining, then the fundamental screech frequency must be confined to this upstream propagating narrow band of frequencies. The weakest link hypothesis also explains why a good approximation for the screech frequency is obtained by setting ф = 0 in the equation for the broadband shock noise peak frequency; Eqn. (62).

In order to use the expression for the peak frequency of broadband shock noise and screech, the value of the convection velocity uc and the shock cell wave number kn are required. As in the interaction theory, the source of broadband shock noise would occur near the axial location at which the instability wave attains its maximum amplitude, consistent with the obser­vations of Seiner and Yu (1984). Thus, the phase velocity and shock cell wavenumber must be evaluated at the location where the amplitude of the instability wave is maximum. This axial location can be determined if a locally parallel assumption for the mean flow is used in a stability analy­sis. Tam et al. (1986) describe an iterative procedure for the calculation of the fundamental screech frequency. This methodology requires no empiri­cal inputs and the screech frequencies are calculated from first principles. However, this methodology involves extensive computations. In order to develop a simple formula for the estimation of screech frequencies, they adopted some simplifying assumptions. First, on the basis of experimental observations, the convection velocity was assumed to be 70% of the fully expanded jet velocity Uj. Secondly, the value of the lowest order shock cell wave number, ki was obtained using a vortex sheet model for the shear layer. Additionally, to account for the finite thickness of the jet shear layer, the shock cell spacing near the end of the potential core was estimated to be 20% less than that given by the vortex sheet model. Using values based on these assumptions and the isentropic relationships, Tam et al. (1986) de­veloped the following semi-empirical expression for the fundamental screech

Подпись: fD = 0.67 (M2 -1)-1/2 U j Подпись: 1 + 0.7Mj (1 + 1-і M^ (I )1/2 Подпись: -1 Подпись: (64)

frequency,

Подпись: Dj D Jet Screech Tones

In this expression, Dj is the fully-expanded jet diameter, which, as shown by Tam and Tanna (1982), is related to the nozzle geometric diameter D by,

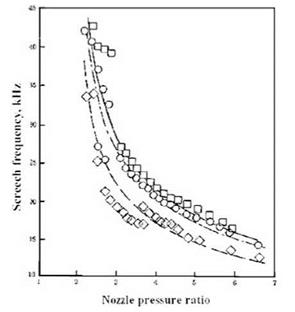
This formula was shown to provide good agreement with measured screech frequencies. Figure 19 from Tam et al. (1986) illustrates that Eqn. 64 pro­vides a good match with data obtained by Rosfjord and Toms (1975) using a convergent nozzle for both cold and heated jets. The agreement is better at higher nozzle pressure ratios. In the development of Eqn. (64), a helical instability wave mode was assumed to be dominant. It is known that for for a convergent nozzle and Mj < 1.3 the toroidal instability mode is dominant. Thus, it is perhaps not surprising that the agreement is not as good at the lower Mach numbers. Tam (1988) extended these concepts to jets of non – axisymmetric cross-sections and developed a formula for the calculation of screech tones from rectangular jets. Again, he demonstrated good agree­ment with measured frequencies. Morris et al. (1989) also used their shock cell model for arbitrary geometry jets to predict the screech frequencies for rectangular jets and obtained good agreement with measurements. Tam (1995a) developed an expression that accounted for the effect of forward flight on the peak frequency of radiation.

Recently, Panda (1998), Panda (1999) carried out detailed experiments on the screech generation mechanism of choked axisymmetric jets. He found a partial interference of the downstream-propagating instability waves and the upstream-propagating acoustic waves along the jet boundary, result­ing in a standing wave pattern. A corresponding length scale, identical to that of the standing wavelength, was also observed in the jet shear layer. The new length scale was found to be approximately 80% of the shock cell spacing. This new length scale correlated the measured screech frequencies well. Interestingly, Tam et al. (1986) selected the same modifications to the shock cell length based on entirely different reasoning (the effects of growth of the jet shear layer on the shock spacing) in the development of the semi-empirical formula, Eqn. (64). However, it should be noted that the complete analysis by Tam et al. (1986), in which the shock cell spacing is determined by a multiple scales analysis, does not involve this assumption.

Jet Screech Tones

Figure 19. Predictions of screech frequency for hot and cold jets from a round convergent nozzle at different nozzle pressure ratios. Measurements

shown by symbols and predictions shown by lines. b,—————– , Tt = 291 K;

O,———— , Tt = 596 K; □,—————- , Tt = 803 K. (From Tam et al. (1986),

with permission)

Broadband Shock-Associated Noise Prediction

A good representation of the large-scale turbulence structures is the next required step in the development of predictions for broadband shock – associated noise. Tam (1987) proposed a formal mathematical theory start­ing from the equations of motion. Tam and Chen (1979), in their study of plane mixing layers, had developed a stochastic model to describe the large-scale turbulence structures. In this approach, the large structures are represented by a superposition of the instability wave modes of the flow, with the amplitudes of the instability waves represented by stochastic ran­dom functions possessing similarity properties. In the initial mixing region of the axisymmetric jet, self-similarity applies and hence the same argument can be invoked. Here, only a general description of the stochastic theory is provided. Complete details are given by Tam (1987) and Tam (1995a).

Tam (1987) decomposed the flow variables into four parts, consisting of the time-averaged mean, perturbations associated with the turbulence structures, perturbations associated with the shock cell structure and the time-dependent disturbances that are generated as a consequence of the in­teractions between the large structures and the quasi-periodic shock struc­tures. These interaction terms, which are responsible for shock noise gen­eration, can be determined from the solution of a boundary value problem. Tam developed expressions for the noise power spectrum, both for the near and far fields. The complete formal solution requires extensive computa­tions, which renders it impractical. So, Tam introduced a similarity source model for the interaction terms and developed a semi-empirical theory with four empirical constants. The values of the empirical constants were chosen by comparison with the measurements of Norum and Seiner (1982a).

Tam (1987) showed good agreement with experiment for both the spec­tral levels and directivity of broadband shock-associated noise for both under – and over-expanded supersonic jets. A sample comparison at several radiation angles was shown in Figure 10. There is good overall agreement, with the predicted peak frequencies at all angles following the measured trend. The calculated spectra also reproduce the reduction in the half­width of the dominant peak, as the observer angle moves towards the jet inlet. Tam also showed good comparisons of the near-field OASPL with experiments. For practical airplane applications, such as the prediction of the impinging shock noise on the fuselage, this capability is very valuable.

Tam (1990) extended his theory for slightly imperfectly expanded jets to moderately imperfectly expanded Mach numbers. Based on the mea­surements of Norum and Seiner (1982a), as shown in Fig. 11, Tam noted that the dependence of broadband shock noise on jet Mach number for un­derexpanded jets is quite different from that for overexpanded jets. The expression for the intensity of shock-associated noise, given by the slightly imperfectly expanded theory, Is rc (Mj – Mj) , is strictly valid only for small deviations of the fully expanded Mach number from the design Mach number. To increase the range of applicability of the theory for a broader Mach number range, for Mach numbers slightly less than that of local max­imum point C to slightly greater than point B in Fig. 11, Tam (1990) made modifications to the stochastic theory. Primarily, this approach involved the proper prescription of the shock cell strength, since the turbulence spectrum and the shock cell wavelength are not affected significantly by the degree of imperfect expansion. He noted that the effect on spectral shape was consequently unimportant and that the degree of imperfect expansion only affected the spectral level. Suitable expressions for the broadband shock – associated noise, for both cold and hot jets, were shown to provide very good agreement with measured spectra for jets operated at strongly off – design conditions.

Tam (1991) included the effects of flight on broadband shock-associated noise, through additional considerations of changes in the noise source as well as the effect of flight on the convection speed of the large scale struc­tures. He argued that due to the thick boundary layer on the nozzle external surface, the shock cell strength would not be modified to a great extent and hence could be approximated by that for the static case: especially for low flight Mach numbers. Further, he assumed that the same similarity source spectrum adopted for the static case, with account taken of the increased shock-cell spacing and increased convection speed for the large-scale struc­tures due to the co-flowing stream, would be valid. He developed modified expressions for the noise power spectrum and peak frequency for the flight case. This formulation provided the correct trends of a reduction in peak frequency, a narrowing of the spectral peak, and the appearance of higher order peaks with increasing flight speed. Tam (1992), through a transfor­mation of the co-ordinate system, developed expressions for the calculation of broadband shock noise as measured by a ground observer in a typical fly­over noise test. This expression contains a term in the form of the familiar Doppler shift, but without a high power of convective amplification factor.

Tam and Reddy (1996) adapted the stochastic noise theory for the prediction of broadband shock noise from rectangular nozzles. The flow and shock cell structure of supersonic rectangular jets is different from those of round jets. As noted out by Tam (1988), for rectangular nozzles with straight sidewalls, two different shock cell systems are set up in the flow. One is the familiar system formed outside the nozzle and the other one originates inside the nozzle, close to the nozzle throat. Because of the second shock cell system, broadband shock noise is generated even at the so-called design Mach number of the nozzle. So, an additional term was added to the expression for the shock cell strength, to account for the second shock cell system. Tam (1988) had already developed a vortex sheet model for the description of the shock cell spacing from elliptic and rectangular jets. This expression was modified empirically to account for the finite thickness of the mixing layer. Furthermore, the convection velocity of the large-scale structures was changed to be 0.55Uj, instead of the typical value of 0.7Uj used for circular jets. With these modifications, good agreement with the measurements of Ponton et al. (1986) was shown for rectangular nozzles with different aspect ratios.

The primary difficulty with the stochastic broadband shock noise the­ory is that it does not provide a connection to the flow. So, calculations for different geometries requires a reformulation of the model parameters. To overcome this difficulty, Morris and Miller (2010) developed a broad­band shock-associated noise (BBSAN) model that uses input from RANS CFD calculations to provide the properties of the shock cell structure and the characteristic scales of the turbulence. The model is formulated as an acoustic analogy based on the linearized Euler equations. The far field pres­sure is determined from a convolution of the equivalent source terms and the vector Green’s function for the linearized Euler equations. In the first version of the model the effects of mean flow refraction were neglected, since BBSAN radiation occurs primarily towards smaller inlet angles or towards the sideline. The evaluation of the spectral density depends on a model for the shock cell structure and the second order two-point velocity correlation of the turbulence. Note that it is the fourth order cross correlation of the velocity that is needed for the source modeling of fine-scale turbulence noise in the traditional acoustic analogy framework. In addition, the shock cell structure is represented by its axial wavenumber spectrum. In this way the model has much in common with Tam (1987).

Calculations were presented by Morris and Miller (2010) for circular and rectangular jets using the same empirical parameters for all cases. Figure 17 shows a prediction for a circular convergent nozzle with Mj = 1.5 and Tt/Ta = 1.0. The observer is at an inlet angle of 60° at R/D = 100. The total BBSAN prediction is shown with the black line and compares well with measurements – especially in the peak BBSAN frequency range. Curves are also shown for the contribution to the total spectrum from the turbulence interaction with different peaks in the shock cell wavenumber spectrum. These interactions give multiple smaller peaks at higher frequencies, which are also seen in the measurements. The same parameters are used to pre­dict the BBSAN for a rectangular jet with aspect ratio 1.75. This is shown in Figure 18. The agreement is very good. Note how the mixing noise overwhelms the BBSAN at small angles to the jet downstream axis in this case. This model has been extended to dual stream jets. In this case, the presence of the outer high speed fan stream does give rise to propaga­tion effects. Miller and Morris (2011) consider dual stream jets operating off-design and include adjoint solutions to the vector Green’s function to account for refraction effects. It should be noted that Tam et al. (2009) has extended his model for the BBSAN peak frequencies for a dual stream jet.