Category Pressure and Temperature Sensitive Paints

Optimization Method

In order to develop a simple and robust method for comprehensive camera calibration, the singularity problem must be dealt with to solve the collinearity equations. Liu et al. (2000) proposed an optimization method based on the following insight. Strong correlation between the interior and exterior orientation parameters leads to the singularity of the normal-equation-matrix in least-squares estimation for a complete set of the camera parameters. Therefore, to eliminate the singularity, least-squares estimation is used for the exterior orientation parameters only, while the interior orientation and lens distortion parameters are calculated separately using an optimization scheme. This optimization method contains two separate, but interacting procedures: resection for the exterior orientation parameters and optimization for the interior orientation and lens distortion parameters.

When the image coordinates (x, y) are given in pixels, we express the collinearity equations Eq. (5.1) as

topology, leading to faster convergence. The topological structure of std( xp )

or std( yp ) can also be affected by random disturbances on the targets. Larger

noise in images leads to a slower convergence rate and produces a larger error in optimization computations. Although the simple ‘valley’ topological structure allows convergence of optimization computation over a considerable range of the initial values, appropriate initial values are still required to obtain a converged solution. The DLT can provide such initial values for the exterior orientation parameters (a>,у, к,Xc, Yc, Zc) and the principal distance c. Combined with the DLT, the optimization method allows rapid and comprehensive automatic camera calibration to obtain a total of 14 camera parameters from a single image without requiring a guess of the initial values.

Optimization Method

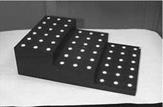
Fig. 5.2. Step target plate for camera calibration

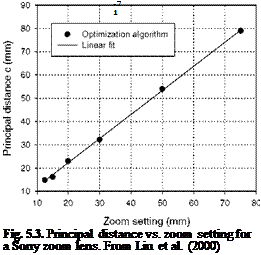
The optimization method was used for calibrating a Hitachi CCD camera with a Sony zoom lens (12.5 to 75 mm focal length) and an 8 mm Cosmicar television. As shown in Fig. 5.2, a three-step target plate with a 2-in step height provided a 3D target field for camera calibration, on which 54 circular retro-reflective targets of a 0.5-in diameter spaced out 2 inches apart are placed. Figure 5.3 shows the principal distance given by the optimization method versus zoom setting for the Sony zoom lens. Figures 5.4 and 5.5 show, respectively, the principal-point location and radial distortion coefficient K as a function of the principal distance for the Sony zoom lens. The results given by the optimization method are in reasonable agreement with measurements for the same lens using optical equipment in laboratory (Burner 1995). The optimization method was also used to calibrate the same Hitachi CCD camera with an 8 mm Cosmicar television lens. Table 5.1 lists the calibration results given by the optimization method compared well with those obtained using optical equipment.

In order to determine accurately the interior orientation parameters, a target field should fill up an image for camera calibration. In large wind tunnels, however, a camera is often located far from a model such that the target field looks small in the image plane. In this case, a two-step approach is suggested that determines the interior and exterior orientation parameters separately. First, placing a target plate near a camera to produce a sufficiently large target field in the image plane, we can determine accurately the interior orientation parameters
Optimization Method

using the optimization method. Next, assuming that the determined interior orientation parameters are fixed for locked camera setting, we obtain the exterior orientation parameters using a resection scheme from the target field in a given wind-tunnel coordinate system.

Fig. 5.4. Principal-point location as a function of the principal distance for a Sony zoom lens connected to a Hitachi camera. From Liu et al. (2000)

Fig. 5.5. The radial distortion coefficient as a function of the principal distance for a Sony zoom lens connected to a Hitachi camera. From Liu et al. (2000)

Table 5.1. Calibration for Hitachi CCD camera with 8 mm Cosmicar TV lens

Interior orientation

c (mm) Xp (mm)

yp (mm)

Sh/Sv

K1 (mm-2)

K2 (mm-4)

P1 (mm-1)

P2 (mm-1)

Optimization

8.133

-0.156

0.2014

0.99238

0.0026

3.3X10⁻⁵

1.8×10⁻⁴

3×10⁻⁵

Optical techniques

8.137

-0.168

0.2010

0.99244

0.0027

4.5×10⁻⁵

1.7X10⁻⁴

7X10⁻⁵

Direct Linear Transformation

The Direct Linear Transformation (DLT), originally proposed by Abdel-Aziz and Karara (1971), can be very useful to determine approximate values of the camera parameters. Rearranging the terms in the collinearity equations leads to the DLT equations

LjX + L2Y + L3Z + L4 — (x+ dx)(L9X + L10Y + LuZ +1) = 0

L5X + L6Y + L7Z + L8 — (y+ dy)(L9X + L10Y + L11Z +1) = 0 ‘ (5’5)

The DLT parameters L1y ■ ■ • L11 are related to the camera exterior and interior orientation parameters (ю, ф,к, ХC, YC, ZC) and (c, x,y ) (McGlone 1989).

Unlike the standard collinearity equations Eq. (5.1), Eq. (5.5) is linear for the DLT parameters when the lens distortion terms dx and dy are neglected. In fact, the DLT is a linear treatment of what is essentially a non-linear problem at the cost of introducing two additional parameters. The matrix form of the linear DLT equations for M targets is BL = C, where L = (L1y L11 )T,

C = (xlyy1y xM, yM )T, and B is the 2Mxll configuration matrix that can be directly obtained from Eq. (5.5). A least-squares solution for L is formally given by L = (BTB) 1BTC without using an initial guess. The camera parameters can be extracted from the DLT parameters from the following expressions

Because of its simplicity, the DLT is widely used in both non-topographic photogrammetry and computer vision. When dx and dy cannot be ignored, however, iterative solution methods are still needed and the DLT loses its simplicity. In general, the DLT can be used to obtain fairly good values of the exterior orientation parameter and the principal distance, although it gives a poor estimate for the principal-point location (xp, yp) (Cattafesta and Moore 1996).

Therefore, the DLT is valuable since it can provide initial approximations for more accurate methods like the optimization method discussed below for comprehensive camera calibration.

Geometric Calibration of Camera

4.1.1. Collinearity Equations

After the results of pressure and temperature are extracted from images of PSP and TSP, it is necessary to map the data onto a surface grid in the 3D object space (or physical space) to make the results more useful for design engineers and researchers. The collinearity equations in photogrammetry provide the perspective relationship between the 3D coordinates in the object space and corresponding 2D coordinates in the image plane (Wong 1980; McGlone 1989; Mikhail et al. 2001; Cooper and Robson 2001; Liu 2002). A key problem in quantitative image-based measurements is camera calibration to determine the camera interior and exterior orientation parameters, and lens distortion parameters in the collinearity equations. Simpler resection methods have often been used in PSP and TSP systems to determine the camera exterior orientation parameters under an assumption that the interior orientation and lens distortion parameters are known (Donovan et al. 1993; Le Sant and Merienne 1995). The standard Direct Linear Transformation (DLT) was also used to obtain the interior orientation parameters in addition to the exterior orientation parameters (Bell and McLachlan 1993, 1996). An optimization method for comprehensive camera calibration was developed by Liu et al. (2000), which can determine the exterior orientation, interior orientation and lens distortion parameters (as well as the pixel aspect ratio of a CCD array) from a single image of a 3D target field. The optimization method, combined with the DLT, allows automatic camera calibration without an initial guess of the orientation parameters; this feature particularly facilitates PSP and TSP measurements in wind tunnels. Besides the DLT, a closed-form resection solution given by Zeng and Wang (1992) is also useful for initial estimation of the exterior orientation parameters of a camera based on three known targets.

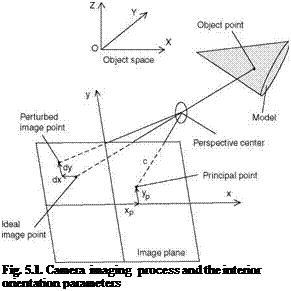
Figure 5.1 illustrates the perspective relationship between the 3D coordinates (X, Y,Z) in the object space and the corresponding 2D coordinates (x, y) in the image plane. The lens of a camera is modeled by a single point known as the perspective center, the location of which in the object space is (Xc, Yc, Zc). Likewise, the orientation of the camera is characterized by three Euler orientation angles. The orientation angles and location of the perspective center are referred to in photogrammetry as the exterior orientation parameters. On the other hand, the relationship between the perspective center and the image coordinate system is defined by the camera interior orientation parameters, namely, the camera principal distance c and the photogrammetric principal-point location (xp, y ).

Подпись: Fig. 5.1. Camera imaging process and the interior orientation parameters

The principal distance, which equals the camera focal length for a camera focused at infinity, is the perpendicular distance from the perspective center to the image plane, whereas the photogrammetric principal-point is where a perpendicular line from the perspective center intersects the image plane. Due to lens distortion, however, perturbation to the imaging process leads to departure from collinearity that can be represented by the shifts dx and dy of the image point from its ‘ideal’ position on the image plane. The shifts dx and dy are modeled and characterized by the lens distortion parameters.

Geometric Calibration of Camera Подпись: - U_ cw

The perspective relationship is described by the collinearity equations

Geometric Calibration of Camera Geometric Calibration of Camera

(5.1)

where mi} (i, j = 1, 2, 3) are the elements of the rotation matrix that are functions of the Euler orientation angles (т, ф,к),

m11 = cos0 cos к

m12 = sin ю sin ф cos к + cos ю sin к m13 = – cos ю sin ф cos к + sin ю sin к m21 = – ^ф sin к

m22 = – sin ю sin ф sin к + cos ю cos к (5.2)

m23 = cos ю sin ф sin к + sin ю cos к

m31 = sin ф

m32 = – sin ю cos ф

m33 = cos ю cos ф.

The orientation angles (ю, ф,к) are essentially the pitch, yaw, and roll angles of a camera in an established coordinate system. The terms dx and dy are the image coordinate shifts induced by lens distortion, which can be modeled by a sum of the radial distortion and decentering distortion (Fraser 1992; Fryer1989)

dx=dxr + dxd and dy=dyr + dyd, (5.3)

where

dxr = K1(x’-xp )r2 + K2(x’-xp )r4, dyr = K,(y’-yp)r2 + K2( y’-yp)r4 ,

dxd = PJr2 + 2( x – xp )2 ] + 2P2( x – xp )(y’ – yp ), (5.4)

dyd = P2[r2 + 2( y’ – yp )2 ] + 2P,( x – xp )(y’ – yp ), r2 = (x’ – xp )2 + (y’ – yp )2.

Here, K1 and K2 are the radial distortion parameters, P1 and P2 are the decentering distortion parameters, and x’ and y’ are the undistorted coordinates in the image plane. When lens distortion is small, the unknown undistorted coordinates can be approximated by the known distorted coordinates, i. e., x’ « x and y’ ~ y. For large lens distortion, an iterative procedure can be employed to determine the appropriate undistorted coordinates to improve the accuracy of estimation. The following iterative relations can be used: (x’ )0 = x and (y’ )0 = y,

(x’ )k+1 = x + dx[( x’ )k,(y’ )k ] and (y’ )k+1 = y + dy[(x’ )k,(y’ )k ] , where the superscripted iteration index is k = 0,1,2 — .

The collinearity equations Eq. (5.1) contain a set of the camera parameters to be determined by camera calibration; the parameter sets (ю, ф,к, Хc, Yc, Zc), (c, xp, yp ), and (K1,K2,P1,P2) in Eq. (5.1) are the exterior orientation, interior

orientation, and lens distortion parameters of a camera, respectively. Analytical camera calibration techniques have been used to solve the collinearity equations with the lens distortion model for the camera exterior and interior parameters (Ruther 1989; Tsai 1987). Since Eq. (5.1) is non-linear, iterative methods of least – squares estimation have been used as a standard technique for the solution of the collinearity equations in photogrammetry (Wong 1980; McGlone 1989). However, direct recovery of the interior orientation parameters is often impeded by inversion of a nearly singular normal-equation-matrix in least-squares estimation. The singularity of the normal-equation-matrix mainly results from strong correlation between the exterior and interior orientation parameters. In order to reduce the correlation between these parameters and enhance the determinability of (c, x,y ), Fraser (1992) suggested the use of multiple camera

stations, varying image scales, different camera roll angles and a well-distributed target field in three dimensions. These schemes for selecting suitable calibration geometry improve the properties of the normal equation matrix. In general, iterative least-squares methods require a good initial guess to obtain a convergent solution. Mathematically, the singularity problem can be treated using the singular value decomposition that produces the best solution in a least-squares sense. Also, the Levenberg-Marquardt method can stay away to some extent from zero pivots (Marquardt 1963).

Nevertheless, multiple-station, multiple-image methods for camera calibration are not easy to use in a wind tunnel environment where only a limited number of windows are available for cameras and the positions of cameras are fixed. Thus, it is highly desirable for PSP and TSP to have a single-image, easy-to-use calibration method devoid of the singularity problem and an initial guess. In the computer vision community, Tsai’s two-step method is particularly popular. Instead of directly solving the standard collinearity equations Eq. (5.1), Tsai (1987) used a radial alignment constraint to obtain a linear least-squares solution for a subset of the calibration parameters, whereas the rest of the parameters including the radial distortion parameter are estimated by an iterative scheme. Tsai’s method is fast, but less accurate than the standard photogrammetric methods. In addition, the radial alignment constraint prevents this method from incorporating a more general model of lens distortion. Here, we first discuss the DLT that can automatically provide initial values of the camera parameters and then describe an optimization method for more comprehensive calibration of a camera.

Image and Data Analysis Techniques

This Chapter describes image and data analysis techniques used in various processing steps for PSP and TSP. For quantitative PSP and TSP measurements, cameras should be geometrically calibrated to establish the accurate relationship between the image plane and the 3D object space and map data in images onto a surface grid in the object space. Analytical camera calibration techniques, especially the Direct Linear Transformation (DLT) and the optimization calibration method, are discussed. Since PSP and TSP are based on radiometric measurements, an ideal camera should have a linear response to the luminescent radiance. For a camera having a non-linear response, radiometric camera calibration is required to determine the radiometric response function of the camera for correcting the image intensity before taking a ratio between the wind-on and wind-off images. A simple but effective technique is described here for radiometric camera calibration. The self-illumination of PSP and TSP may cause a significant error near a conjuncture of surfaces when a strong exchange of the radiative energy occurs between neighboring surfaces. The numerical methods for correcting the self­illumination are generally described and the errors associated with the self­illumination are estimated for a typical case. The self-illumination correction is usually made on a surface grid in the object space since it highly depends on the surface geometry.

A standard procedure in the intensity-based method for PSP and TSP is to take a ratio between the wind-on and wind-off images to eliminate the effects of non-homogenous illumination intensity, dye concentration, and paint thickness. However, since a model deforms due to aerodynamic loads, the wind-on image does not align with the wind-off image. The image registration technique based on a mathematical transformation between the wind-on and wind-off images is described to re-align these images. A crucial step for PSP is to accurately convert the luminescent intensity to pressure; cautious use of the calibration relations with a correction of the temperature effect of PSP is discussed. PSP measurements in low-speed flows are particularly difficult since a very small pressure change has to be sufficiently resolved by PSP. The pressure-correction method is described as an alternative to extrapolate the incompressible pressure coefficient from PSP measurements at suitably higher Mach numbers by removing the compressibility effect. The final processing step for PSP and TSP is to map results in images onto a model surface grid in the object space. When a model has a large deformation produced by aerodynamic loads, a deformed surface grid should be generated for more accurate PSP and TSP mapping. A methodology for generating a deformed wing grid is proposed based on

videogrammetric aeroelastic deformation measurements conducted simultaneously with PSP and TSP measurements.

Basic Data Processing

The most basic processing procedure in the intensity-based method for PSP and TSP is taking a ratio between the wind-on image and the wind-off reference image to correct the effects of non-homogenous illumination, uneven paint thickness and non-uniform luminophore concentration. However, this ratioing procedure is complicated by model deformation induced by aerodynamic loads, which results in misalignment between the wind-on and wind-off images. Therefore, additional correction procedures are required to eliminate (or reduce) the error sources associated with model deformation, the temperature effect of PSP, self­illumination, and camera noises (dark current and fixed pattern noise).

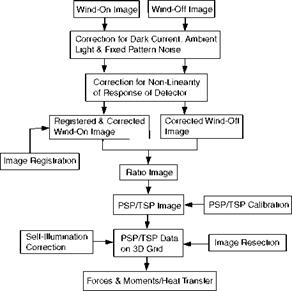
Figure 4.6 shows a generic data processing flowchart for intensity-based measurements of PSP and TSP with a CCD camera. A laser scanning system has similar data processing procedures for intensity-based measurements. The wind – on and wind-off images are acquired using a CCD camera. Usually, a sequence of acquired images is averaged to reduce the random noise like the photon shot noise. The dark current image and ambient lighting image are subtracted from data images to eliminate the dark current noise of the CCD camera and the contribution from the ambient light. The dark current image is usually acquired when the camera shutter is closed. In a wind tunnel environment, there is always weak ambient light that may cause a bias error in data images. The ambient lighting image is acquired when the shutter is open while all controllable light sources are turned off. The integration time for the dark current image and ambient lighting image should be the same as that for data images. The data images are then divided by the flat-field image to correct the fixed pattern noise. At a very high signal level, this correction is necessary since the fixed pattern noise may surpass the photon shot noise. Ideally, the flat-field image is acquired from a uniformly illuminated scene. A simple but less accurate approach is use of several diffuse scattering glasses mounted in the front of the lens of the camera to generate an approximately uniform illumination field. When a uniform illumination field cannot be achieved, a more complex noise-model-based approach can be used to obtain the fixed pattern noise field for a CCD camera (Healey and Kondepudy 1994). Normally, a scientific grade CCD camera has a good linear response of the camera output to the incident irradiance of light. However, conventional CCD video cameras often exhibit a non-linear response to the incident light intensity; in this case, a video camera should be radiometrically calibrated to correct the non-linearity. A simple but useful radiometric camera calibration technique is described in Chapter 5.

Basic Data Processing

Fig. 4.6. Generic data processing flowchart for intensity-based PSP and TSP measurements

In this stage, even though the noise-corrected wind-on and wind-off images are obtained, we cannot yet calculate a ratio of the wind-off image over the wind-on image, Vref/V, for conversion to a pressure or temperature image. This is

because the wind-on image may not align with the wind-off image due to model deformation produced by aerodynamic loads. A ratio between those non-aligned images can lead to a considerable error in calculation of pressure or temperature using a calibration relation. Also, some distinct flow features such as shock, boundary layer transition and flow separation could be smeared. In order to correct the non-alignment problem, the image registration technique should be used to match the wind-on image to the wind-off image (Bell and McLachlan 1993, 1996; Donovan et al. 1993). The image registration technique is based on a mathematical transformation (x’,y’) ^ (x, y), which empirically maps the deformed wind-on image coordinate (X, y’) onto the reference wind-off image coordinate (x, y). For a small deformation, an image registration transformation is well described by polynomials

m m

(x, y) = (^ aijXiy’i, ^). (4.28)

i, j =0 i, j =0

Geometrically, the constant terms, linear terms, non-linear terms in Eq. (4.28) represent translation, rotation and scaling, and higher-order deformation of a model in the image plane, respectively. In measurements of PSP and TSP, black fiducial targets are placed in the locations on a model where deformation is appreciable. The displacement of these marks in the image plane represents perspective projection of real model deformation in the 3D object space. From the corresponding centroids of the targets in the wind-on and wind-off images, the polynomial coefficients a{j and by in Eq. (4.28) can be determined using

least-squares method. More targets will increase the statistical redundancy and improve the precision of least-squares estimation. For most wind tunnel tests, a second-order polynomial transformation (m = 2) is found to be sufficient. As a pure geometric correction method, however, the image registration technique fails to take into account a variation in illumination level on a model due to model movement in a non-homogenous illumination field. An estimate of this error requires the knowledge of the illumination field and the movement of the model relative to the light sources. Bell and McLachlan (1993, 1996) gave an analysis on this error in a simplified circumstance and found that this error was small if the illumination light field was nearly homogenous and model movement was small. Experiments showed that the image registration

technique considerably improved the quality of PSP and TSP images (McLachlan and Bell 1995). Weaver et al. (1999) utilized spatial anomalies (dots formed from aerosol mists in spraying) in a basecoat and calculated a pixel shift vector field of a model using a spatial correlation technique similar to that used in particle image velocimetry (PIV). Based on the shift vector field, the wind-on image was registered. Le Sant et al. (1997) described an automatic scheme for target recognition and image alignment. A detailed discussion on the image registration technique is given in Chapter 5.

After a ratio of the wind-off image over the registered wind-on image is taken, a pressure or temperature image can be obtained using the calibration relation (the Stern-Volmer relation for PSP or the Arrhenius relation for TSP). Compared to relatively straightforward conversion of an intensity ratio image to a temperature image, conversion to a pressure image is more difficult since the intensity ratio image of PSP is a function of not only pressure, but also temperature. The temperature effect of PSP often has a dominant contribution to the total uncertainty of PSP measurements if it is not corrected. When the Stern-Volmer coefficients A(T) and B(T) are determined in a priori laboratory PSP calibration and the temperature field on the surface are known, the pressure field can be, in principle, calculated from a ratio image. The need of temperature correction provoked the development of multiple-luminophore PSP and tandem use of PSP with TSP. The surface temperature distribution can be measured using TSP and infrared (IR) cameras. Also, the temperature field can be given by theoretical and numerical solutions to the motion and energy equations of flows. Unfortunately, experiments have shown that the use of a priori laboratory PSP calibration with a correction for the temperature effect still leads to a systematic error in the derived pressure distribution due to certain uncontrollable factors in wind tunnel environment. To correct this systematic error, pressure tap data at a number of locations are used to correlate the intensity ratio values to the pressure tap data; this procedure is referred to as in-situ calibration of PSP. In the worst case where A(T) and B(T) are not known and the surface temperature field is not given, in-situ calibration is still able to give a pressure field. However, the accuracy of interpretation of PSP data between the pressure taps is not guaranteed especially when the gradients of the pressure and temperature fields between the taps are large. Obviously, the selection of the locations of the pressure taps is critical to assure the accuracy of in-situ calibration. The pressure tap data at the discrete locations for in-situ calibration should reasonably cover the pressure distribution on the surface. The in-situ calibration uncertainty of PSP is discussed in Chapter 7.

PSP and TSP data in images have to be mapped onto a surface grid of a model in the 3D object space since the pressure and temperature fields on the surface grid are more useful for engineers and researchers. Further, this mapping is necessary for extraction of aerodynamic loads and heat transfer and for comparison with CFD results. In the literature of PSP and TSP, this mapping procedure is often called image resection. Note that the meaning of resection in the PSP and TSP literature is somewhat broader and looser than the strict one in photogrammetry. From the standpoint of photogrammetry, a key of this procedure is geometric camera calibration by solving the perspective collinearity equations to determine the camera interior and exterior orientation parameters, and lens distortion parameters. Once these parameters in the collinearity equations relating the 3D object space to the image plane are known, PSP and TSP data in images can be mapped onto a given surface grid in the 3D object space. A detailed discussion on analytical photogrammetric techniques is given in Chapter 5. In most PSP and TSP measurements conducted so far, data in images are mapped onto a rigid CFD or CAD surface grid of a model. However, when a model experiences a significant aeroelastic deformation in wind tunnel tests, mapping onto a rigid grid misrepresents the true pressure and temperature fields. Therefore, a deformed surface grid of a model should be generated for PSP and TSP mapping. Liu et al. (1999) discussed generation of a deformed surface grid based on videogrammetric model deformation measurements conducted along with PSP/TSP measurements (see Chapter 5). Finally, the integrated aerodynamic forces and moments can be calculated from the pressure distribution on the surface. For example, the lift is given by FL = ^ pt(n • lLAS ), where n is the unit normal vector of a panel on the surface, AS is the area of the panel, and lL is the unit vector of the lift. Similarly, the integrated quantities of heat transfer can be obtained from the surface temperature fields based on appropriate heat transfer models.

The self-illumination correction is implemented after the luminescent intensity data are mapped on a surface grid in the 3D object space. The so – called self-illumination is a phenomenon that the luminescent emission from one part of a model surface illuminates another surface, thus increasing the observed luminescent intensity of the receiving surface and producing an additional error in calculation of pressure and temperature. This distorting effect often occurs on the surfaces of neighboring components such as wind/body junctures and concave surfaces. The self-illumination depends on the surface geometry, the luminescent field, and the reflecting properties of a paint layer. Assuming that a paint surface is Lambertian, Ruyten (1997a, 1997b, 2001a) developed an analytical model and a numerical scheme for correcting the self-illumination effect. The self-illumination correction scheme is discussed in Chapter 5.

One of the original purposes of developing two-luminophore PSPs is to simplify the data processing for PSP. The dependency of a two-color intensity ratio ІЯі /1 Яі on pressure p and temperature T is generally expressed as

І я /112 = f(p, T), where 1 я and 1^ are the luminescent intensities at the emission wavelengths Я1 and Я2, respectively. Ideally, a two-color intensity ratio can eliminate the effect of spatially non-uniform illumination on a surface. However, since two luminophores cannot be perfectly mixed, the simple two – color intensity ratio Ія /1^ cannot completely compensate the effect of non­homogenous dye concentration. In this case, a ratio of ratios (І я / І я )/(І я / І я )0 should be used to correct the effects of non-homogenous

dye concentration and paint thickness variation, where the subscript 0 denotes the wind-off condition (McLean 1998). Since the wind-off images are required, the ratio-of-ratios method still needs image registration. The ratio-of-ratios approach was also applied to non-pressure-sensitive reference targets to compensate the effect of non-homogenous illumination on a moving model (Subramanian et al. 2002).

Laser Scanning System

A generic laser scanning system for PSP and TSP is shown in Fig. 1.5. A low- power laser beam is focused to a small point and scanned over a model surface using a computer-controlled mirror to excite the paint on a model. The luminescent emission is detected using a low-noise photodetector (e. g. PMT); the photodetector signal is digitized with a high-resolution A/D converter in a PC and processed to calculate pressure or temperature based on the calibration relation for the paint. When the laser beam is modulated, a lock-in amplifier can be used to reduce the noise. Furthermore, the phase angle between the modulated excitation light and responding luminescence can be obtained using a lock-in amplifier for phase-based PSP and TSP measurements. The laser can be scanned continuously or in steps; it is synchronized to data acquisition such that the position of the laser spot on the model is known. In order to compensate for a laser power drift, the laser power variation is monitored using a photodiode. The laser scanning systems for PSP and TSP measurements were discussed by Hamner et al. (1994), Burns (1995), Torgerson et al (1996), and Torgerson (1997).

Compared to a CCD camera system, a laser scanning system offers certain advantages. Since a low-noise PMT is used to measure the luminescent emission, before an analog output from the PMT is digitized, standard SNR enhancement techniques are available to improve the measurement accuracy. Amplification and band-limited filtering can be used to improve the SNR. The signal is then digitized with a high-resolution A/D converter (12 to 24 bits). Additional noise reduction can be accomplished using a lock-in amplifier when the laser beam is modulated. The laser scanning system is able to provide uniform illumination over a surface by scanning a single laser spot. The laser power is easily monitored and correction for the laser power drift can be made for each measurement point. The laser scanning system can be used for PSP and TSP measurements in a facility where optical access is so limited that a CCD camera system is difficult to use.

CCD Camera System

A CCD camera system is most commonly used for PSP and TSP measurements in wind tunnel tests. Figure 1.4 shows a schematic of a CCD camera system. The luminescent paint (PSP or TSP) is applied to a model surface, which is excited to luminesce by an illumination source such as UV lamp, LED array or laser. The luminescent emission is filtered optically to eliminate the illuminating light before projecting onto a CCD sensor. Images (wind-on and wind-off images) are digitized and transferred to a computer for data processing. In order to correct the dark current in a CCD camera, a dark current image is acquired when no light is incident on the camera. A ratio between the wind-on and wind-off images is taken after the dark current image is subtracted from both images, resulting in a luminescent intensity ratio image. Then, using the calibration relation for the paint, the distribution of the surface pressure or temperature is computed from the intensity ratio image.

Scientific grade cooled CCD digital cameras are ideal imaging sensors for PSP and TSP, which can provide a high intensity resolution (12 to 16 bits) and high spatial resolution (typically 512×512, 1024×1024, up to 2048×2048 pixels). Because a scientific grade CCD camera exhibits a good linear response and a high signal-to-noise ratio (SNR) up to 60 dB, it is particularly suitable to quantitative measurement of the luminescent emission (LaBelle and Garvey 1995). The major disadvantages of a scientific grade CCD camera are its high cost and a very slow frame rate. Less expensive consumer grade CCD video cameras were used in early PSP and TSP measurements (Kavandi et al. 1990; Engler et al. 1991; McLachlan et al. 1992); the intensity resolution of a CCD video camera is typically 8 bits with a conventional frame grabber. When there is a large pressure variation over a model surface, a consumer grade video CCD camera can be used as an alternative to give acceptable quantitative results after the camera is carefully calibrated to correct the non-linearity of the radiometric response function of the camera (see Chapter 5). The low SNR of a video camera can be improved by averaging a sequence of images to reduce the random noise. In addition, film-based camera systems were occasionally used in special PSP measurements like flight tests (Abbitt et al. 1996).

The performance of a CCD array is characterized by the responsivity, charge well capacity and noise. From these quantities, the minimum signal, maximum signal, signal-to-noise ratio and dynamic range can be estimated (Holst 1998; Janesick 1995). These performance parameters are critical for quantitative radiometric measurements of the luminescent emission, which can be estimated based on the camera model and noise models (Holst 1998). Here, the most relevant concepts are briefly discussed. The responsivity, the efficiency of generating electrons by a photon, is determined by the spectral quantum efficiency Rq(h) of a detector. The full-well capacity specifies the number of

photoelectrons that a pixel can hold before charge begins to spill out, thus reducing the response linearity. The maximum signal is proportional to the full – well capacity. Normally, the well size is approximately proportional to the pixel size. Therefore, in a fixed CCD area, increasing the effective pixel size to enhance the SNR may reduce the spatial resolution. The dynamic range, defined as the maximum signal (or the full-well capacity) divided by the rms readout noise (or noise floor), loosely describes the camera’s ability to measure both low and high light levels.

The minimum signal is limited by the camera noises, including the photon shot noise, dark current, reset noise, amplifier noise, quantization noise, and fixed pattern noise. The photon shot noise is associated with the discrete nature of photoelectrons obeying the Poisson statistics in which the variance is equal to the mean. The dark current is due to thermally generated electrons, which can be reduced to a very low level by cooling a CCD device. The reset noise is associated with resetting the sense node capacitor that is temperature-dependent. The amplifier noise contains two components: 1/f noise and white noise; the array manufacturer usually provides this value and calls it the readout noise, noise equivalent electrons, or noise floor. By careful optimization of the camera electronics, the readout noise or noise floor can be reduced to as low as 4-6 electrons. The quantization noise results from the analog-to-digital conversion. The fixed pattern noise (the pixel-to-pixel variation) is due to differences in pixel responsivity, which is called the scene noise, pixel noise, or pixel nonuniformity as well.

CCD Camera System
Although various noise sources exist, for many applications, it is sufficient to consider the photon shot noise, noise floor, and fixed pattern noise due to pixel nonuniformity. Thus, according to the Poisson statistics, the total system noise < Пу > is given by

(4.26)

where < ns2hot > , < n2loor > and < n2pattern > are the variances of the photon shot

noise, noise floor and pattern noise, respectively, npe is the number of collected

photoelectrons, and U is the pixel nonuniformity. Accordingly, the signal-to-noise ratio (SNR) is

Подпись: (4.27)SNR = npe Цnpe +< n2floor > + (Unpe)2

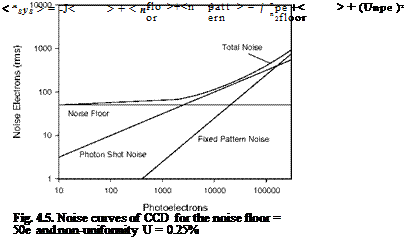
Figure 4.5 shows the total noise, photon shot noise, noise floor (readout noise), and fixed pattern noise of a CCD as a function of the number of photoelectrons for < n2floor >1/2 = 50e and U = 0.25%. For a very low photon flux, the noise floor

dominates. As the incident light flux increases, the photon shot noise dominates. At a very high level of the incident light flux, the noise may be dominated by the fixed pattern noise. When the photon shot noise dominates, the SNR

asymptotically approaches to SNR = ^npe, and the dynamic range is

(npe )max/ < nfloor >, where (npe )max is the full-well capacity. The dark current only affects those applications where the SNR is low. In most applications of PSP
and TSP, the pressure and temperature resolutions are limited by the photon shot noise. Table 4.1, which is adapted from Crites (1993), lists the performance parameters of some CCD sensors.

Table 4.1. Characteristics of CCD Sensors

CCD

TH7883PM

TH7895B

TH896A

TK512CB

TK1024F

TK1024B

Pixel array

384×586

512×512

1024×1024

512×512

1024×1024

1024×1024

Full well (e)

180000

290000

350000

700000

450000

256000

Temperature (oC)

-45

-45

-40

-40

-40

-40

Dark current (e)

8

8

25

4

3

6

Readout Noise (e)

12

6

6

10

9

9

Quantum efficiency

40%

40%

40%

80%

35%

80%

Peak wavelength (nm)

700

670

670

650

670

650

The selection of an appropriate illumination source depends on the absorption spectrum of a luminescent paint and optical access of a specific facility. An illumination source must provide a sufficiently large number of photons in the wavelength band of absorption without saturating the luminescence and causing serious photodegradation. It is desirable for a source to generate a reasonably uniform illumination field over a surface such that the measurement uncertainty associated with model deformation can be reduced. A continuous illumination source should be stable and a flash source should be repeatable. A variety of illumination sources are commercially available. Pulsed and continuous-wave lasers with fiber-optic delivery systems were used in wind tunnel tests (Morris et al. 1993a, 1993b; Crites 1993; Bukov et al. 1992; Volan and Alati. 1991; Engler et al. 1991, 1992; Lyonnet et al. 1997). Lasers have obvious advantages in terms of providing narrow band intense illumination. Very stable blue LED arrays were developed for illuminating paints (Dale et al. 1999). LED arrays are attractive as an illumination source since they are light in weight and they produce little heat; they can be suitably distributed to form a fairly uniform illumination field. In addition, they can be easily controlled to generate either continuous or modulated illumination. Other light sources reported in the literature of PSP and TSP include xenon arc lamps with blue filters (McLachlan et al. 1993a), incandescent tungsten/halogen lamps with blue filters (Morris et al. 1993a; Dowgwillo et al. 1994) and fluorescent UV lamps (Liu et al. 1995a, 1995b). The spectral characteristics of illumination sources can be found in The Photonics Design and Applications Handbook (1999). Crites (1993) discussed some available light sources from a viewpoint of PSP application.

Optical filters are used to separate the luminescent emission from the excitation light, or separate the luminescent emissions from different luminophores. There are two kinds of filters: interference filters and color glass filters. Interference filters select a band of light through a process of constructive and destructive interference. They consist of a substrate onto which chemical layers are vacuum deposited in such a fashion that the transmission of certain wavelengths is

enhanced, while other wavelengths are either reflected or absorbed. Band-pass interference filters only transmit light in a spectral band; the peak wavelength and spectral width can be tightly controlled. Edge interference filters only transmit light above (long pass) or below (short pass) a certain wavelength. Color glass filters are used for applications that do not need precise control over wavelengths and transmission intensities. The ratio of transmission to blocking is a key filter characteristic. All filters are sensitive to the angle of incidence of the incoming light. For interference filters, the peak transmission wavelength decreases as the angle of incidence deviates from the normal, while the bandwidth and transmission characteristics generally remain unchanged. For color glass filters, an increase of the incident angle increases the transmission path, reducing the transmission efficiency.

Intensity-Based Measurement Systems

The photodetector output V responding to the luminescent emission, Eq. (4.22), is re-written as

The parameters Пс and nf are Пс = (n/4)GAl[F2(1 + Mop )2 ]- and Пf = K1K2, which are related to the imaging system (camera) performance and filter parameters, respectively. The quantum yield Ф( p, T) is described by Ф( p, T) = kr /(kr + knr + kqS0O2p), where kr is the radiative rate constant, knr is the radiationless deactivation rate constant, kq is the quenching rate constant, p is air pressure, S is the solubility of oxygen, and фO2 is the volume fraction of

oxygen in air. In PSP applications, the intensity-ratio method is commonly used to eliminate the effects of spatial variations in illumination, paint thickness, and molecule concentration. Without any model deformation, air pressure p is related to a ratio between the wind-off and wind-on outputs by the Stern-Volmer relation

V f p

= A(T) + B(T)^— . (4.25)

V pef

The essential elements of a measurement system for PSP and TSP include illumination sources, optical filters, photodetectors and data acquisition/processing units. In terms of the detectors and illumination sources used, measurement systems can be generally categorized into CCD camera system and laser scanning system with a single-sensor detector. Since each system has advantages over the other, researchers can choose one most suitable to meet the requirements for their specific experiments.

Luminescent Emission and Photodetector Response

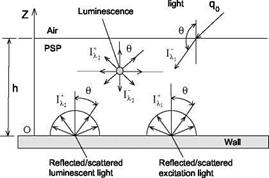
After the luminescent molecules in PSP absorb the energy from the excitation light with a wavelength Лр they emit luminescence with a longer wavelength Л2 due to the Stokes shift. Luminescent radiative transfer in PSP is an absorbing- emitting process; the luminescent light rays from the luminescent molecules radiate in both the inward and outward directions.

For the luminescent emission toward the wall, the luminescent intensity I—

Luminescent Emission and Photodetector Response Подпись: S ,2(z) Подпись: (-1 < И < 0) Подпись: (4.10)

can be described by

where Sx (z) is the luminescent source term and the extinction coefficient Ph = єкc is a product of the molar absorptivity and luminescent molecule

concentration c. The luminescent source term Sx (z) is assumed to be

proportional to the extinction coefficient for the excitation light, the quantum yield, and the net excitation light flux filtered over a spectral range of absorption. Therefore, a model for the luminescent source term is expressed as

Sx 2(z) = Ф( p, T) Ex 2( X 2) £~ (q, 1 )net P, 1FJ X1 )dX, , (4.11)

where Ф( p, T) is the luminescent quantum yield that depends on air pressure (p) and temperature (T), Ex (X2) is the luminescent emission spectrum, and

Подпись: 1 -2 = exp Luminescent Emission and Photodetector Response Luminescent Emission and Photodetector Response Luminescent Emission and Photodetector Response Luminescent Emission and Photodetector Response Luminescent Emission and Photodetector Response Подпись: dz

Ft1( X1) is a filter function describing the optical filter used to insure the excitation light within the absorption spectrum of the luminescent molecules. With the boundary condition I— (z = h) = 0, the solution to Eq. (4.10) is

( -1 < И < 0 ) (4.12)

The incoming luminescent flux toward the wall at the surface (integrated over в = ж to ж/2 and в = ж to 3ж/2 ) is

Г0

q-2(z = 0) = -2 J ^ I-2(z = 0) И dp, (4.13)

where

1 eh Px 2Z

Подпись:— I S x2(z)exp( )dz

p J0 2 p

We consider the luminescent emission in the outward direction and assume that the scattering occurs only at the wall. The outgoing luminescent intensity I + can

be described by

dl+

p~dzr + ^ I+2 = S2(z). (0 < p < 1) (4.14)

Подпись: I +2(z = 0) = Luminescent Emission and Photodetector Response Подпись: r° 2PWP J iI-2(z = 0)pdP, Подпись: (4.15)

Similar to the boundary condition for the scattering excitation light, a fraction of the incoming luminescent flux q-2 (z = 0) is reflected diffusely from the wall. Thus, the boundary condition for Eq. (4.14) is

Подпись: I +, = exP Подпись: P Luminescent Emission and Photodetector Response

where pWp is the reflectivity of the wall-PSP interface for the luminescent light. The solution to Eq. (4.14) with the boundary condition Eq. (4.15) is

(-1 < p < 0) (4.16)

At this stage, the outgoing luminescent intensity I + can be readily calculated by substituting the source term Eq. (4.11) into Eq. (4.16). In general, I+ has a non­linear distribution across the PSP layer, which is composed of the exponentials of Px z and ph z. For simplicity of algebra, we consider an asymptotic but

important case — an optically thin PSP layer.

When the PSP layer is optically thin (px h, PX2h, px z and phz <<1), the

asymptotic expression for I + is simply

I+2(z) = Ф( p, T)qg Ex2(X2 )K 1 (Px/p)(z + 2ррр2 hp), (-1 < p <0) (4.17)

where

Подпись:P-1 J~Px, Ex, a 1 )Cd(1 – p% )(1 + Pwp )FJІ1 ) dXx.

Eq. (4.17) indicates that for an optically thin PSP layer the outgoing luminescent intensity is proportional to the extinction coefficient (a product of the molar absorptivity and luminescent molecule concentration), paint layer thickness, quantum yield of the luminescent molecules, and incident excitation light flux. The term Kj represents the combined effect of the optical filter, excitation light scattering and direction of the incident excitation light. The outgoing luminescent intensity averaged over the layer is

h


Luminescent Emission and Photodetector Response

<I+ >=h-

A 2


where M( p) = 0.5 + 2pyp p. The outgoing luminescent energy flow rate Q+

(radiant flux) on an area element As of the PSP paint surface collected by a detector is

Подпись: Ql, = As> cos в dQ = pXj h0( p, T )q0 EXi (A 2) Kj < M > As Q

(4.19)

where Q+ is equivalent to the spectral radiant flux in radiometry (watt-nm-1), Q is a collecting solid angle of the detector, and the extinction coefficient = ex c is a product of the molar absorptivity sx and luminescent molecule

concentration c. The coefficient < M > represents the effect of reflection and scattering of the luminescent light at the wall, which is defined as

< M > = Q – f M(p )dQ = 0.5 + pwp( + p2),

a 2

where = cos 61 and p2 = cos 62 are the cosines of two polar angles in the solid angle Q.

Imaging system aperture area,

A0=ж D /4


Image of source area

A


Source area

A,


N


R


Luminescent Emission and Photodetector Response

Luminescent Emission and Photodetector Response

Fig. 4.3. Schematic of an imaging system

Luminescent Emission and Photodetector Response Подпись: (4.20)

The response of a photodetector to the luminescent emission can be derived based on a model of an optical system (Holst 1998). Consider an optical system located at a distance R2 from a luminescent source area, as shown in Fig. 4.3. The collecting solid angle with which the lens is seen from the source can be approximated by Q ~ A0/R2, where A0 = ж D2/4 is the imaging system entrance aperture area, and D is the effective diameter of the aperture. Using Eq. (4.19) and additional relations As/R = A,/R2 and 1/R1 + 1/R2 = 1/fl, we obtain the radiative energy flux onto the detector

where F = fl / D is the f-number, M op = R2 / R1 is the optical magnification, fl

is the system’s effective focal length, A, is the image area, and Top and Tatm are

the system’s optical transmittance and atmospheric transmittance, respectively. The output of the detector is

V = G £~ Rq(l2 )(Q,2 )det Ft2( a2 №2 , (4.21)

where Rq(X2) is the detector’s quantum efficiency, G is the system’s gain, and Ft2 (X2) is a filter function describing the optical filter for the luminescent emission. The dimension of V/G is [V/G] = J/s. Substitution of Eq. (4.20) into Eq. (4.21) yields

Подпись: (4.22)A

V = G————- 1———- Д. h0(p, T )q0 K1 K2,

4 F2(1 + Mp)2 11 0 1 2

Подпись: where
K2 = J~ Top Tam Exг(к2 )< M >Rq(X2 )FJX2 )dX2

The term K2 represents the combined effect of the optical filter, luminescent light scattering, and system response to the luminescent light. The above analysis is made based on an assumption that the radiation source is on the optical axis. In general, the off-axis effect is taken into account by multiplying a factor cos4 6p in the right-hand side of Eq. (4.22), where 9p is the angle between the optical axis

and light ray through the optical center (McCluney 1994).

Eq. (4.19) gives the directional dependency of the luminescent radiant flux

Подпись: (4.23)Q + – 1 + 2p’lp [cos(9-А9/2) + cos(9 + A9/2)] ,

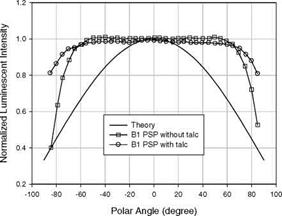
where Лв = в2 – в1 is the difference between two polar angles in the solid angle Q. Clearly, the luminescent radiant flux contains a constant irradiance term and a Lambertian term that is proportional to the cosine of the polar angle в. Le Sant (2001b) measured the directional dependency of the luminescent emission of the OPTROD’s B1 PSP composed of a derived Pyrene dye and a reference component. Figure 4.4 shows the normalized luminescent intensity as a function of the viewing polar angle for the B1 paint and the B1 paint with talc compared

with the theoretical distribution Eq. (4.23) with pJ = 0.5 and Лв = 4 degrees.

The experimental directional dependency remains nearly constant for both paints until the viewing polar angle is larger than 60o. The theoretical distribution for a non-scattering paint fails to predict the flatness of the experimental directional distributions of the luminescent emission. This is because the simplified theoreti­cal analysis does not consider scattering particles (e. g. talc and solid reference component particles) re-directing and re-distributing both the excitation light and luminescent light inside the paints. A more complete analysis of the radiative energy transport in a luminescent paint with scattering particles requires a numerical solution of an integro-differential equation (Modest 1993).

Luminescent Emission and Photodetector Response

Fig. 4.4. Directional dependency of the luminescent emission from the B1 paint and B1 paint with talc, compared with the theoretical directional distribution for a non-scattering paint. Experimental data for the B1 paints are from Le Sant (2001b)

Excitation Light

Подпись: И Подпись: dz Excitation Light Подпись: (4.1)

We consider a PSP layer with a thickness h on a wall, as shown in Fig. 4.2. Suppose that PSP is not a scattering medium and scattering exists only at the wall surface. When an incident excitation light beam with a wavelength Я2 enters the layer, without scattering and other sources for the excitation energy, the incident light is attenuated due to absorption through the PSP medium. In plane geometry where the luminescent intensity (radiance) is independent of the azimuthal angle, the intensity of the incident excitation light with Я can be described by

where Ix is the incident excitation light intensity, i = cos в is the cosine of the polar angle в, and px is the extinction coefficient of the PSP medium for the

incident excitation light with Л1. The extinction coefficient PXi = єх c is a

product of the molar absorptivity sx and luminescent molecule concentration c.

Again, note that the spectral intensity is defined as radiative energy transferred per unit time, solid angle, spectral variable and area normal to the ray (units: watt-m-2- sr-1-nm-1). The superscript ‘-‘ in I – indicates the negative direction in which the light enters the layer. The incident angle в ranges from ж/2 to 3 ж /2 (-1 < fi < 0) (see Fig. 4.2).

Incident excitation

Excitation Light

Fig. 4.2. Radiative energy transports in a luminescent paint layer

For the collimated excitation light, the boundary value for Eq. (4.1) is the component penetrating into the PSP layer,

I–i (z = h) = (1 – Pa/p )qo Exі (Xі)S(i – iex), (4.2)

where q0 and Ex (X1) are the radiative flux and spectrum of the incident

excitation light, respectively, pf is the reflectivity of the air-PSP interface, pex is

the cosine of the incident angle of the excitation light, and S(p) is the Dirac-delta function. The solution to Eq. (4.1) is

I-1 =(1 – p71)qoEh(Xi)8(i-iex)exp[(i)(h-z)]. (-1 <i<0) (4.3)

This relation describes a decay of the incident excitation light intensity through the layer. The incident excitation light flux at the wall integrated over the ranges of в from either ж to ж/2 or ж to 3 ж /2 is

С 0

Подпись: (4.4)q~xjz = 0) = – J 11-I(z = 0) ц dn = Cd (1 – pfp )qo Eh(X 2),

where Cd is the coefficient representing the directional effect of the excitation light, that is,

Cd = – Цех exP( p, h/Цех) . (-1 < Цех < 0) (4.5)

When the incident excitation light impinges on the wall, the light reflects and re-enters into the layer. Without a scattering source inside PSP, the intensity of the reflected and scattered light from the wall is described by

dl+

Ц-Z – + Pk1!: = 0 , (4.6)

Подпись: 1 IJz = 0) = p Подпись: qUz = 0) = Cd p'WP (1 - РТ)%Е X a 1), Подпись: (4.7)

where 1 + is the excitation light intensity in the positive direction emanating from the wall. As shown in Fig. 4.2, the range of u is 0 < ц < 1 (0 < в < n/2 and – n /2 < в < 0) for the outgoing reflected and scattered excitation light. The superscript ‘+’ indicates the outgoing direction from the wall. For the wall that reflects diffusely, the boundary condition for Eq. (4.6) is

where p’WPi is the reflectivity of the wall-PSP interface for the excitation light. The solution to Eq. (4.6) is

Cd P7p(1 – p? I)q0EXiai)exp(-pjLiz/ri. (0 <ju< 1) (4.8)

At a point inside the PSP layer, the net excitation light flux is contributed by the incident and scattering light rays from all the possible directions. The net flux is calculated by adding the incident flux (integrated over в = ж to ж/2 and в = ж to 3ж/2 ) and scattering flux (integrated over в = 0 to ж/2 and

в = 0 to – ж/2). Hence, the net excitation light flux is

p 0 p 0

Подпись: (4.9)(q>. 1 )net =- 2 J i 1 – ц Лц – 2 1 + цФ

= Cd(1 – pfp )q0 E, 1 (11)[ exp (-fix 1 z/цех) + PWP exp (-3fixt z/2)].

Note that the derivation of Eq. (4.9) uses an approximation of the exponential integral of third order, E3(x) = (1/2)exp(-3x/2).