Category Pressure and Temperature Sensitive Paints

Errors Induced by Model Deformation

Model deformation generated by aerodynamic loads causes a displacement Ax = x’ – x of the wind-on image relative to the wind-off image. This

displacement leads to the deviations of the quantities Dx(Ax), h/href, c/cref,

and q0/q0ref in Eq. (7.2) from unity because the distributions of the luminescent

intensity, paint thickness, dye concentration and illumination level are not spatially homogeneous on a surface. After the image registration technique is applied to re-align the wind-on and wind-off images, the estimated variances of these quantities are var[Dx(Ax)] ~ W(V )/V2, var(h/href ) ~ W(h)/(href )2,

and var(c/cref ) ~ W(c)/(cf )2. The operator W(•) is defined as

W( •) = (д /д x)2 a 2x + (д/д y)2 a2, where ax and ay are the standard deviations of least-squares estimation for image registration.

The uncertainty in q0(X)/q0ref(X’) is caused by a change in the illumination

intensity on a model surface after the model moves with respect to the light sources. When a point on the model surface travels along the displacement vector AX = X’ – X in the object space, the variance of q0/q0ref is estimated by

var[q0(X )/q0ref(X’)] »(q0ref )~21(Xq0)• (AX )|2. Consider a point light source with unit strength that has a light flux distribution q0(X-Xs) = | X-Xs, where n is an exponent (normally n = 2) and | X – Xs | is the distance between the point X on the model surface and the light source location Xs. Thus, the variance of q0/q0ref for a single point light source is var[q0(X )/q0ref(X’)]

= n2 X – Xs I 41( X – Xs) • (AX )|2. The variance for multiple point light

sources can be obtained based on the principle of superposition. In addition, model deformation leads to a small change in the distance between the model surface and the camera lens. The uncertainty in the camera performance parameters due to this change is var(nc/ncref ) ~ [R2/(Rj + R2)]2(AR1/R1)2,

where R1 is the distance between the lens and model surface and R2 is the distance between the lens and sensor. For R1 >> R2, this error is very small.

Photodetector Noise and Limiting Pressure Resolution

The uncertainties in the outputs V and Vref from a photodetector (e. g. camera)

are contributed from a number of noise sources in the detector such as the photon shot noise, dark current shot noise, amplifier noise, quantization noise, and pattern
noise. When the dark current and pattern noise are subtracted and the noise floor is negligible, the detector is photon-shot-noise-limited. In this case, the signal-to – noise ratio (SNR) of the detector is SNR = (V/GhvBd )12, where h is the

Planck’s constant, v is the frequency, Bd is the electrical bandwidth of the detection electronics, G is the system’s gain, and V is the detector output. The uncertainties in the outputs are expressed by the variances var(V) = VGhv Bd and var(Vref ) = Vref GhvBd. In the photon-shot-noise-limited case in which the error

Photodetector Noise and Limiting Pressure Resolution Photodetector Noise and Limiting Pressure Resolution Подпись: (7.4)

propagation equation contains only two terms related to V and Vref, the pressure

which holds for both CCD cameras and non-imaging detectors.

Photodetector Noise and Limiting Pressure Resolution

For a CCD camera, the first factor in the right-hand side of Eq. (7.4) can be simply expressed by the total number of photoelectrons collected over the integration time (^ 1/ Bd ), npe = V /(G h vBd ). When the full-well capacity of

where (nperef )max is the full-well capacity of the camera in reference conditions.

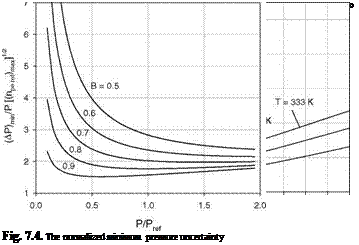
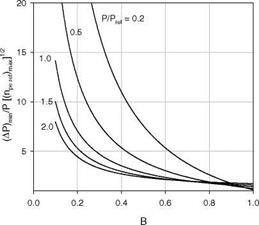
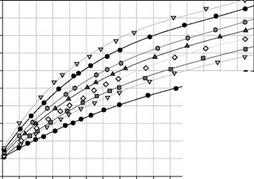
When N images are averaged, the limiting pressure difference (7.5) is further reduced by a factor N1/2. Eq. (7.5) provides an estimate for the noise-equivalent pressure resolution for a CCD camera. When (nperef )max is 500,000 electrons for a CCD camera and Bath Ruth + silica-gel in GE RTV 118 is used, the minimum pressure uncertainty (Ap)min / p is shown in Fig. 7.3 as a function of p/pref for different temperatures, indicating that an increased temperature degrades the limiting pressure resolution. Figure 7.4 shows ^(nperef )max (Ap)min / p as a function of p/pref for different values of the Stern-Volmer coefficient B(T). Clearly, a larger B(T) leads to a smaller limiting pressure uncertainty (Ap)min / p. Figure 7.5 shows <J(nperef )max( Ap)min / p as a function of the Stern-Volmer

coefficient B(T) for different values of p/pref. There is no optimal value of B in this case.

Photodetector Noise and Limiting Pressure Resolution

Fig. 7.3. The minimum pressure uncertainty (Ap)minf p as a function of p/pref at different temperatures for Bath Ruth + silica-gel in GE RTV 118. From Liu et al. (2001a)

function of p/pref for different values of the Stern-Volmer coefficient B(T) . From Liu et al. (2001a)

Photodetector Noise and Limiting Pressure Resolution

Fig. 7.5. The normalized minimum pressure uncertainty (nperef )max( dp)mn / p as a

function of the Stern-Volmer coefficient B for different values of p/pref. From Liu et al. (2001a)

Error Propagation, Sensitivity and Total Uncertainty

According to the general uncertainty analysis formalism (Ronen 1988; Bevington and Robinson 1992), the total uncertainty of pressure p is described by the error propagation equation

Error Propagation, Sensitivity and Total Uncertainty
Подпись: var(p)
Подпись: (7.3)

where ptj = cov(CiCj)/[var( Ct)var( Ci)]1/2 is the correlation coefficient between the variables Ct and Ci, var(Ct) = < ACt2 > and

cov(Ci C j) = < ACi AC j > are the variance and covariance, respectively, and the notation < > denotes the statistical ensemble average. Here, the variables (Cj, i = 1–M} denote a set of the parameters Dt(At), Dx(Ax), Dq0(At), V,

Vref, nc/ncref, Пf/nfref, h/href> c/cref, q0/q0ref, pref, T, A and B in Eq.

(7.2) . The sensitivity coefficients St are defined as St = ( C/p )( dp/dCt ). Eq.

(7.3) becomes particularly simple when the cross-correlation coefficients between the variables vanish (ptj = 0, i Ф j).

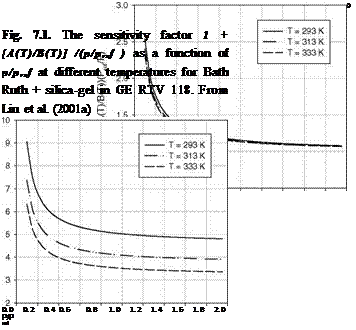
Table 7.1 lists the sensitivity coefficients, the elemental errors and their physical origins. Many sensitivity coefficients are proportional to a factor (p = 1 + [A(T)/B(T)] /(p/pref ). For Bath Ruth + silica-gel in GE RTV 118,

Figure 7.1 shows the factor 1 + [A(T)/B(T)]/(p/pref ) as a function of p/pref for different temperatures, which is only slightly changed by temperature. The temperature sensitivity coefficient is ST = – T[B’ (T) + A'(T) pref/p]/B(T ), where the prime denotes differentiation respect with temperature. Figure 7.2 shows the absolute value of ST as a function of p/pref at different temperatures.

After the elemental errors in Table 7.1 are evaluated, the total uncertainty in pressure can be readily calculated using Eq. (7.3). The major elemental error sources are discussed below.

Table 7.1. Sensitivity coefficients, elemental errors,

and total uncertainty of PSP

Variable

Sensi.

Elemental Variance

Physical Origin

£

Coef.

s

var( C t)

1

Dt(At)

f

[(dV/ dt)( At)/V]2

Temporal variation in luminescence due to photodegradation and surface contamination

2

DJAx )

(p

[ (dV/dx)2 a2 + (dV/д y )2 a 2y]V ~2

Image registration errors for correcting luminescence variation due to model motion

3

Dq0(At)

(p

[( дqo / д t)( At)/qoref]2

Temporal variation in illumination

4

Vef

(p

Vref ghv Bd

Photodetector noise

5

V

– <p

VGhv Bd

Photodetector noise

6

n cmCf

<p

[Ry/(Ri + Ry )]y(ARi/Ri )y

Change in camera performance parameters due to model motion

7

П f/П fref

(p

var(nf/Пfref )

Illumination spectral variability and filter spectral leakage

8

h/href

(p

[ (h/дx)y aX + (h/дy)2 ay ] h-f

Image registration errors for correcting thickness variation due to model motion

9

c/cref

(p

[(дє/dxf aX + (де/дy) aj ] c~ry

Image registration errors for correcting concentration variation due to model motion

10

q 0 /q 0 ref

(p

(qorffy( Vqo) •( AX )f

Illumination variation on model surface due to model motion

11

Pref

1

var( p)

Error in measurement of reference pressure

12

T

st

var( T)

Temperature effect of PSP

13

A

1 – (p

var( A)

Paint calibration error

14

B

-1

var( B)

Paint calibration error

15

Pressure

mapping

1

(д p/дх) ay + (p/ду )y a X

Errors in camera calibration and pressure mapping on a surface of a

and |( V pLf •(AX if

presumed rigid body

Total Uncertainty in Pressure var(p)/ p2

= £ Siyvar( Ct)/ CІ

i = 1

Note:

(1) <7x and <ry are the standard deviations of least-squares estimation in the image registration or camera calibration.

(2) The factors for the sensitivity coefficient are defined as <p = 1 + [ A(T)/B(T)](pref / p) and St = -[T/B(T)][B'(T) + A'(T)(p„f/p)] .

Error Propagation, Sensitivity and Total Uncertainty

Fig. 7.2. The temperature sensitivity coefficient as a function of p/pref at different temperatures for Bath Ruth + silica-gel in GE RTV 118. From Liu et al. (2001a)

Uncertainty

7.1. Pressure Uncertainty of Intensity-Based Methods

7.1.1. System Modeling

Uncertainty analysis is highly desirable in order to establish PSP as a quantitative measurement technique. Based on the Stern-Volmer equation, Sajben (1993) investigated error sources contributing to the uncertainty of PSP, and found that the uncertainty strongly depended on flow conditions and the surface temperature significantly affected the final measurement results. Oglesby et al. (1995a) presented an analysis of an intrinsic limit of the Stern-Volmer relation to the achievable sensitivity and accuracy. Mendoza (1997a, 1997b) studied CCD camera noise and its effect on PSP measurements and suggested the limiting Mach number for quantitative PSP measurements. From a standpoint of system modeling, Liu et al. (2001a) gave a general and comprehensive uncertainty analysis for PSP.

The following uncertainty analysis focuses on the intensity-ratio method widely used in PSP measurements. From Eq. (4.24), air pressure p can be generally expressed in terms of the system’s outputs and other variables

Подпись: p = U The factor Uj in Eq. (7.1) is Подпись: (7.1)Vref(t, x) pref A(T)pref

V(t’, x’) B(T) B(T)

nc Пf h(x’) c(x’) q0( t’,X’)

Пcref ^f ref href ( x ) cref ( x ) q0ref(t, X )

where x = (x, y)T and x’ = (x’,y’ )T are the coordinates in the wind-off and wind – on images, respectively, X = (X, Y,Z)T and X’ = (X’,Y’,Z’ )T are the object space coordinates in the wind-off and wind-on cases, respectively, and t and t’ are the instants at which the wind-off and wind-on images are taken, respectively. Here, the paint thickness h and dye concentration c are expressed as a function of the image coordinate x rather than the object space coordinate X since the image

registration error is more easily treated in the image plane. In fact, x and X are related through the perspective transformation (the collinearity equations).

In order to separate complicated coupling between the temporal and spatial variations of these variables, some terms in Eq. (7.1) can be further decomposed when a small model deformation and a short time interval are considered. The wind-on image coordinates can be expressed as a superposition of the wind-off image coordinates and an image displacement vector Ax, i. e., x’ = x + Ax. Similarly, the temporal decomposition is t’ = t + At, where At is a time interval between the instants at which the wind-off and wind-on images are taken. If Ax and At are small, a ratio between the wind-off and wind-on images can be separated into two factors, Vref( t, x )/V( t’, x’) ~ Dt(At )Dx(Ax )Vref( t, x )/V( t, x),

where the factors Dt( At) = 1 – (dV / d t)(At)/V and

Dx(Ax) = 1 – (VV) • (Ax)/V represent the effects of the temporal and spatial changes of the luminescent intensity, respectively. The temporal change of the luminescent intensity is mainly caused by photodegradation and sedimentation of dusts and oil droplets on a surface. The spatial intensity change is due to model deformation generated by aerodynamic loads. In the same fashion, the excitation light flux can be decomposed into q0(t’,X’ )/q0ref(t, X) ~

Dq0(At )q0(t, X’ )/q0ref(t, X), where the factor

Dq0(dt) = 1 + (dq0/dt)(At)/q0ref represents the temporal variation in the excitation light flux.

Uncertainty Подпись: (7.2)

The use of the above estimates yields the generalized Stern-Volmer relation

Подпись: U2 Uncertainty

where

Without any model motion ( x’ = x and X’ = X ) and temporal illumination fluctuation, the factor U2 is unity and then Eq. (7.2) recovers the generic Stern – Volmer relation. Eq. (7.2) is a general relation that includes the effects of model deformation, spectral variability, and temporal variations in both illumination and luminescence, which allows a more complete uncertainty analysis and a clearer understanding of how these variables contribute the total uncertainty in PSP measurements.

Lifetime Experiments

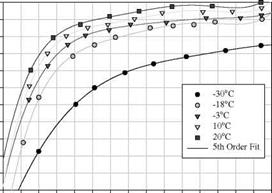
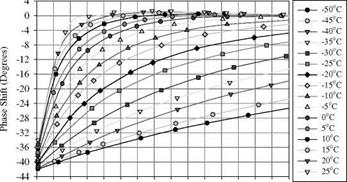
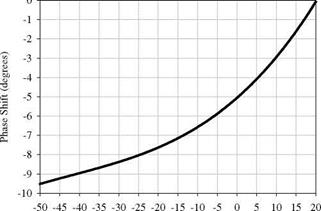
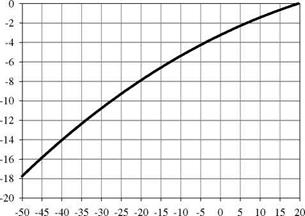
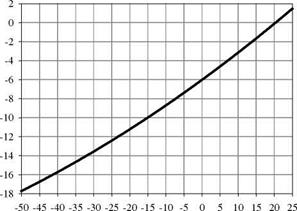
Lachendro (2000) used a set-up shown in Fig. A2 in Appendix A for phase calibration of PSP and TSP formulations at temperatures lower than -30°C, which was capable of holding pressures down to 0.03 psi. In order to make phase calibrations, LED arrays were used as a modulated excitation source; a blue LED array was used for Ruthenium-based complexes and a green LED array for Porphyrin-based luminophores. Each array consisted of seven LEDs arranged in a hexagonal formation for more uniform illumination. The light from an LED array was passed through an appropriate interference filter to eliminate unwanted emission. A function generator was used to directly power and modulate the arrays; the TTL signal from the function generator was used as an external reference for a lock-in amplifier. After passing through a focusing lens, the luminescent response of PSP (or TSP) was detected using a PMT fitted with an interference filter centered at 620 nm and then was sampled by the lock-in amplifier. A PC was used to acquire calibration data from the lock-in amplifier. Figures 6.13-6.15 show phase calibration results for three PSP formulations: Ru(dpp) in a silicone polymer with silica gel, PtTFPP in a silicone polymer with silica gel, and PtTFPP in a porous polymer/ceramic(Al2O3) composite tape casting. Figures 6.16-6.18 show phase calibration results for three TSP formulations: PtTFPP, Ru(trpy)(C6F5-trpy)(NO3)2, and Ru(bipy)2(p-bipy)2 in DuPont

ChromaClear.

и

Подпись:Lifetime ExperimentsПодпись:1 -30

£

ь -35 -40 -45 -50

0 1 2 3 4 5 6 7 8 9 10 11 12 13 14 15

Подпись: From

Pressure (psia)

Подпись:Lifetime Experiments0 -2 -4

Lifetime Experiments

0 1 2 3 4 5 6 7 8 9 10 11 12 13 14 15

Pressure (psia)

Fig. 6.15. Phase calibrations for PSP, PtTFPP in a porous polymer/ceramic(Al2O3) composite tape casting. From Lachendro (2000)


Lifetime Experiments

Temperature (0C)

Fig. 6.16. Phase calibration for TSP, PtTFPP in DuPont ChromaClear. From Lachendro (2000)


Lifetime Experiments

Temperature (0C)

Fig. 6.17. Phase calibration for TSP, Ru(trpy)(C6F5-trpy)(NO3)2 in DuPont ChromaClear. From Lachendro (2000)

Lifetime Experiments

Temperature (oC)

Fig. 6.18. Phase calibration for TSP, Ru(bipy)2(p-bipy)2 in DuPont ChromaClear. From Lachendro (2000)

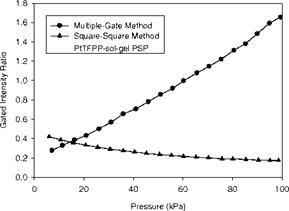
Goss et al. (2000) evaluated the lifetime techniques based on several different modulation/gating combinations such as the time-resolved multiple-gate method for the pulse excitation, sine-square method, and square-square method. The detectors used were ICCD, phase-sensitive interline-transfer CCD, and back-lit CCD with a liquid-crystal shutter. A xenon strobe light and a Nd:YAG laser were used as a pulse light source, while a LED array was used for the sinusoidal and square-wave excitation. PSP tested was PtTFPP in a sol-gel binder. The gated intensity ratio was measured as a function of pressure using the detectors with different gating strategies. They found that the time-resolved multiple-gate method had greater sensitivity to pressure than other lifetime methods and the intensity-based (or radiometric) method. The square-square method had the second best sensitivity to pressure. Figure 6.19 shows calibration results of the gated intensity ratio for that PSP obtained with the ICCD employing the time – resolved multiple-gate method and square-square method. One of the problems with the ICCD was a high noise level of the system; the rms variation of the gated intensity ratio was as high as 3-5% even after binning.

Lifetime Experiments

Fig. 6.19. Calibration of the gated intensity ratio for PtTFPP-sol-gel PSP with ICCD using the time-resolved multiple-gate method and square-square method. From Goss et al. (2000)

Bell (2001) studied the time-resolved multiple-gate method for the pulse excitation to optimize the gating parameters. He found that the gated intensity ratio was not constant over a PSP-coated surface even at constant pressure and temperature, and the variation was 0.5-3% depending on homogeneity of the paint. This indicated that the lifetime was different at different locations even when pressure and temperature are uniformly invariant over a surface. Earlier, in laser-scanning PSP measurements, Torgerson et al. (1996) observed a variation of about 0.5o in the phase angle (related to the lifetime) across a measurement domain in the flow-off case where pressure and temperature were constant. Similar to Bell’s observation on the gated intensity ratio, the spatial phase pattern was repeatable, dependent on the location. Hartmann et al. (1995) also observed similar results and attributed this phenomenon to microheterogeneity of the polymer environment. The small lifetime or phase variation may not significantly affect PSP measurements at higher Mach numbers, whereas it can introduce a considerable error in low-speed PSP measurements. To correct this intrinsic spatial variation of the lifetime, Torgerson et al. (1996) and Bell (2001) used raw lifetime or phase distributions in the flow-off conditions as a reference, and took a ratio between the wind-on and reference lifetime images (signals). Unfortunately, this correction method defeats to certain degree the original purpose of using the lifetime method to eliminate the wind-off reference. Bencic (2001) compared the lifetime method with the intensity-based method for PSP measurements at high viewing polar angles and in a shadowed region, and found that the lifetime-based measurements achieved better results in these cases.

Mitsuo et al. (2002) studied the luminescent decay of a PtTFPP-based PSP using a streak camera and found that the multiple-exponential decay of the paint was sensitively dependent on pressure and temperature. This characteristic allowed simultaneous determination of pressure and temperature from three gated intensities obtained by an ICCD camera since two ratios between the three gated intensities had sufficiently different dependencies on pressure and temperature. They selected the first and third gating intervals A T1 = 0 -0.8 |j. s and AT3 = 30-82.8 |J. s. The gated intensity I1 in AT1 was almost independent from both pressure and temperature, whereas the gated intensity I3 in AT3 was very sensitive to pressure and temperature. The second gating interval A T2 = 12 -19.4 |j. s was chosen based on minimization of the pressure error due to a small pertubation of the intensity ratio signal. Their calibration experiments showed that pressure could be well described by polynomials of the gated intensity ratios I1/I2 and I1/I3 with the temperature-dependent coefficients. Using the calibration relations, they were able to obtain simultaneously the surface pressure and temperature fields in a sonic impinging jet from the two gated intensity ratio images. Recent tests by Watkins et al. (2003) used a new internally gated interline transfer CCD camera to alleviate noise sources associated with ICCD.

Internally Gated CCD Camera

An internally gated CCD camera is promising for luminescent lifetime imaging. Fisher et al. (1999) developed a phase-sensitive CCD camera system for two­dimensional imaging of concentrations of radical species in reacting flows such as turbulent flames. They modified a commercial scientific-grade CCD camera to perform phase-sensitive imaging as well as to reduce the level of integrated background light. In fact, this internally gated CCD camera has the capability to selectively integrate the time-varying luminescent intensity either in-phase or out – of-phase with respect to the modulated excitation light. A ratio between the out – of-phase and in-phase images is related to the luminescent lifetime, and thus a pressure field can be obtained from a luminescent lifetime image.

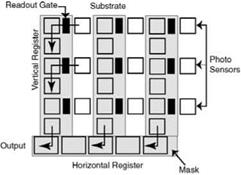
Modern CCD cameras available for industrial machine vision or scientific uses possess many of the features required to construct a phase-sensitive imaging system. Most notably, the feature commonly referred to as ‘electronic shuttering’ can be suitably modified to serve phase sensitive imaging or lifetime imaging. The CCD array architecture employed by cameras capable of performing electronic shuttering is referred to as an interline transfer array shown in Fig. 6.12. It consists of photodiodes separated by vertical transfer registers that are covered by an opaque metal shield that prevents direct entry of photoelectrons. Charge accumulated in the photosensors can be transferred either to the vertical registers or discarded in the substrate by supplying a high voltage to the Read Out Gate (ROG) or the Over Flow Drain (OFD) respectively.

In order to perform phase-sensitive imaging, charge shifting and storage in the CCD must be synchronized with the light-source modulation signal. This requires appropriate modification of the camera controller logic, and of the camera head circuitry and logic. Based on the modulation waveform, a suitable control signal will be generated, which raises the ROG voltage and lowers the OFD voltage during the in-phase half of the cycle. The in-phase luminescent signal is thus integrated into the vertical register. In the out-of-phase half of the modulation cycle, the ROG and OFD voltages are reversed, thus dumping the out-of-phase light into the substrate. This process is repeated for a number of cycles until the full-well capacity of the vertical registers is utilized to maximize the SNR. Finally, after the desired integration time (or the number of cycles) the accumulated charge in the vertical registers can be read out through the horizontal register using conventional frame transfer techniques. The out-of-phase image can be similarly obtained, the only difference being the introduction of a 180° phase lag between the modulation signal and the control signal described above. As pointed out before, a ratio between the out-of-phase and in-phase intensity images, I2 /Ij, is a function of the phase angle or the luminescent lifetime; therefore, a pressure field can be obtained from the luminescent lifetime image.

Internally Gated CCD Camera

Fig. 6.12. Interline transfer CCD architecture and charge flow

Fluorescence Lifetime Imaging

6.3.1. Intensified CCD Camera

The structure of an intensified CCD (ICCD) system is illustrated in Fig. 6.10. After being impacted by a photon, the photocathode creates photoelectrons that are amplified by the micro channel plate (MCP); the amplified electrons are converted back into photons by a phosphor screen. These photons are relayed to a CCD by either a fiber-optic bundle or a relay lens; the CCD creates the photoelectrons that are measured. The biggest advantage of ICCD is its ability of gating that allows the luminescent lifetime imaging over a painted area. Electronic shutter action can be produced by pulsing the MCP voltage and the gain can be modulated by simply changing the voltage on the intensifier. Figure 6.11 illustrates the luminescent lifetime imaging method with an ICCD.

For the pulse excitation light, the gain function is typically a top-hat function or a square function. The luminescent signal is gated in two different intervals during an exponential decay of luminescence and the gated intensity ratio is related to the luminescent lifetime by Eq. (6.29). This approach was employed for PSP measurements by Goss et al. (2000), Bencic (2001), Bell (2001), Baker (2001), and Mitsuo et al. (2002). Another approach uses the sinusoidal excitation light combined with either the square gain function (Holmes 1998) or sinusoidal gain function (Lakowicz and Berndt 1991). Consider the sinusoidally modulated excitation light E(t) = Am[1 + H sin( m t)] and the corresponding luminescent signal from PSP is I(t) = Am z [1 + HM ef sin(mt – f)] , where the effective amplitude modulation index is M eff = (1 + z2 m2) ~1/2 = cos( у). When the gain

function has a square-waveform, the gated intensity ratio is given by Eq. (6.25).

Instead of using the square function, Lakowicz and Berndt (1991) adopted the sinusoidal gain function for modulating the intensifier. When the MCP is sinusoidally modulated, the gain function of the detector is

G(t) = G0 [ 1 + mDsin(mt – вD)] , where G0 is the intensifier gain without applying a modulating signal, mD is the gain modulation depth, and QD is the detector phase angle relative to the modulated illumination light. The CCD collecting photons over an integration time actually serves as an integrator; thus, the signal output from the CCD is represented by a time-averaged intensity over an integration time TINT

1 Г tint

< I > =——– I I( t, r)G( t)dt = Am z G0[ 1 + 0.5Mef mD cos( (p – 6D)] .

TINT J°

(6.31)

Подпись: < I > ( вD2 ) / < I > ( вD! ) Подпись: 1 + 0.5mD cos( у )cos( у - вD2) 1 + 0.5mD cos( у )cos( у - 0D1) Подпись: (6.32)

To extract the phase angle or lifetime from the CCD output < I > , several values of < I > are obtained by changing the detector phase angle вD. Therefore, a system of equations is given for eliminating Am and G0 . These equations can be solved using least-squares method to determine the phase angle ^ that is related to the luminescent lifetime T. In the simplest case where only two different detector phase angles dD1 and вD2 are chosen, a ratio between the two time – averaged intensities at dD1 and вD2 is

Once the parameters mD, 0D1, and вD2 are given, the ratio in Eq. (6.32) is only related to the phase angle ^. Lakowicz and Berndt (1991) used three different detector phase angles to recover the luminescent lifetime. One shortcoming of the intensifier CCD camera is that the SNR may be reduced due to quantum losses and additive noise in the multiple-step photon-electron transfer processes.

Gated Intensity Ratio Method

The gated intensity ratio method, as illustrated in Fig. 6.6, gates the modulated luminescent signal by applying two gain functions over two different intervals, i. e.,

I1 = f I(t)G1(t)dt and I2 = f I(t)G2(t)dt, (6.23)

A T1 A T2

where the gain functions G1(t) and G2(t) are certain time-varying functions. A ratio between the gated intensity integrals, I2 /11, is a function of the luminescent lifetime for given modulation parameters. In the simplest case, the gain function is a top-hat function or a square function where G1(t) = G2(t) = 1 in the time intervals AT1 and AT2 and G1(t) = G2(t) = 0 elsewhere. In this case, the square waveform of G1(t) and G2(t) serves as an ‘on-off’ gating function. The functional form for the excitation light and gain function can be selected to meet the requirements for a specific test. Common combinations are a pulse excitation with a square gain function (pulse-square), a sine-waveform excitation with a square gain function (sine-square), a square-waveform excitation with a square gain function (square-square), and a sine-waveform excitation with a sine – waveform gain function (sine-sine) (Goss et al. 2000).
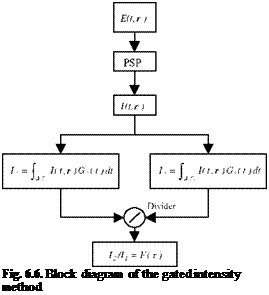
Подпись: Fig. 6.6. Block diagram of the gated intensity method

The modulated luminescent intensity is integrated over a gate time interval from 0 to 1/2f (0 to nin m t) and over a gate time interval from 1/2f to 1/f (nto 2nin m t) relative to a modulated excitation light. For the Fourier-series-form of the modulated excitation light Eq. (6.4), a ratio between the two integrals is

ж – D(ot) ж + D(ot)


I2/I1


I dt


(6.24)


where


2 y1 [1 + i-1)n+1 ](аппют + ьп)

a0 n( 1 + n2m2t2)


D(mx)


Obviously, the ratio 12 /11 is only a function of the non-dimensional lifetime m т and therefore is related to pressure when the modulation frequency is fixed. In particular, the gated intensity ratio for the sinusoidally modulated excitation light E(t) = Am [ 1 + H sin( m t)] has a simple form


rW / r1/2f ж(1 + rn2T2 ) – 2H

I 1 dt I Idt = ————————— —-1————

h/2f / Jo ж(1 + m2t2) + 2H


I2/I1


(6.25)


Gated Intensity Ratio Method

Gated Intensity Ratio Method

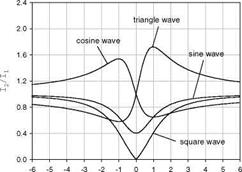
Figure 6.7 shows the gated intensity ratio I2/IJ as a function of the non­dimensional lifetime m x for the excitation light with the square, triangle, sine and cosine waveforms. Although the lifetime is always positive, Figure 6.7 plots the ratio I2 / Ij over a range of -6 < ax < 6 to exhibit the global behavior of I2 / Ij as a function of ax. The behavior of I2 / Ij depends on the waveform of the modulated excitation light. Figure 6.8 shows the gated intensity ratio I2 / Ij as a function of the relative pressure p/pref at different modulation frequencies for a

typical PSP, Ru(dpp) in GE RTV 118, when the sinusoidal excitation light has the modulation depth of H = J.
Gated Intensity Ratio Method

ют (radian)

Fig. 6.7. The gated intensity ratio as a function of the non-dimensional luminescent lifetime


Gated Intensity Ratio Method

Fig. 6.8. The gated intensity ratio as a function of pressure at different modulation frequencies for Ru(dpp) in gE RTV 118 (T = 20oC and Prf = J atm) when the modulated excitation is sinusoidal


Подпись: p Подпись: d(I2/I1) _ 8жт2 x H дт dp [ж(1 + m2x2) + 2H]2 dp Подпись: (6.26)

For the sinusoidal excitation light, the non-dimensional modulation frequency and modulation depth can be selected to achieve the greatest sensitivity of the gated intensity ratio to pressure defined as

The optimal modulation frequency for the maximum sensitivity is

(ai)0p _{3 «1.732 . (6.27)

For Ru(dpp) in GE RTV 118 that has the lifetime of 4.7 p. s at the ambient conditions, the optimal modulation frequency is 59 kHz.

The appropriate modulation depth H can also be selected according to certain criteria for a balance between the pressure sensitivity and SNR. It is noted that the off-phase intensity I2 _ (Am x/2f)[1 -(2H/ж)(1 + m2x2)- ] decreases as H increases and the normalized off-phase intensity at the optimal modulation frequency is I2/(I2)H_0 _ 1 – H / 2rn. Since the SNR is proportional to

[I2/(I2 )H_0]1/2 _ (1 – H/2n)1/2, the SNR is a decreasing function of H in a range of 0 < H < 1. On the other hand, the normalized sensitivity Sp at the

optimal modulation frequency, which is proportional to H /(2n+ H )2, is an increasing function of H in a range of 0 < H < 1 . Therefore, the appropriate

modulation depth H of about 0.5 is chosen to achieve both a high SNR and good pressure sensitivity.

Подпись: I2/I1 Подпись: [1/f+At I dt / [1/2f+At I dt _ Ж - 2H cos(y )cos( у - mAt) J1/2f+At / JAt ж + 2H cos(y )cos(у - mAt) Подпись: (6.28)

The gated intensity integrals I2 and I2 are taken over the intervals from 0 to 1/2f (0 to n in m t) and 1/2f to 1/f (n to 2n in m t). The time variable t in these integrals is relative to the modulated excitation light. The integration is carried out immediately after the measurement system receives a trigger signal that is synchronized with the modulated excitation light. The trigger signal can be provided by a photodiode sensing the excitation light or a driver for the modulator. In practice, however, the trigger signal may have a time delay relative to the excitation light. The time delay, although small, may significantly alter the relation between I2 / I1 and pressure especially when the modulation frequency is high. For the sinusoidally modulated excitation light E(t) _ Am[ 1 + H sin( m t)] , if the trigger signal has a time delay At, the gated intensity ratio is

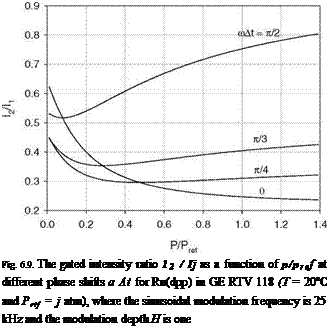
where cos( y)_ 1/^1 + (mx)2 . For a typical PSP, Ru(dpp) in GE RTV 118, Figure 6.9 shows the relation between I2 / I1 and p/pref for different phase shifts mAt, where the sinusoidal modulation frequency is 25 kHz and the modulation depth is H = 1. It is clear that the behavior of the relation is significantly affected

Подпись: Fig. 6.9. The gated intensity ratio 12 / Ij as a function of p/pref at different phase shifts a At for Ru(dpp) in GE RTV 118 (T = 20oC and Prtf = j atm), where the sinusoidal modulation frequency is 25 kHz and the modulation depth H is one

by the phase shifts a At and the curve is even no longer monotonous when the phase shift is large. The similar change also occurs for the excitation light having other waveforms like the square waveform. This change due to the trigger signal delay was observed in experiments.

Furthermore, the gated intensity ratio method can be applied to the pulse excitation light; in this case, the luminescent intensity signal is I(t) = Amexp( -1/t ). For two gating intervals [t0,tj] and [t2,t3] where

Подпись: I,/I, Подпись: 'ld, Г Id, = ЄХР( - T 1 ~ eXP( - ‘2' ” > t2 to exp( - tj/ T ) - exp( - t0/ T ) Подпись: (6.29)

t3 > t2 > tj > t0 is assumed, the gated intensity ratio is

For the given gating intervals, the ratio I2 / I1 is only related to the lifetime. This integration approach was used as an alternative to the time-resolved pulse approach, which was called the time-resolved multiple-gate method by Goss et al. (2000). Bell (2001) discussed an optimization problem of the gating parameters (t0, t1, t2, t3) to achieve the maximum sensitivity in an ICCD camera system. In

Подпись:a limiting but representative case where the time t g intervals [0, tg ] and [tg, ] (t0 = 0 , t3 , t1 = t2

Подпись: I2/I, =exp(- tg/T)

1 – exp( – t /t )

Although the above methods utilize two gating intervals, three gating intervals can be similarly used and therefore two gated intensity ratios like Il /12 and Il /13 can be obtained. If the two gated intensity ratios have sufficiently different dependencies to pressure and temperature for certain PSP, the surface pressure and temperature distributions can be determined simultaneously from the gated intensity ratio images.

Amplitude Demodulation Method

Amplitude Demodulation Method Подпись: (6.17) , Deka et al. (1994) (5.18)

The amplitude demodulation method was used for fluorescent lifetime measurements of tagged biological specimens in a flow cytometer (Deka et al. 1994). For the sinusoidally modulated excitation light, the luminescent response is given by Eq. (6.7) and the effective amplitude modulation index is M eff = (1 + t2 m2) ~1/2. Clearly, for a fixed modulation frequency, the lifetime can be obtained from measurement of the effective modulation index. Combination of the Stern-Volmer relation Eq. (6.10) with Meff = (1 + т2m2) ~1/2 yields an expression for pressure as a function of the effective amplitude modulation index Meff

where tmax and tmin were the times at which the modulated oscillating luminescent signal went through the maximum intensity Imax( tmax) and minimum intensity

LiJ tmin ) , respectively.

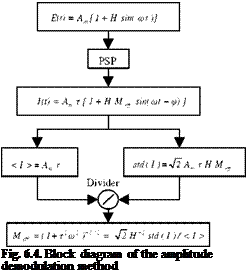
Here, as illustrated in Fig. 6.4, a simpler scheme is proposed to determine Meff by calculating the time-averaged quantities of the modulated luminescent signal. Define the time-averaged oscillating luminescent signal

1 CT

< I >= Lim— I I(t)dt. (6.19)

T2T J-t

The mean and standard deviation of the luminescent intensity I(t) are < I >= Am t and std(I) = < (I-< I >)2>1/2 = Am тHMeff/-[2 . Therefore, taking a ratio between these quantities, we obtain a simple formula for the effective amplitude modulation index Meff = (1 + т2 m2) ~1/2

Подпись: (6.20)Mff =42h -1 = < E > 1ША

eff < I > std(E) < I >

It is emphasized that Eq. (6.20) is valid only for the sinusoidally modulated excitation light E(t) = Am [ 1 + H sin( m t)] . Instrumentation for utilizing this

methodology is particularly simple since only the mean and standard deviation of the sinusoidal luminescent intensity and excitation light intensity are required.

The optimal modulation frequency can be obtained by maximizing the sensitivity of Meff to pressure

Amplitude Demodulation Method
Подпись: (6.21) (6.22)

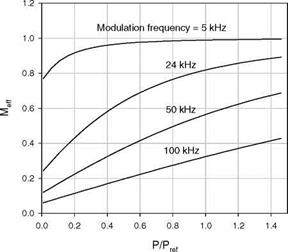
For a typical PSP, Ru(dpp) in GE RTV 118, having the lifetime т = 4.7 |J. s at the ambient conditions, the optimal modulation frequency is 41 kHz. Figure 6.5 shows the effective amplitude modulation index Meff as a function of the relative

Подпись: Fig. 6.4. Block diagram of the amplitude demodulation method

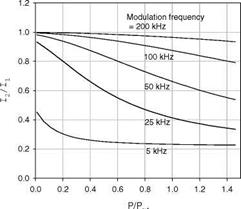
pressure p/pref at different sinusoidal modulation frequencies for this PSP having the lifetime t = tref/(0.17 + 0.84p/pref). Clearly, the selection of the modulation frequency affects the performance of the system.

Amplitude Demodulation Method

Fig. 6.5. The effective amplitude modulation index M eg as a function of relative pressure

at different sinusoidal modulation frequencies for Ru(dpp) in GE RTV 118 for T = 20oC and p = 1 atm

Phase Method

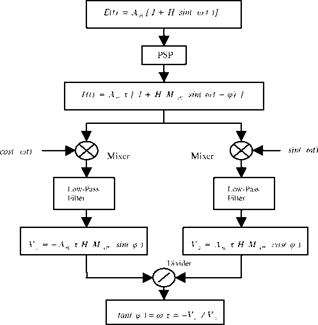
The phase method is a frequency-domain technique that detects a phase shift of the luminescent signal with respect to the modulated excitation light (Torgerson et al. 1996; Torgerson 1997). Figure 6.2 shows the working principle of the phase method with a lock-in amplifier. For the sinusoidal excitation light E(t) = Am[l + H sin( a t)] , the corresponding modulated luminescent signal from a photodetector is mixed with the in-phase and quadrature reference signals, i. e., sin( a t) and cos( a t). Next, the use of a low-pass filter generates the DC components Vc = – Am %H Meff sin(p) and Vs = Am % HMeffcos(^), which are related to the phase angle ^ between the luminescent emission and excitation light. A

Подпись: p = K Phase Method Подпись: (6.14)
Подпись:

ratio between these filtered signals yields a quantity tan(p = mx = – Vc/Vs that is uniquely related to the lifetime for a fixed modulation frequency. Therefore, pressure is given by

The sensitivity of the phase angle ^ to pressure is defined as

Подпись: (6.15)Подпись: SP =-dp = а дт

dp 1 + (m )2 dp

The optimal modulation frequency to achieve the maximum sensitivity Sp is

ax = 1. (6.16)

It must be noted that the maximum sensitivity to pressure does not tell the whole story if the noise is not taken into account. Besides good sensitivity to pressure, the signal-to-noise ratio (SNR) should be also considered in order to select the optimal modulation frequency. At a higher frequency, the modulation amplitude
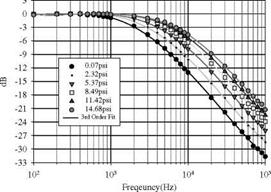
and DC components from PSP decrease, resulting in a lower SNR. Figure 6.3 is a Bode plot showing the response of a typical PSP, PtTFPP in polymer/ceramic composite, to the modulation frequency; the behavior of this PSP is very close to the first-order system.

Phase Method

Fig. 6.2. Block diagram of the phase method

Phase Method

Fig. 6.3. The Bode plot of PSP (PtTFPP in polymer/ceramic composite) at -30°C. From Lachendro (2000)