Category Pressure and Temperature Sensitive Paints

Lifetime Measurement Techniques

6.1.2. Pulse Method

Our goal is to measure the luminescent lifetime and to determine air pressure through the Stern-Volmer relation. A variety of methods can be used to extract the lifetime from the luminescent response to a time-varying excitation light. The pulse method is the most direct method widely used in photochemistry (Lakowicz
1991, 1999). After PSP is excited by a pulsed illumination light, the luminescent decay is measured using a fast-responding photodetector and acquired using a PC or an oscilloscope. The lifetime is calculated by fitting the time-resolved data with a single exponential function or a multiple-exponential function. This direct time-domain approach was used by Davies et al. (1995) for lifetime measurements of PSP. For certain PSP with multiple distinct lifetimes, the pulse method allows simultaneous determination of pressure and temperature if the lifetimes have sufficiently different Stern-Volmer coefficients as a function of temperature. In this case, given the lifetimes (xi), a system of equations for pressure and temperature are

= Ai(T) + Bi(T)—!—, (i = 1,2, ••• N, N > 2 ) (6.13)

L Pref

In principle, unknown pressure and temperature can be simultaneously determined by solving Eq. (6.13).

Higher-Order Model

In a micro-heterogeneous polymer matrix, the multiple-exponential luminescent emission decay can be observed in contrast to the single-exponential decay in a homogeneous medium (Carraway et al. 1991a; Sacksteder et al. 1993; Xu et al. 1994). This is associated with the fact that the host matrix has domains that vary with respect to their interaction with the luminescent probe molecules; as a result, the excited molecules decay at different rates, depending on their environments. Consider a paint system consisting of a number of independently emitting species with different single-exponential lifetimes тi (i = 1,2,3,-■■) and relative contributions. The multiple-exponential luminescent decay is described as

I(t) = ^ ai exp( -1/гi ), (6.9)

where a{ is the weighting constant for the ith component. The luminescent lifetime of each component obeys the Stern-Volmer relation

T0i / Ti = 1 + KSVip, (6.10)

where KSVi is the Stern-Volmer coefficient for the ith component. Hence, a

higher-order model is needed to describe the luminescent response of an inhomogeneous PSP to a time-varying excitation light. We consider a third-order model

a0 d3I/ dt3 + a1d2I / dt2 + a2dI / dt + a3I = E(t). (6.11)

With the initial conditions I(0) = I'(0) = I"(0) = 0, a solution for (6.11) is

I(t) = J E(u) ^ atexp[ -(t – u )/ti ] du. (6.12)

0 i=1

The lifetimes ti are related to the weighting constants at through the roots of the characteristic equation a0s3 + a1s2 + a2s + a3 = 0 . The weighted mean lifetime is usually expressed as < т > = ^ ai т{/ ^ ai. A general model for the non­exponential decay of luminescence was discussed by Ruyten (2004) and Ruyten and Sellers (2004) considering the continuous decay rate spectrum and excitation response function.

Response of Luminescence to Time-Varying Excitation Light

6.1.1. First-Order Model

The lifetime method for PSP and TSP is based on the response of luminescence to a time-varying excitation light. The response of the luminescent emission I from a paint to an excitation light E(t) can be described as a first-order system

dl/dt = -1/t + E(t), (6.1)

where t is the luminescent lifetime. With the initial condition I(0) = 0, a solution to Eq. (6.1) is

I(t) = f exp[ -(t – u )/t ]E( u )du. (6.2)

Jo

For a pulse light E(t) = Am S(t), the luminescent response is simply an exponential decay

Response of Luminescence to Time-Varying Excitation Light
I(t) = Amexp( -1/t ). (6.3)

Подпись: I(t) = Am T Подпись: a0_ 2 Response of Luminescence to Time-Varying Excitation Light Подпись: (6.5)

where m = 2kf is the circular frequency of the excitation light. Substitution of Eq. (6.4) into Eq. (6.2) yields the luminescent response after a short transient process

Here, the phase angles pn are related to the luminescent lifetime by

tan yn = nmx. (6.6)

In the simplest case where the sinusoidally modulated excitation light is E(t) = Am [1 + H sin( m t)] , the luminescent response Eq. (6.5) is reduced to

where Meff = (1 + x2 m2) 1/2 is the effective amplitude modulation index, Am is the amplitude, and H is the modulation depth. The phase angle ^ is related to the luminescent lifetime simply by

tan (p = rnx. (6.8)

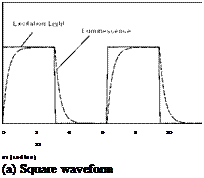
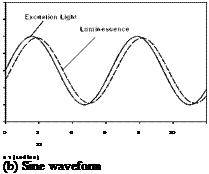
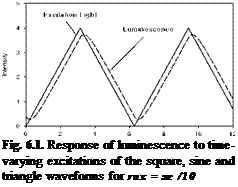
Other waveforms of the excitation light include square and triangle. Figure 6.1 shows the luminescent response to typical periodic excitations with the square, sine and triangle waveforms for the non-dimensional lifetime of юх = ж/10 .

Подпись:2.5

2.0

>, 1.5

~ 1.0 0.5 0.0

Подпись: 0 2 4 6 8 10 12 a t (radian) (b) Sine waveform 4.0

3.5

3.0 .= 2.5 = 2.0

1.5

1.0

Подпись: Fig. 6.1. Response of luminescence to time-varying excitations of the square, sine and triangle waveforms for rnx = ж /10

0.5

at (radian)

(c) Triangle waveform

Lifetime-Based Methods

Compared with the widely used intensity-based method, the greatest advantage of the lifetime-based method is that a relation between the luminescent lifetime and pressure is not dependent on the illumination intensity. Therefore, the problem associated with non-uniform illumination in the intensity-based method becomes essentially irrelevant to the lifetime method. Theoretically speaking, lifetime measurement is also insensitive to luminophore concentration, paint thickness, photodegradation and paint contamination; thus a wind-off reference intensity image (or signal) is not required and the troubles associated with model deformation do not exist. The lifetime method for PSP and TSP can be applied to both a laser scanning system and an imaging system. Davies et al. (1995) developed a pulsed laser scanning system to directly determine the luminescent lifetime and used it to measure the pressure distributions on a cylinder in subsonic flows and on a wedge at Mach 2. Torgerson et al. (1996) developed a portable, modulated, two-dimensional laser scanning system that can simultaneously measure both the luminescent intensity and phase angle; this system was used to measure the surface pressure distributions in a low-speed impinging jet and on an airfoil in transonic flow. The system was further refined by Lachendro et al. (1998) and used to measure the pressure distributions on a wing of a Beechjet in flight tests. A fluorescent lifetime imaging (FLIM) system for PSP and TSP has become promising as solid-state imaging technology makes a rapid advance. The FLIM system, originally proposed by biochemists for oxygen detection in a small area (Szmacinski and Lakowicz 1995; Hartmann and Ziegler 1996), was used for PSP measurements in wind tunnels at DERA (Holmes 1998). DERA’s FLIM system comprised a phase-sensitive camera, modulated blue LED array, associated control hardware and computer. This Chapter discusses the response of the luminescent emission to a time-varying excitation light and describes the luminescent lifetime measurement techniques, including the pulse method, phase method, amplitude demodulation method and gated intensity ratio method. Although the discussion is focused on PSP, these techniques are generally applicable to TSP as well. Measurement uncertainty of the lifetime methods is discussed in Chapter 7. Similar analyses of the lifetime-based techniques were given by Goss et al. (2000) and Bell (2001).

Generation of Deformed Surface Grid

For a more accurate representation of data, PSP and TSP results in images should be mapped onto a deformed surface grid of a model rather than a rigid surface grid when the model undergoes a large deformation in wind tunnel tests. Aeroelastic deformation data for a model can be obtained using videogrammetric model deformation (VMD) measurement technique (Burner and Liu 2001). Hence, PSP and TSP systems should be integrated with a VMD system for fusion of pressure and temperature data with deformation data (Bell and Burner 1998; Liu et al. 1999). There are two approaches for integration of PSP/TSP with VMD. The first approach uses PSP/TSP simultaneously with VMD as a separate and independent system, while VMD, that is operated under the PSP/TSP lighting and surface conditions, provides deformation data for generating a deformed surface grid. The advantage of this approach is that the structure of a PSP/TSP system is not changed and PSP/TSP operation suffers no interference from VMD operation in large production wind tunnels. In contrast, the second approach uses the same camera for both PSP/TSP and VMD measurements at the same time; VMD software is integrated as an additional part of the PSP/TSP software package. Instead of a nearly normal view of a camera for pure PSP/TSP application, the combined system requires an oblique viewing angle of a camera to achieve good position sensitivity for VMD measurements.

Usually, VMD gives wing deformation characterized by the twist and bending of a wing. When the local translation and twist are measured by VMD at different spanwise locations of a wing, a transformation of translation and rotation can be used to generate a deformed surface grid of the wing. At a spanwise location Y,

5.7. Generation of Deformed Surface Grid 113

Подпись: X'
Подпись: Z' Generation of Deformed Surface Grid Подпись: (5.44)

the deformed coordinate (X’ ,Y, Z ) on a wing surface grid is locally related to the non-deformed grid coordinate (X, Y,Z) by

Подпись: R(Y) Подпись: COs в twist - Sin в twist Подпись: Sin в twist COS в twist у Подпись: (5.45)

The translation vector at a spanwise location Y of the wing is (Tx, Tz) and the rotational matrix is

Generation of Deformed Surface Grid
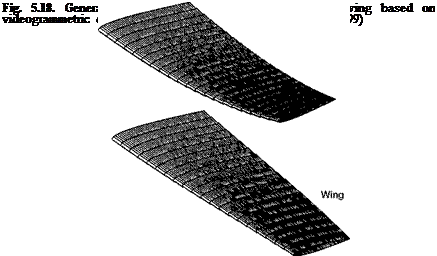
where the twist 9twist is a function of the spanwise location Y. When the bending relative to the wingspan is small, the spanwise location does not change much, i. e., Y’ ~ Y, and the wing airfoil section remains the same. For illustration, we consider a fictional wing with a NACA0012 airfoil section and assume that the spanwise distributions of twist and bending are given by dtwist =- 5(Y/b)3, Tz = 0.08b(Y/b)3 and Tx = 0, where b is the semi-span of the wing. Figure 5.18 shows a deformed surface grid generated using a transformation of translation and rotation.

Pressure Correction for Extrapolation to Low-Speed Data

PSP is particularly effective in high subsonic, transonic and supersonic flow regimes. However, in low-speed flows where the Mach number is typically less than 0.3, PSP measurement is a challenging problem since a very small pressure change may not be sufficiently resolved by PSP. The major error sources, notably the temperature effect, image misalignment and CCD camera noise, must be minimized to obtain acceptable quantitative pressure results at low speeds. The resolution of PSP measurements is eventually limited by the photon shot noise of a CCD camera. Liu (2003) proposed a pressure-correction method as an alterative to extrapolate low-speed pressure data without directly attacking the intrinsic difficulty of PSP instrumentation for low-speed flows. This method is able to obtain the incompressible pressure coefficient from PSP measurements at suitably higher Mach numbers (typically Mach 0.3-0.6) by removing the compressibility effect.

Pressure Correction for Extrapolation to Low-Speed Data
It is noticed that there is a significant difference between the responses of the absolute pressure p and the pressure coefficient Cp to the freestream Mach

For Mі << 1, SC is much smaller than S„_p ; for Mf= 0.3 and

Cp p pf

dM f /M f = 10%, the relative change of the absolute pressure difference is d( p – pf )/(p – pf ) ~ 20% , while the relative change of Cp is only
dCp/Cp ~ 0.9%. Clearly, PSP can take the advantage of the relative insensitivity of Cp to the Mach number to obtain the approximate incompressible

pressure coefficient distribution at suitably higher Mach numbers. Furthermore, the compressibility effect can be corrected using the pressure-correction methods.

Historically, the pressure-correction formulas were derived in order to extrapolate the pressure coefficient in subsonic compressible flows from the incompressible flow theory and low-speed pressure measurements. In contrast, for PSP applications, the pressure-correction formulas are used to transform the compressible Cp to the corresponding incompressible Cpinc. The theoretical

foundation for pressure correction in 2D potential flows is well established. The linearized theory for subsonic compressible flows gives the Prandtl-Glauert rule (Anderson 1990)

Cp = Cpnc/Ji-мї. (5.38)

The use of a hodograph solution of the non-linear potential equation gives the Karman-Tsien rule (Anderson 1990)

C

Подпись: CПодпись: 2

Pressure Correction for Extrapolation to Low-Speed Data
Подпись: yjl - M і +

Cp =———————– —p——————- T———– . (5.39)

For PSP measurements on 2D airfoils at suitably high Mach numbers, both the Prandtl-Glauert rule and Karman-Tsien rule can be used to recover the incompressible pressure coefficient. Bell and Hand (1998) used the Prandtl – Glauert rule for the purpose of improving the image ratioing procedure of PSP to obtain a pseudo wind-off pressure coefficient at a suitably low velocity. For complex 3D viscous flows such as separated flows, however, a general pressure – correction method is required.

Liu (2003) developed an iterative pressure-correction method for 3D flows. For Ml << 1, a pressure field can be generally expressed as a power series of Ml. The pressure-correction formula for a general surface Z = S( X, Y) has a functional form composed of an incompressible term and a compressible correction term

Cp « Cpinc + Ml F[X, Y,S( X, Y)] . (5.40)

Eq. (5.40) is valid for not only potential flows, but also complex viscous flows over a 3D body. Because Cpinc = Cpinc[ X, Y,S( X, Y)] is a function of X and Y,

we can, in principle, eliminate X in the correction function F[X, Y,S( X, Y)] by using Cpinc and Y. Therefore, since the correction function F[X, Y,S(X, Y)] is not specified yet, the equivalent form to Eq. (5.40) is

Cp « Cpnc + Ml F( CpinC, Y). (5.41)

Eq. (5.41) indicates that the pressure correction in 3D flows depends on not only Cpinc, but also one space coordinate Y. Note that the functional form of Eq. (5.41) remains valid after the coordinate Y is switched to another coordinate X. When

Cp does not change along the coordinate Y, Eq. (5.41) is naturally reduced to the method for 2D and axisymmetrical flows. By writing F(Cpinc, Y) as a polynomial function, Eq. (5.41) becomes

Cp « Cpinc + Mі £an(Y)Cliric. (5.42)

n=0

When the distributions of Cp and Cpinc are known along an intersection between the plane Y = const. and the surface Z = S( X, Y), the coefficients an(Y) can be determined using least-squares method. In wind tunnel measurements, pressure tap data in subsonic flow and the corresponding low-speed flow can be used to establish the relationship between Cp and Cpinc. However, this approach is not convenient for PSP measurements in wind tunnels since extra pressure tap data are required. Here, an iterative method is proposed to recover Cpinc from Cp data at

Подпись: M ^ and Mi2 without use of additional pressure tap data. Denote Cp1 and Cp2 as the pressure coefficients at M Подпись: and Подпись: M 2

two different subsonic Mach numbers Mand Mi2. The biggest advantage of this method is that C inc can be directly obtained from two PSP images taken at

respectively, and assume M ^ < Mi2. Given the distributions of Cp1 and Cp2 along an intersection between the plane Y = const. and surface Z = S(X, Y), we need to solve the following equations to recover Cpinc and an(Y)

N

Cp1 « Cpinc + Mh Xan(Y)Cnpinc n=0

Cp2 ~ Cpinc + M22 Xan(Y)Cnpinc. (5.43)

n=0

An iteration scheme for solving Eq. (5.43) is described below.

(1) Give the initial distribution Cpinc(k) = Cp1 (k = 0) as a function of X along an

intersection between Y = const. and Z = S( X, Y) in the object space (a row or column in the image plane). Here, k is the iteration index number; (2) Determine the coefficients an(k)(Y) (n = 0,1…N) in the polynomial from a system of

N

equations (Cp2 – Cpinc(k))/M І2 = X an(k)(Y )C"pinc(k) using least-squares

n=0

N

method; (3) Substitute an(Y) into Cpinc(k+1) ~ Cp1 – Mh Xan(k)(Y )Cnpinc(k) to

n=0

obtain the corrected value Cpinc(k+1); (4) Go back to Step (2), replace Cpinc(k) by the corrected value Cpinc(k+1) and iterate until the converged results

Cpinc = Lim Cpinc(k) and an(Y) = Lim an(k)(Y) (n = 0,1…N) are obtained; (5)

Output the final Cpinc = Cpinc[X, Y,S(X, Y)] and an(Y).

After processing for a large set of intersections, we can recover the distribution of Cpinc on the whole surface. Unlike the classical pressure-correction formulas

for 2D flows, this iterative method is a non-local approach that has to be done along an intersection. The selection of the order N of the polynomial in Eq. (5.43) depends on the complexity of the Mach number effect on the pressure distribution along the intersection. For 2D flows and near-2D flows, N = 2 is sufficient; for more complex flows, the order of the polynomial could be higher. The number of available data points on an intersection eventually limits the order of the polynomial.

For PSP, data processing is typically done in the image plane rather than in the object space. Therefore, for convenience, the pressure-correction method should be used in the image plane. The aforementioned analysis is made in an arbitrary object-space coordinate system (X, Y,Z) or a general non-orthogonal curvilinear coordinate system on a surface. Since there is a one-to-one projection mapping between the image plane (x, y) and the surface Z = S(X, Y), the iterative pressure correction method can be directly applied to rows or columns in PSP images.

There are limitation conditions for application of the iterative pressure – correction method (actually for any pressure-correction method). First, the two

Mach numbers M x1 and M^2 should be lower than the critical Mach number at which flow becomes sonic at certain point on a surface. Secondly, the pressure – correction method relies on an assumption that the pressure distribution does not have a drastic change due to the Reynolds number effect as the Mach number increases from M ^ = 0 to M x1 and M ^2. When the Reynolds number effect on pressure overwhelms the effect of the Mach number, the pressure-correction method cannot produce correct results because the flow pattern has been qualitatively changed. This situation may happen on a high-lift model under certain testing conditions in certain flow separation regions that are particularly sensitive to the Reynolds number effect. Fortunately, there is a large class of flows in which the Reynolds number does not significantly affect the surface pressure distribution, such as attached flows and certain separated flows whose separation and re-attachment lines are fixed. For these flows, the pressure – correction method is applicable.

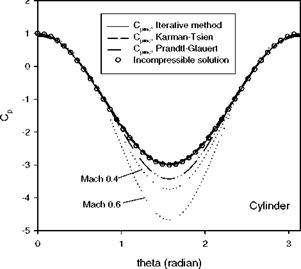
The iterative pressure-correction method was validated for flows over a circular cylinder, sphere, prolate spheroid, transonic body and delta wing (Liu 2003). Figure 5.16 shows the incompressible Cpinc distribution on a circular cylinder

recovered by the iterative pressure-correction method along with the results obtained using the Prandtl-Glauert rule and Karman-Tsien rule. The iterative method produced excellent recovery of Cpinc given by the incompressible solution

of potential flow over a cylinder (Lighthill 1954). The Karman-Tsien rule also gave a good correction while the Prandtl-Glauert rule was not accurate in the low – pressure region Cp = [ -3,-2 ] . The iterative method used the Cp distributions at Mx1 = 0.4 and M^2 = 0.6 . The order of polynomial was N = 2 and the solution for Cpinc converged after 10 iterations. Both the Karman-Tsien rule and Prandtl-

Glauert rule used Cp at M^ = 0.4 to recover Cpinc. Figure 5.17 shows the

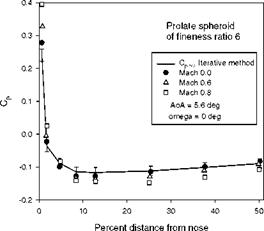
pressure correction for a prolate spheroid of a fineness ratio of 6 at the angle of attack of 5.6o and zero ellipsoidal coordinate (Matthews 1953). The iterative method used Cp data at Mx1 = 0.6 and Mx2 = 0.8. Even though these Mach

numbers are quite high, the iterative method still produced good results since the Mach numbers were less than the critical Mach number of 0.904 in this case. To examine the capability of the iterative pressure-correction method for complex vortical separated flows, it was also used to recover C inc on the upper surface of a 65o delta wing; the recovered Cpinc distributions showed a correct trend as the Mach number increases.

Pressure Correction for Extrapolation to Low-Speed Data

Fig. 5.16. Pressure correction for a circular cylinder to recover the incompressible pressure coefficient. From Liu (2003)

Pressure Correction for Extrapolation to Low-Speed Data

Fig. 5.17. Pressure correction for a prolate spheroid to recover the incompressible pressure coefficient. From Liu (2003)

Conversion to Pressure

Conversion to Pressure Conversion to Pressure Подпись: (5.31)

In PSP measurements, conversion of the luminescent intensity to pressure is complicated by the temperature effect of PSP especially when the surface temperature distribution is not known. Empirically, a priori calibration relation between air pressure and the relative luminescent intensity is expressed by a polynomial

The experimentally determined coefficients Cl, C2 and C3 in Eq. (5.31) can be expressed as a polynomial function of temperature. If a distribution of the surface temperature is not given and the thermal conditions in a priori laboratory calibrations are different from those in wind tunnel tests, a priori relation Eq.

(2.31) cannot be directly applied to conversion to pressure. To deal with this problem, a short-cut approach is in-situ PSP calibration that directly correlates the luminescent intensity to pressure data from taps distributed on a model surface. In this case, the constant coefficients Cl, C2 and C3 in Eq. (5.31) are determined using least-squares method to achieve the best fit to the pressure tap data over a certain range of pressures. Through in-situ calibration, the effect of a non-uniform surface temperature distribution is actually absorbed into a precision error of least – squares estimation. When the temperature effect of PSP overwhelms a change of the luminescent intensity produced by pressure, in-situ calibration has a large precision error. In addition, when the pressure tap data do not cover the full range of pressure on a surface, in-situ PSP conversion may lead to a large bias error in data extrapolation outside the calibration range of pressures.

Подпись: P Poff Conversion to Pressure Подпись: к Подпись: off Подпись: 2 Подпись: (5.32)

A hybrid method between in-situ and a priori methods is the so-called K-fit method originally suggested by M. Morris and recapitulated by Woodmansee and Dutton (1998). Eq. (5.31) is re-written as

where If = I( pojf, Tojf ) is the luminescent intensity in the wind-off conditions, and Kj = Iref / If and KP = pref / Pf are called the K-factors. The reference

conditions under which a priori calibration is made in a laboratory are generally different from the wind-off conditions in a wind tunnel. While the factor KP = pref / p0ff is known, the factor KI = Iref / If is generally not known and has to be determined since illumination conditions and photodetectors used in laboratory may be different from those in wind tunnel. Given the coefficients C1 , C2 and C3 at a known temperature on an isothermal surface, KI can be determined using a single data point from pressure taps. When the surface temperature data near a number of pressure taps are provided by other techniques like TSP and IR camera, a more accurate value of KI can be obtained using least – squares method with larger statistical redundancy. In the worst case where the surface temperature distribution is totally unknown, assuming an average temperature over the surface, we still able to estimate KI by fitting the pressure tap data. Similar to in-situ calibration, the effect of a non-uniform temperature distribution is absorbed into a precision error of least-squares estimation for KI.

Подпись: ref I Подпись: = g(Thf Подпись: (5.33)

Bencic (1999) used a similarity variable of the luminescent intensity to scale the temperature effect of certain PSP

corr

where g(T) was a function of temperature to be determined by a priori calibration. Under this similarity transformation, the calibration curves for the paint at different temperatures collapsed onto a single curve with the temperature – independent coefficients, i. e.,

(5.34)

In this case, instead of using a 2D calibration surface in the parametric space, only a single one-parameter relation Eq. (5.34) was used to convert the luminescent intensity ratio to pressure. Bencic (1999) found that this similarity was valid for a

Ruthenium-based PSP used at NASA Glenn. In fact, as pointed out in Section

3.6, this similarity is a property of the so-called ‘ideal’ PSP that obeys the following relations (Puklin et al. 1998; Coyle et al. 1999)

Подпись: I ref ( pref ’ Tref ) I(P,Tf) Conversion to Pressure Подпись: (5.35)

I(p, T)/I(p, Tref) = g(T),

Puklin et al. (1998) found that PtTFPP in FIB polymer was an ‘ideal’ PSP over a certain range of temperatures. Note that this similarity (or invariance) is not the universal property of a general PSP.

Image Registration

The intensity-based method for PSP and TSP requires a ratio between the wind-on and wind-off images of a painted model. Since a model deforms due to aerodynamic loads, the wind-on image does not align with the wind-off image; therefore these images have to be re-aligned before taking a ratio between the images. The image registration technique, developed by Bell and McLachlan (1993, 1996) and Donovan et al. (1993), is based on an ad-hoc transformation that
maps the deformed wind-on image coordinates (xon, yon) onto the reference wind-off image coordinates (xoff, yof ). In order to register the images, some black fiducial targets are placed on a model. When the correspondence between the targets in the wind-off and wind-on images is established, a transformation between the wind-off and wind-on image coordinates of the targets can be expressed as

Подпись: Xoff = X °цф( xon )фі( yon ) У off = X ЬФ( Xon W yon )(5.27)

The base functions ф(^) are either the orthogonal functions like the Chebyshev functions or the non-orthogonal power functions ф(х) = x1 used by Bell and McLachlan (1993, 1996) and Donovan et al. (1993). Given the image coordinates of the targets placed on a model, the unknown coefficients atj and btj can be determined using least-squares method to match the targets between the wind-on and wind-off images. For image warping, one can also use a 2D perspective transform (Jahne 1999)

Подпись: (5.28)ai1Xon + ai2y0n + ai3 a31 Xon + a32 yon + 1

a21 Xon + a22 yon + a23 a31Xon + a 32 y on + 1

Although the perspective transform is non-linear, it can be reduced to a linear transform using the homogeneous coordinates. The perspective transform is collinear that maps a line into another line and a rectangle into a quadrilateral. Therefore, Eq. (5.28) is more restricted than Eq. (5.27) for PSP and TSP applications.

Before the image registration technique is applied, the targets must be identified and their centroid locations in images must be determined. The target centroid (xc, yc) is defined as

where і(xi, yi) is the gray level on an image. When a target contains only a few pixels and the target contrast is not high, the centroid calculation using the definition Eq. (5.29) may not be accurate. Another method for determining the target location is to maximize the correlation between a template f(x, y) and the target scene I( x, y) (Rosenfeld and Kak 1982). The correlation coefficient Cfl is defined as

Image Registration
Подпись: (5.30)

For the continuous functions f(x, y) and 1(x, y), one can determine the location (x0,y0) of the target by maximizing Cfl. However, it is found that for small targets in images, sub-pixel misalignment between the template and the scene can significantly reduce the value of Cfl even when the scene contains a perfect

replica of the template. To enhance the robustness of a localization scheme, Ruyten (2001b) proposed an augmented template f(x, y) = f0(x, y) + fxAx + fyAy, where f0(x, y) represented a conventional

template and fx and fy are the partial derivatives of f( x, y ) . The additional shift parameters (Ax, Ay) allowed more robust and accurate determination of the target locations.

In PSP and TSP measurements, operators can manually select the targets and determine the correspondence between the wind-off and wind-on images. However, PSP and TSP measurements with multiple cameras in production wind tunnels may produce hundreds or thousands of images in a given test; thus, image registration becomes very labor-intensive and time-consuming. It is non-trivial to automatically establish the point-correspondence between images taken by cameras at different viewing angles and positions. This problem is generally related to the epipolar geometry in which a point on an image corresponds to a line on another image (Faugeras 1993). Ruyten (1999) discussed the methodologies for automatic image registration including searching targets, labeling targets and rejecting false targets. Unlike ad-hoc techniques, the searching technique based on photogrammetric mapping is more rigorous. Once cameras are calibrated and the position and attitude of a tested model are approximately given by other techniques (such as accelerators and videogrammetric techniques), the targets in the images can be found using photogrammetric mapping from the 3D object space to the image plane (see Section 5.1).

The aforementioned methods of using a single transformation for the whole image is a global approach for image registration. A local approach proposed by Shanmugasundaram and Samareh-Abolhassani (1995) divides an image domain into triangles connecting a set of targets based on the Delaunay triangulation (de Berg et al. 1998). For a triangle defined by the vertex vectors Rj, R2 and R2, a point in the plane of the triangle can be described by a vector u2 Rj + U2 R2 + u3 R3, where (Uj, u2,u3) are referred to as the parametric (barocentric) coordinates and a constraint uj + u2 + u3 = 1 is imposed. When a wind-on pixel is identified inside a triangle and its parametric coordinates is given, the corresponding wind-off pixel can be determined by using the same parametric coordinates in the vertex vectors of the corresponding triangle in the wind-off image. Finally, the image intensity at that pixel is mapped from the wind-on

image to the wind-off image. This approach is basically a linear interpolation assuming that the relative position of a point inside a triangle to the vertices is invariant under a transformation from the wind-on image to the wind-off image. Weaver et al. (1999) proposed a so-called Quantum Pixel Energy Distribution (QPED) algorithm that utilizes local surface features to calculate a pixel shift vector using a spatial correlation method. The local surface features could be targets, pressure taps, and dots formed from aerosol mists in spraying on a basecoat. Similar to particle image velocimetry (PIV), the QPED algorithm can give a field of the displacement vectors when the registration marks or features are dense enough. Based on the shift vector field, the wind-on image can be registered. Although the QPED algorithm is computationally intensive, it can provide the local displacement vectors at certain locations to complement the global image registration techniques. A comparative study of different image registration techniques was made by Venkatakrishnan (2003).

Correction for Self-Illumination

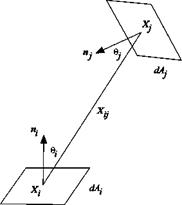
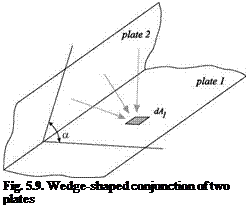
The self-illumination of PSP and TSP results from the luminescent contribution to a point on a surface from all visible neighboring points; it becomes appreciable near a conjuncture of two surfaces and on a concave surface (Ruyten 1997a, 1997b, 2001a; Ruyten and Fisher 2001; Le Sant 2001b). Although the self­illumination can be to certain extent suppressed by taking a ratio between a wind – on image and a wind-off image, it cannot be eliminated without considering an exchange of the radiative energy between neighboring surfaces, which may produce an error in data reduction of PSP and TSP. Therefore, we need to know how much the radiative energy leaves from an area element and travels toward another element. The geometric relations for this inter-surface process are known as view factors, configuration factors, shape factors, or angle factors (Modest 1993). We consider diffuse surfaces that absorb and emit diffusely, and also reflect the radiative energy diffusely. The view factor dFdA,_dAj between two

Correction for Self-Illumination Correction for Self-Illumination Подпись: (5.13)

infinitesimal surface elements dAt and dAj, as shown in Fig. 5.8, is defined as a ratio between the diffuse energy leaving dAt directly toward and intercepted by dAJ and the total diffuse energy leaving dAt, which is expressed as

where n; (or nj) is the unit normal vector of dAt (or dA,), X y is the position

vector directing from dAt toward dA,, and в (or в,) is the angle between the

position vector Xy and the normal nt (or nj). The view factors leaving dAt

directly toward the total surface A, or leaving A, toward dAt, or leaving A,

toward At can be similarly defined by integrating dFAi _Aj (Modest 1993). The

law of reciprocity dAidFd^_ dA, dFc^jis valid for these view factors. The

view factor is a function of the geometric parameters. Methods for evaluating the view factors were discussed by Modest (1993) and a large collection of the view factors for simple geometric configurations was complied by Howell (1982). For partially specular surfaces, the determination of the view factors is more complicated since the bidirectional reflectance distribution function (BRDF) of the paint must be known (Nicodemus et al. 1977; Asmail 1991).

Correction for Self-Illumination

Fig. 5.8. Radiative exchange between two surface elements


The self-illumination correction is applied to an image intensity (or brightness intensity) field denoted by I in this sub-section after it is mapped onto a model surface grid in the object space. Because the image intensity is proportional to the luminescent energy flow rate, the image intensity It at an area element dAt is a

Correction for Self-Illumination Подпись: (5.14)

sum of the local intrinsic intensity I{0> and an integration of the contributions from all the neighboring elements, i. e.,

where p’lP2 is the reflectivity of the wall-paint interface at the luminescent

Подпись: I<n+1> Correction for Self-Illumination Подпись: dA, Подпись: (5.15)

wavelength. In simulations, given a set of the intrinsic intensities I>, the image intensity It affected by the self-illumination can be obtained using a simple iteration scheme

Correction for Self-Illumination Подпись: (5.16)

The more efficient Gauss-Seidel iteration scheme was used by Ruyten and Fisher (2001). In measurements, since the image intensity It is known in PSP and TSP images, an explicit relation is used to correct the self-illumination and recover the intrinsic intensity I>, i. e.,

The steps for correcting the self-illumination are: (1) measuring the reflectivity p’W ; (2) defining a surface grid consisting of N surface elements dAt; (3)

evaluating the view factors dFdA._dA,; (4) mapping the image intensity It onto the

Подпись: Fig. 5.9. Wedge-shaped conjunction of two plates

surface grid; (5) calculating the intrinsic (corrected) intensity I(0> using Eq. (5.16); and (6) calculating a ratio of the intrinsic (self-illumination-corrected) intensities and converting it to pressure or temperature. Ruyten and Fisher (2001) conducted a numerical simulation of correcting the self-illumination for a PSP test of the Alpha jet and found that the error associated with the self-illumination in PSP measurements could reach several percents of actual pressure.

Here, we consider a simple but representative geometric configuration, a wedge-shaped conjunction of two infinitely large plates, as shown in Fig. 5.9; this case allows an analytical estimate of the error induced by the self-illumination. The image intensity at a location on the plate 1 is

Assuming that the image intensity at the plate 2 is homogenous, by integrating the view factor for this configuration (Modest 1993), we obtain the image intensity at the plate1 affected by the plate 2

11 « IT + e,12, (5.18)

where the parameter e, = pY2 (1 + cos a >/2 represents the combined effect of the

angle a between the plates and reflectivity. Clearly, the self-illumination decreases from the maximum value at a = 0o to zero at a = 180o. A reciprocal relation gives the image intensity at the plate 2

I2 – Ґ20> +8,1,. (5.19)

When the parameter є, is small, the image intensity ratio at the plate 1 is

Iiref/Ii – (IZ/I^HI + є, є2 >. (5.20)

The parameter є2 = I(20rf /1^ -1(20) /1(,0> reflects the difference of the relative

Correction for Self-Illumination Correction for Self-Illumination Подпись: (5.21)

influence of the plate 2 on the pate 1 between the wind-off reference and wind-on conditions. Using the Stern-Volmer relation for PSP, we obtain an estimate for the pressure error associated with the self-illumination for the wedge configuration

where A and B are the Stern-Volmer coefficients, and p(0) and p(°f> are,

Подпись: T - T(0)  T(0) Correction for Self-Illumination Подпись: (5.22)

respectively, the intrinsic PSP-derived pressures in the wind-on and wind-off reference conditions that are not affected by the self-illumination. Similarly, using the Arrhenius relation for TSP, we have an estimate for the temperature error associated with the self-illumination for the wedge configuration

where R is the universal gas constant, Enr is the activity energy of TSP, and

T(0) is the intrinsic TSP-derived temperature that is not affected by the self­illumination.

The above discussion is based on an assumption that the luminescent paint surface is a diffuse surface or Lambertian surface. Nevertheless, a real paint surface is neither Lambertian nor specular. To characterize reflection on a general surface, the bidirectional reflectance distribution function (BRDF) was introduced by Nicodemus et al. (1977). As shown in Fig. 5.10, the incident radiance is generally a function of the incident direction defined by the incident polar angle and azimuthal angle (ві, фі), i. e.,

Lt = Ц(в, ф). (5.23)

The reflection radiance Lr( ві, фі;вг, фг) is quantitatively characterized by the BRDF

Ыв^в’.ф,) = дЬг(в1,ф1;вг, фг)/дЕ1(в1,ф1). (5.24)

where (вг, фг) defines the direction of reflection and the infinitesimal incident irradiance dEt(ві, фі ) over a solid angle element dty is

dEt(ві, фі) = Lt(ві, фі )cos6idmi. (5.25)

The BRDF has a unit of steradian1. Here, the conventional radiometric notations L and E are used for radiance and irradiance, which are also applicable to the luminescent emission.

The BRDF depends on a surface roughness distribution. For a perfectly diffuse surface where the reflection radiance is isotropic, i. e., Lr = const., the BRDF is fr = 1/n (Horn and Sjoberg 1979). For a general surface, the BRDF can be derived based on either the wave equation for electromagnetic waves or geometrical optics models (Beckmann and Spizzichino 1963; Torrance and Sparrow 1967; Nayar et al. 1991). Asmail (1991) gave a bibliographical review on the BRDF. From a viewpoint of application, empirical expressions for the scattered radiance from a rough surface are very useful due to their simplicity (Cook and Torrance 1981; Haussecker 1999). An empirical model for a single light source is

Lr( X) = paEa( X ) + pd E, s (X)(NTLS) + Ps E s (X )p( RTV), (5.26)

where the first, second and third terms are, respectively, the contributions from the ambient reflection, diffuse reflection, and specular reflection. In Eq. (5.26), Pa, Pd, and Ps, are the empirical reflection coefficients for the ambient reflection, diffuse reflection, and specular reflection. As shown in Fig. 5.10, the vectors N, Ls, R, and V are, respectively, the unit normal vector of a surface, the unit vector directing the light source from the surface, the unit main directional vector of the specular reflection, and the unit viewing vector. Ea( X ) and E s( X ) are the irradiances for the ambient environment and light sources, respectively. The function p( RTV) is the directional distribution of the specular reflection, describing the spreading of scattered light. Phong (1975) gave a power function p( RTV ) = ( RTV )n. In general, the main directional vector of the specular reflection, R, is a function of the incident direction of light – Ls. Although there are certain theories for predicting the specular direction R (Torrance and Sparrow 1967), R is not known for a general surface. The unknowns in Eq. (5.26), such as R, the reflection coefficients, and the parameters in p( RTV), have to be determined experimentally by calibration.

Le Sant (2001b) measured the BRDF for the B1 PSP paint with talc using a BRDF calibration rig. As illustrated in Fig. 5.11, the BRDF calibration rig included a lamp for illumination and a spectrometer to measure the reflected light from a sample. The lamp emitted white light, enabling the calibration of the BRDF in the visible range; the lamp moved from 0o at the vertical position to 60o. The zenith (or polar) angle of the spectrometer moved from 0o to 60o and the azimuth angle moved from 0o to 180°, where 180° was in the opposite direction of the emission. Figure 5.12 shows the measured BRDF for the B1 paint, which was nearly Lambertian when the zenith (or polar) angle of illumination was 10°, while specular reflection occurred when the zenith angle increased further. The
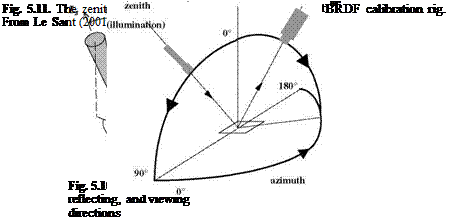
Correction for Self-Illumination

maximum value was always achieved in the specular direction. The low value obtained at the azimuth angle of 0° was incorrect since the spectrometer was in the front of the lamp and thus the PSP sample was no longer illuminated. The measured BRDF showed a superposition of diffuse reflection and specular reflection. A specular peak was observed at the zenith angle of 60° as well as a secondary peak at the azimuth angle of 90°. The value of the diffuse reflection factor depended on the zenith angle of illumination. Le Sant (2001b) was able achieve a good fit to the measured BRDF using the modified Phong model (Phong 1975), as shown in Fig. 5.13, and the modeled BRDF captured the main features of the measured BRDF except the secondary specular peaks.
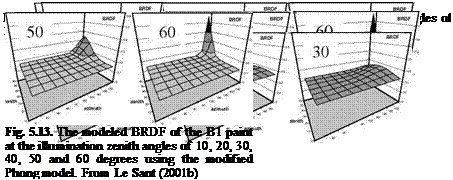
Correction for Self-Illumination
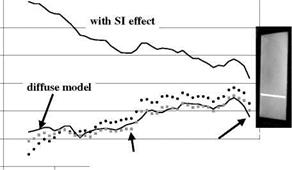
Le Sant (2001b) also studied the self-illumination in a corner to validate a correction algorithm. The corner was painted with a Pyrene-based paint providing an image significantly affected by the self-illumination near the junction of the two plates, as shown in Fig. 5.14. Then, the left plate was covered with a black sheet, removing the effect of the self-illumination on the right plate, as shown in
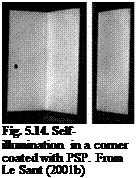
Подпись: Fig. 5.14. Self-illumination in a corner coated with PSP. From Le Sant (2001b)

the right image in Fig. 5.14. Figure 5.15 shows results before and after correcting the self-illumination based on the diffuse surface model and the Phong model. The self-illumination correction was effective; the self-illumination effect was reduced to 15% from about 40% near the junction. This paint behaved mostly like a diffuse paint such that the Phong model did not exhibit a significant improvement. Although the Phong model might improve the accuracy of correction for a surface with strong specular reflection, the computation time for the Phong model was much longer than that for the diffuse surface model.

Подпись:Подпись:Подпись: 40 X (mm) 50Подпись:Подпись:Correction for Self-IlluminationPhong model

10 20 30

Radiometric Calibration of Camera

Since PSP and TSP are based on radiometric measurements, a CCD camera used for measurements should have a good linear response of the electrical output to the scene radiance. However, there are many stages of image acquisition that may introduce non-linearity; for example, video cameras often include some form of ‘gamma’ mapping. When the radiometric response function of a camera is known, the non-linearity can be corrected. Here, a simple algorithm is described to determine the radiometric response function of a camera from a scene image taken in different exposures. First, we define I( x) as a linear radiometric response to the scene radiance and m[I( x)] as the measurement of I( x) by camera electronic circuitry that may produce a non-linear electrical output. Actually, the measurement m[I( x)] is the brightness or gray level of an image, where x is the image coordinates. The non-dimensional response function relating I( x ) to m[ I( x )] is defined by

I( X )/Im«x = f[fa( X )]

Подпись: (5.8)where fa( x) = m[I( x)] / m( Imax ) is the non-dimensional measurement of I( x) normalized by the maximum value and Imax corresponds to the maximum radiance in the scene. Recovery of f (fa) is the task of the radiometric calibration of a camera.

Two images of a scene are taken in two different exposures. According to the camera formula (Holst 1998), I( x) is proportional to the integration time tINT and inversely proportional to the square of the f-number F. Thus, we have the following functional equation for f (fa),

f fa )/f(fa2) = R12, (5.9)

Подпись: R
Подпись: 12 Подпись: I mox2 ( t INT / F )1 Imax1 ( tINT / F )2 Подпись: (5.10)

where the subscripts 1 and 2 denote the image 1 and image 2, and the factor R12 is defined as

Since m( Imax) corresponds to Imax, the boundary condition for f (fa) is f (fa = 1) = 1. We assume that f (fa) can be expanded as

f (fa)= X cjn(fa), (5.11)

n=0

where the base functions <j)n(fa) are the Chebyshev functions although other orthogonal functions and non-orthogonal functions like polynomials can also be used. Substitution of Eq. (5.11) to Eq. (5.9) leads to the following equations for the coefficients cn

S Cn[^>n(fa1) – R12 Фп ( fa2 )] = 0 ,

n=0

Подпись: (5.12)X СпФп(1) = 1

n=0

Radiometric Calibration of Camera

For selected M pixels in a scene image, Eq. (5.12) constitutes a system of M+1 equations for the N+1 unknowns cn (M > N ). For a given R12, a least-squares solution for cn can be found. In practice, since the factor R12 is not exactly known a priori, we use an approximate value of R12

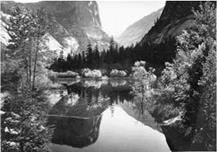
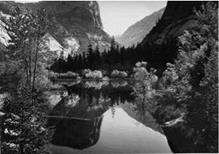
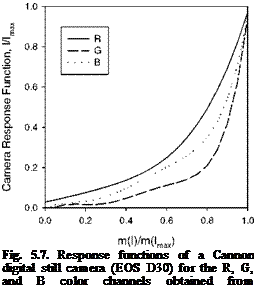
An iteration scheme can be used to give an improved value of R12. Figure 5.6 shows two images taken by a Cannon digital still camera (EOS D30) at two

Radiometric Calibration of Camera Radiometric Calibration of Camera

different f-numbers of F = 4.0 and F = 5.6, where Ansel Adams’ photograph of Mirror Lake of Yosemite was used as a test scene providing a broad range of the gray levels for radiometric calibration. Figure 5.7 shows the radiometric response function of the camera retrieved from the two images, where six terms of the Chebyshev functions in Eq. (5.11) were used. The response function of the Cannon digital still camera exhibits a non-linear behavior; it is also different for the red, green and blue (RGB) color channels.

Подпись: Fig. 5.7. Response functions of a Cannon digital still camera (EOS D30) for the R, G, and B color channels obtained from radiometric calibration

Fig. 5.6. Two images of Mirror Lake of Yosemite (Ansel Adams 1935) taken by a Cannon digital still camera (EOS D30) at different F-numbers (a) F = 4.0 and (b) F = 5.6 for radiometric calibration of the camera