Category The Aerodynamic Design of Aircraft

Separation effects

4.6 We have noted already (in Sections 4.3 and 4.4) that the theoretical treatment of the regions near the wing tips is generally rather poor: neither of the assumptions (4.51) nor (4.64) can really be justified

in those regions, whether the wing is swept or not, and the cbordwise load­ings cannot really be expected to be like those on twodimensional aerofoils when the wing is unswept, or like those at a central kink when the wing is swept. Some improvement in the treatment of the tip regions of thick lifting wings with curved leading edges has been provided by H C Garner (1972). But there remain mathematical problems which have been discussed by К Stewartson

(1960) and by M van Dyke (1963). The problem has been treated in some detail by M Landahl (1968) for rectangular wing tips and by P F Jordan (1970) and

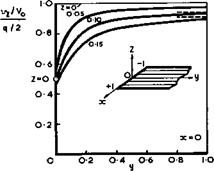
(1971) for parabolic tips (that is, planform shapes which can be approximated by a circle at the tip), making use of the solution for the lifting circular wing by W Kinner (1937). In both cases, departures from the classical solu­tion were found and, in particular, the existence of a logarithmically – infinite upwash directly behind the wing tip. One line of thought could then be that this singularity should be, and could be, removed by an intense rolling – up of the free edge of the trailing vortex sheet. Steps in this direction have been made as long ago as 1932 by A Betz, by F L Westwater (1936), and again recently by D J Butter & G J Hancock (1971). In the simplest model, the continuous sheet is replaced by a finite number of line vortices, but this may lead to unreliable results, as shown by D W Moore (1971).

We note at this point that a flow model which includes a rolled-up vortex core will produce not only swirling velocities and hence a downwash on the wing but

also an axial velocity along the vortex core. This has been predicted by G К Batchelor (1964) and confirmed in comprehensive laboratory experiments by J H Olsen (1971). D W Moore & P G Saffman (1973) calculated in some detail the structure of laminar trailing vortices with an outer inviscid core and an inner viscous core. They found that the perturbation of the axial velocity in the viscous core can be either away from the wing or towards the wing, depending on the load distribution near the tip of the wing. For elliptic loading, the perturbation is towards the wing.

With a view to determining the effect of the trailing vortex sheet on the loading over the wing, В Maskew (1971) and T E Labrujere & H A Sytsma (1972) have extended their panel methods to take account of the rolling-up by an iterative procedure: the straight vortex filaments in the classical model are

replaced by small linear segments and the position and direction of these seg­ments are then progressively adjusted until they are aligned with the stream­lines of the mean motion. The results showed that the change in shape had little effect on the pressure distribution over the wing and thus left the mathematical problem unresolved. Perhaps the panel representation is too crude to bring such details into focus, or the classical model is quite adequate after all.

In reality, it is not this mathematical problem but a deficiency in the physics of the flow model, which requires attention. This concerns the actual position of the separation line: there is no reason to suppose that the flow

separates only from the trailing edge when the wing is put at an angle of incidence; the separation line can easily extend around the tip edge and creep up along it, especially if the edge is streamwise, as discussed in Section 3.3. The flow around the tip edge is then like that shown in Fig. 3.5(a) or, in an extreme case, like that sketched in Fig. 2.16. An ordinary separation line must be expected to be formed at a high-enough angle of inci­dence, depending on the detail of the shape of the wing tip. The trailing vortex sheet is then non-^planar, with near-vertical extensions at both tips. That such tip vortex sheets exist in a real flow was seen very early and clearly in observations by L Bairstow (1915)*) and by A Fage & L F G Simmons,

(1925) , but it was only in 1939 that A Betz proposed that tip vortex sheets should be taken into account in wing theory. The concept was then applied by К Mangier (1939). It is now clear that they matter in the tip region of wings of any aspect ratio and that they play an increasingly dominant part in the properties of wings as the aspect ratio is decreased. Thus the theories des­cribed in Section 4.3 are incomplete, to say the least.

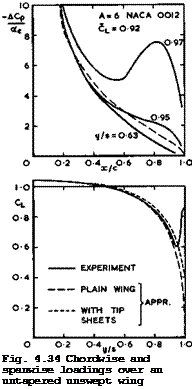
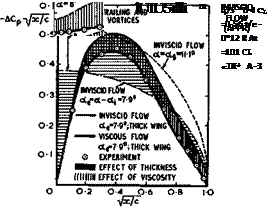
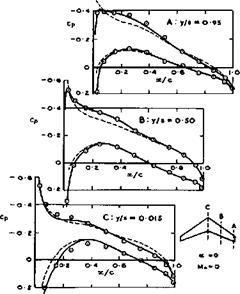
What really happens near the wing tips can be seen from experimental results in Fig. 4.34 for the simple case of a rectangular wing of relatively high aspect ratio. The chordwise loading shows a large increase over the rear as the tip is approached, beyond that of the twodimensional section (dashed line) and the spanwise loading shows a second peak in the immediate neighbourhood of the tip, again with lift added to that calculated for the plain wing (dashed line). These additional loadings are consistent with a flow model where a vortex sheet springs from a separation line along the tip edge, rolls up along its free edge at the top, and joins the vortex sheet from the trailing edge; the velocities induced by such a sheet must produce additional suction press­ures on the top surface of the wing just inboard of the tip. Along the tip

*see F W Lanchester (1915). Bairstow used flow pictures taken in a water tunnel for a square wing with strong tip vortex sheets in his (mistaken but very successful) attempt to discredit Lanchester’s theory of the classical wing.

Separation effects

163

Подпись:
edge itself, the load falls to zero, i. e. the Kutta condition is fulfilled there.

There is as yet no adequate theory which is based on such a model of the flow. What exists is a numerical study by C Rehbach (1971) , which is based on a method by S M Belotserkovskii (1968); in this, the wing is represented by a vortex lattice and thus the trailing and tip vortex sheets by a series of dis­crete line vortices. This gives qualitatively plausible answers, but the rolling-up into cores cannot be adequately represented by isolated line vor­tices and the Kutta condition cannot be fulfilled. J Rom, H Portnoy &

Подпись: h Подпись: letcT , Подпись: or h/s = a/A Подпись: (4.111)

C Zorea (1974) have also investigated the formation of wing-tip vortices, and J H В Smith (1975) has given a review of various theoretical attempts. Another theory by D KUchemann (1955) is based on Betz’s simplified model where the tip vortex sheets are assumed to be plane vertical surfaces. With the shape of the tip vortex sheets fixed in this way, the conditions that the free vortex sheet is a streamsurface and that it carries no pressure difference across it cannot be fulfilled, nor can the Kutta condition. But it may at least be assumed that the vorticity vector in the sheet lies, in some sense, in a "mean-flow" direction, namely, halfway between the direction of the mainstream and that of the tip chord inclined at an angle a, i. e. the vorticity vector is inclined at the angle a/2 to the mainstream. The height of the vortex sheet at the trailing edge is then

Separation effects

on rectangular wings, if the separation line along the tip edge of chord Cj starts at the leading edge. A further simplification is achieved by the assum­ption that the non-planar vortex sheet is such that the induced downwash ct£ is constant along the span and the vortex drag a minimum. The spanwise load­ing can then be determined from the flow in the Trefftz plane, as discussed in Section 3.2, assuming in addition that the shape of the trailing vortex sheet in the Trefftz plane is the same as that at the trailing edge. In fact, the procedure is the same as for a wing with solid endplates, for which this kind of theory has been developed by D Kiichemann & D J Kettle (1951) and J Weber (1954). This theory gives only the spanwise loading and the overall lift and drag.

When applied to wings of any aspect ratio with tip vortex sheets and combined with the RAE Standard Method, this approach leads to a non-linear variation of the lift with the angle of incidence because the height of the tip vortex sheet and hence the additional lift varies with a, by (4.111). Very simple relations obtain in the limiting case of rectangular wings of very small as­pect ratio. The flow is then like that sketched in Fig. 2.16, but we must assume here that the flow remains steady and symmetrical about the longitudi­nal axis and that asymmetric vortex shedding does not occur. The change of the overall vortex drag and of the induced angle of incidence» from those given by (3.22) and (4.70) for the plain wing according to linearised theory, to those for the wing with tip vortex sheets, can be expressed by applying a factor Kv(h/s) < 1 to both these values, as in (3.38). (We cannot really

expect that the relation for the drag applies fully on wings with tip vortex sheets, whereas it might on wings with solid endplates where a sideforce acts on the endplate and a suction force on its leading edge). Since a

when A -*■ 0 , we have,

Подпись: (4.112)7Г ir A

°L 2 KV “

The function Kv(h/s.) has been calculated by К Mangier (1939); it can be approximated by (3.39), so that

or

CL = -j Act + j a2 , (4.113)

using (4.111). This brings out clearly the non-linear lift increase above that obtained from linearised theory (first term in (4.113)). It also suggests that the linear term in (4.113) can be replaced by that from the linearised theory for wings of any aspect ratio. A theory on these lines has been developed by D KUchemann (1955) and (1956).

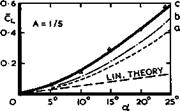
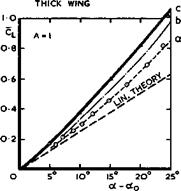
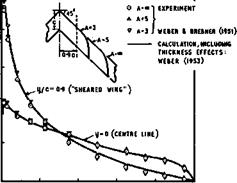
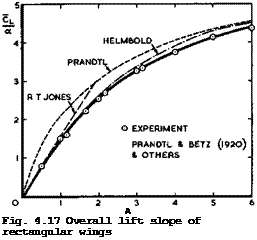
This theory has been applied to the cases shown in Fig. 4.34 and in curves (a) of Fig. 4.35. The spanwise loading then has a non-zero value at the wing tip, corresponding to the sideload on an actual endplate. But it will be seen that this theory does not reproduce the typical features of the actual loading. At best it can provide some estimate for the overall lift. This can be quite adequate if the flow separates only from the trailing and side edges and not also from the leading edge. It may be assumed that these con­ditions are realised in the tests of L Prandtl and A Betz (1920) in Fig. 4.35.

Properties of Classical and Swept Aircraft

When the flow separates also from the leading edge, as in the tests on thin flat plates carried out by 0 Flachsbart (1932), the theoretical model is ob­viously not adequate and the non-linear effects are even larger. The tip vor-

Separation effects

Л EXP. FLACHSBART (1932) THIN PLATE

© EXP. PRANDTL-BETZ (1920)

Separation effects

Fig. 4.35 Overall lift of rectangular wings of small aspect ratio

tex sheets can then be expected to be higher to begin with and then to grow more slowly with a . Therefore, J Weber (1955, unpublished) has proposed to use the relation

h/s “YcTVA (4.114)

instead of (4.111), which leads to

CL = I A a + a3/2 (4.115)

and curve (c) in Fig. 4.35. This fits Flachsbart’s experiments better.

A non-linear theory for wings of small aspect ratio with separation from all edges has been provided by W Bollay (1939). For the limiting case A -»* 0, this can be interpreted as representing a wing with a large bubble in its wake, extending to infinity (see D KUchemann (1956)). There is a secondary flow inside the bubble, which can again be thought of as being generated by plane vertical vortex sheets from the side edges, with the vorticity vector inclined at an angle ot/2 to the mainstream. The boundary condition is, as usual, that the wing together with the bubble should turn the mainstream through an angle a at the wing. In this model, to a first order, only the mass of air in front of the wing bounded by the two planes у = * s is turned; all the air outside these planes passes the wing by and remains undeflected. The lift
is then uniformly distributed over the wing and the lift coefficient is given by

CL = 2 sin2ct. (4.116)

As it happens, this is the same relation as that obtained from Newton’s model of a flow where the motion of the air particles is considered and assumed to be unaffected by a body until the particles hit it. The particles are then reflected from the surface without change of kinetic energy, and the pressure on the surface results from the rate of loss of normal momentum of the fluid on reflection. Newton’s relation is often considered to apply at hypersonic speeds, whereas it turns up here as an approximation for particular wings in incompressible flow for a model which has only some slight physical similari­ties with that of Newton. Values from (4.116) are shown as curves (b) in Fig. 4.35; they do not quite give a satisfactory approximation.

The relation (4.116) has also been derived by A Betz (1935) from yet another model of the flow. It applies in cases where separation also occurs along the leading edge, so that it may be assumed that the suction force there dis­appears and that CT ■» 0 in (3.29). In that case, the resultant air force in inviscid flow is normal to the wing surface and

L/D = 1/ tan a (4.117)

(see also Fig. 4.14). If the aspect ratio is very small, the resultant air force may be regarded as a cross flow drag of a twodimensional flat plate in a stream of velocity Vq sin a at right angles to it, with a crossflow drag co­efficient Cdc . Thus the resultant air force normal to the wing is

Separation effects Подпись: (4.118)

R я CDc s ІР VQ2 sin2<x

Betz suggested that = 2 would be an adequate approximation, and this

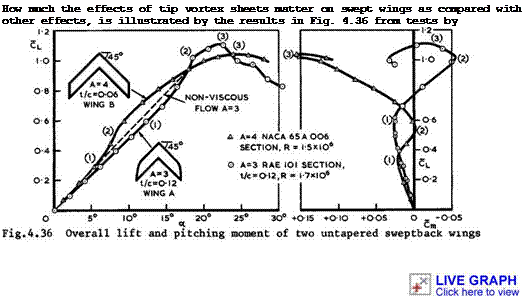
Подпись: How much the effects of tip vortex sheets matter on swept wings as compared with other effects, is illustrated by the results in Fig. 4.36 from tests by

leads again to (4.116) for small a. The results in Fig. 4.35 indicate that Cqc could be somewhat greater than 2.

J F Cahill ASM Gottlieb (1950) and by J Weber & G G Brebner (1951) on two wing of 45° sweepback. The main difference between the wings lies in the thickness-to-chord ratio of their sections and in their tip shapes. The two wings have much the same lift slope in inviscid flow, and the departure from that in the experiments, up to points (1), can be attributed to viscosity ef­fects, as discussed in Section 4.5. The regime from (1) to (2) is dominated by the appearance of tip vortex sheets, leading to a non-linear increase in lift and an increasingly nose-down pitching moment, since the additional non­linear load acts near the tips in a rearward position. That these effects can, in fact, be explained entirely by the presence of tip vortex sheets has been shown for the thicker wing by D Kftchemann & D J Kettle (1951) . From points

(2) onwards, some flew separation occurs inboard of the tips and moves inwards. The separation line may run along the leading edge, causing a gradual loss of lift over the outer rear parts of the wing and hence an increasingly nose-up pitching moment. Part-span vorticity is then shed from the wing (see D KUche – mann (1953)). It is often in the middle of this process that the maximum value of the lift is reached at points (3). This does not mark the onset of a new type of flow and cannot be regarded as "stalling" in the conventional sense. Thus we find large differences between the properties of two rather similar wings, all caused by non-linear effects.

There is a simple extension of Multhopp’s theory to deal with spanwise loadings over wings with part-span separations by an iterative process, provided the appropriate sectional relationship between and ae is known (H Multhopp

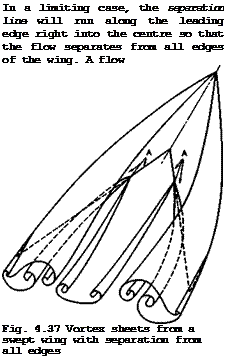
Подпись: In a limiting case, the separation line will run along the leading edge right into the centre so that the flow separates from all edges of the wing. A flow Fig. 4.37 Vortex sheets from a swept wing with separation from all edges

(1938); see also В Thwaites (I960), Section XII.10). This may give useful answers for unswept wings but it cannot be expected to work well for swept wings. Therefore, we do not have a good theory for this important flow regime on swept wings.

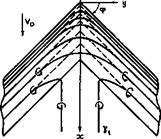
pattern which has been observed by R L Maltby (1962, unpublished) and which involves only vortex sheets is sketched in Fig. 4.37. It is complicated by

the fact that the attachment lines (A) on the wing, which divide the air which is drawn into the rolled-up cores of the vortex sheets issuing from the lea edges from the air which is not and which flows predominantly rearwards, must intersect the trailing edges. Different flow directions on either side of the intersection points then out and split up the vortex sheet from the trailing edge, and the free edges thus generated roll up into new cores. This type of flow is far beyond any available means for calculating it; it is also undesirable in practical applications since forces and moments on such a wing (and on a tailplane behind it) are liable to change with attitude in a drastic and uncontrollable manner.

Properties of Classical and Swept Aircraft

selves felt. This can be seen from the results in Fig. A.31 for the sectional lift slope of sections near mid-semispan of two sweptback wings: the fall – off with is much steeper although, for some reason which we still do not

Properties of Classical and Swept Aircraft

understand, the values in the limit Cl •+■ 0 appear to be much the same for all angles of sweep. But then this need not apply in other cases, e. g. at different Reynolds numbers or when the aerofoil shapes are less simple.

Подпись:VISCOUS FLOW
(EXP)

Подпись: 1-5 20Подпись: Fig. 4,32 Chordwise and spanwise loadings over untapered wings of 45° sweep- back. After Weber & Brebner (1951)Properties of Classical and Swept Aircraft0-2

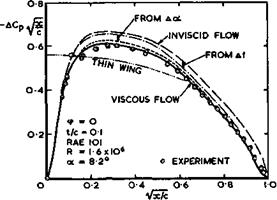
Typical experimental results for the ahondwise loading over a section near mid-semispan of a sweptback wing and for the spanwise loading over a sweptback wing of large aspect ratio are shown in Fig. 4.32, where the results in the top figure are to be compared with those in Fig. 4.29 for a similar aerofoil section in twodimensional flow. The sequence of effects to be estimated now starts with the loading over a thin aerofoil in twodimensional inviscid flow (dotted line) and then proceeds to take account of the effects of the trailing and streamwise vortices (chain-dotted line), the wing thickness (thin line), and lastly the boundary layer and wake (full line). All these effects can be estimated individually, as described above (in this case, as well as in Fig.

4.33, measured boundary-layer data have been used). If the factor к from Fig. 4.31 is known, then it can be applied to the sectional lift slope a in (4.62) or (4.104) and the spanwise loading can be calculated from (4.56) or (4.81). Threedimensional centre and tip effects then become apparent also in the viscous flow. In the lower part of Fig. 4.32, the dashed lines have been calculated for inviscid flow and the full lines for viscous flow, whereas the

Next Page

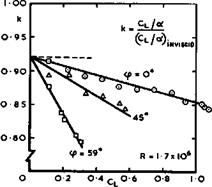
circles give experimental results. We can see how the lift reductions due to viscous effects increase with the angle of incidence and with spanwise distance from the centre. The viscous effects are large at the relatively low Reynolds number of these tests (R = 1.7 x 10^) and can be expected to be less at higher Reynolds numbers. It is thought to be a useful attribute of the RAE Standard Method that it can readily identify all these different effects in their character and magnitude. A single overall answer cannot be so instruc­tive. This will be demonstrated again in the next example.

Properties of Classical and Swept Aircraft

Fig. A.33 Distribution of various contributions to the form drag along the

span of a sweptback wing

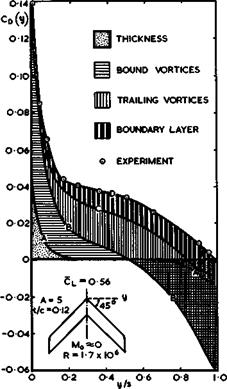
To put the various threedimensional effects of sweep and viscosity into per­spective, Fig. 4.33 has been drawn to show the elements that make up the pres­sure drag and their distribution along the span. Curve (A) is the drag (and thrust) due to thickness calculated according to (4.89) and (4.90), which varies with p(y) from (4.91) along the span. The addition to it of the drag and thrust due to lift, i. e. due to the bound vortices, gives curve (B), which is equal to C. ae at the centre (because Gj = 0 there) and varies with X(y) from (4.107) along the span, as explained in Section 4.4. Curve (B) holds for inviscid flow and its integral along the span is zero. A non-zero drag force arises from curve (C) when the vortex drag C^a^(y) is added, as calculated from (4.56) or (4.81). This corresponds to a vortex drag factor Ky = 1.16, as defined by (3.42). Finally, the pressure drag due to viscosity is added in the simple form C^ Aot(y) to give curve (D), where Да is the effective

Previous Page

overall reduction of the angle of incidence calculated from the measured boun­dary layer. This increases the overall drag by ACD = 0.011 in this particul­ar case and leads to an overall drag of Cq – 0.035 and a drag factor as large as Ky – 1.72. In the experiment, only values corresponding to the final curvev(D) could be measured (circles). We find that the theoretical concepts describe the actual situation quite well. It seems that we have gained a fair understanding of the flow and thought out reasonable flow models to describe the various effects: the difficulties now lie in obtaining adequate numerical and experimental answers which the designer can use.

Both curves (C) and (D) in Fig. 4.33 represent real drags, one associated with the vortex flow in the Trefftz plane and the other with the momentum change in the wake. Both these drag elements are roughly proportional to and, the­

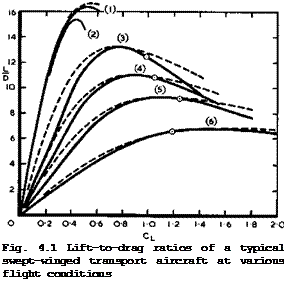
refore, difficult to separate if the drag is determined experimentally. They must be separated in any meaningful drag analysis, especially since the vis­cous drag depends strongly on the Reynolds number and is likely to be smaller at full scale, as can be seen from the results in Fig. 4.1, where the values of the drag factor Ky include both the vortex drag and some viscous pressure drag. The method of E C Maskell (1972), described in Section 3.2, sets out to separate these drag components. 4

It should be clear from Fig. 4.33 how precarious the balanee is between the various flow elements on a swept wing, with the strong local centre and tip effects dominating the picture and counteracting one another. One could say that Uature abhors sweep, in view of the large forces trying to pull the cen­tre back and the tips forward and to undo sweep. No wonder, therefore, that the essence of the design of swept wings, to be discussed in Chapter 5, is to find means to deceive Nature and to achieve flows which would not occur natur­ally.

Viscosity effects

4.5 We have already noted many times, especially in Sec­tion 2.4, what a vital part is played by the effects of viscosity and by vis­cous interactions in the flows which interest us in aircraft design, even if the flows remain attached to the surface of the wing up to the trailing edge. Therefore, no theory for determining the properties of classical and swept wings is complete if it cannot take proper account of the effects of viscosity. In this Section, we want to discuss briefly what the main effects are and indicate how far they may be predicted. We shall be concerned throughout with rather rough approximations since solutions of the complete Navier-Stokes equations for. compressible flows are not yet available for our design purposes.

We consider flows where the viscous region may be thought of as a thin boun­dary layer near the wing surface and as a thin wake downstream of the wing.

In the first place, this implies that skin-friction forces act along the sur­face of the wing, which have a counterpart in a loss of momentum in the wake far behind the wing. Further, on a lifting wing, the streamlines in the re­gion of the trailing edge must be inclined to the direction of the mainstream and thus the wake will be curved as it turns back into the mainstream direc­tion. This curvature implies that there is a circulation in the viscous wake, i. e. a vorticity component across the mainstream, in addition to the stream – wise vorticity component (see e. g. G I Taylor (1925), G Temple (1943), and J H Preston (1949) and (1954)). This circulation must be taken into account when the lift is derived from Trefftz-plane considerations and, since it is usually negative, the actual lift is less when the wake is included than when it is ignored. Lastly, the boundary layer displaces the streamlines in the external inviscid flow outwards away from the body, as already discussed in Section 2.1, and the pressure along the surface of the given wing may be taken to be the same as that in a hypothetical inviscid flow along the displacement surface, obtained by adding the displacement thickness of the boundary layer and of the wake of the wing, as explained by M J Lighthill (1958) and К Gersten (1974). This has the effect of changing the pressure distribution over the wing surface everywhere from that calculated for an inviscid flow.

What are needed by the designer are methods for estimating all these effects, which are rapid, accurate and adaptable, and which can be regarded as routine tools. In particular, it should be possible to assess the effects of small changes in the wing shape and also to work out the properties of threedimen­sional wings at full-scale Reynolds numbers. We shall find that we are still far from having reached such a position.

In view of the complexity of the problem, we are more than ever interested in making simplifying assumptions. Boundary-layer assumptions may be made in the estimation of some of the effects. But boundary-layer methods use con­cepts which are essentially associated with flows past flat plates, and there are several regions in the flows past wings where the flow differs signifi­cantly from that along a flat plate, and where at least higher-order approxi­mations should be considered. One such region is that near the leading edge where the flow is highly curved. Here, fortunately, J C Cooke (1966) could show that the curvature effects may justifiably be ignored in most practical cases. In this work, second-order terms were taken into account and Cooke found that, on convex surfaces, the skin friction is reduced and the displace­ment thickness increased, as compared with first-order solutions. Cooke’s method is of special interest in that the displacement surface is supposed known and the body surface determined by working inwards. This method has been used by D Catherall & К W Mangier (1963), and it may have further applica­tions in wing design.

Matters are different in the region near the trailing edge, including the near­wake. The flow is very complex and cannot be properly described by standard boundary-layer concepts even in the case of a flat plate with a trailing edge (see К Stewartson (1968) and (1969), N Riley & К Stewartson (1969)). In the case of lifting wings with non-zero trailing-edge angles, the curved flow is even more complicated, and changes of the pressure through the boundary layer and the near-wake are an essential feature, not only in viscous flows but also already in an inviscid, rotational model of the flow (see Section 2.4, Fig.2.3X Thus the Kutta condition, however useful in inviscid flows, is inadequate and ill-defined in viscous flows, especially in three dimensions, but we do not yet know with any certainty what to replace it by. In principle, it should be replaced by a suitable condition applied at all points along the boundary representing the wake. But this has not yet been worked out and incorporated in any method, and this renders the determination of the pressures at and near the trailing edge and of the circulation rather uncertain. It would be well worthwhile if someone would turn his attention to this fundamental problem rather than producing yet another panel or relaxation method.

To estimate the effects of boundary layers, we must calculate them first. There is a vast number of particular methods for calculating the development of boundary layers, accumulated over more than 70 years of intensive research (see e. g. the textbooks by H Schlichting (1960), L Rosenhead (1963), and A Walz (1966)). Here, we are interested in methods which can deal with three­dimensional flows. L Prandtl (1945) and W R Sears (1948) and (1954) were the first to provide methods for infinite sheared wings, exploiting the similarity characteristics inherent in this particular curved flow. More general methods followed (see e. g. N Rott & L F Crabtree (1952), J C Cooke & M G Hall (1960),

R C Lock (1967), J C Cooke & J H Norbury (1967), В G J Thompson et al. (1973),

E H Hirschel (1973), J A Beasley (1974), M T Hill & H-J Wirz (1974)), and lami­nar threedimensional boundary layers can now be calculated with some accuracy (see e. g. E Krause (1969) and (1973), E Krause et al. (1969), P Bradshaw

(1971) , N A Jaffe & A M 0 Smith (1972), E A Eichelbrenner (1973)), provided the external flowfield is well-defined and known. Some of these methods con­tain empirical elements and apply also to turbulent flows.

In recent years, numerical solutions of the Navier-Stokes equations for vis­cous compressible flows have been computed. A review of this work ahd a use­ful list of the flows treated so far have been provided by R Peyret & H Viviand (1975).

The next step is to determine where and how transition from the laminar to the turbulent state occurs. On threedimensional swept wings, there are now six known mechanisms which may bring about transition and several of these may operate simultaneously (see e. g. M G Hall (1971)). These have recently been reviewed by D A Treadgold & J A Beasley (1973) and by E H Hirschel (1973) and applied to several typical cases of infinite sheared wings with different sec­tion shapes, with rather alarming results: it turned out that it is very dif­ficult to predict which of the various mechanisms is likely to dominate, for any given shape and Reynolds number, and uncertainties were revealed which are far too great for engineering purposes; to narrow them down needs much fur­ther work. The results also indicate that the flow itself can be so sensitive that it depends on the fine detail of the pressure distribution and of the wing shape so that the demands on the accuracy of any theory are very high. As a consequence, present estimates of the transitional flow regime on swept wings, and the input into any calculation of the development of the turbulent bound­ary layer and especially its initial conditions, must be regarded as poor and unreliable.

Of the many methods for calculating turbulent boundary layers, we mention only a few more recent methods which have proved useful in practical applications:

J C Rotta (1962) , D В Spalding & S W Chi (1964), N A Cumpsty & M R Head (1967), M R Head & V C Patel (1969), R Michel et al. (1969), H Femholz (1969),

P Bradshaw & D H Ferris (1971), P Wesseling & J P F Lindhout (1971), J E Green

(1968) , J E Green et al. (1972), P D Smith (1972), E Krause (1973), and the extensive text about twodimensional and axisymmetric turbulent boundary layers by T Cebeci & A M 0 Smith (1975). Existing methods have been assessed by

5 J Kline et at. (1968) for two dimensions, and by L F East (1975) for three. The methods are generally of one of two forms: finite-difference methods in which the governing partial differential equations are solved numerically; and integral methods in which the partial differential equations are reduced, by an integration in the direction normal to the surface, either to a set of ordin­ary differential equations, if the flow is twodimensional, or, if the flow is threedimensional, to a set of partial differential equations involving only two independent variables. Both forms involve considerable empiricism to ren­der the equations determinate. For the predictions of threedimensional boun­dary layers, which interest us here, streamline coordinates are often used, which consist of two families of mutually orthogonal curves on the surface of the body. One family is formed by the projections onto the surface of the curved streamlines just outside the boundary layer. The direction of such an external streamline is called the streanwise direction, and the crossflow is then normal to an external streamline and parallel to the surface. An essen­tial assumption in many of these methods is that the streamwise flow is simi­lar to that of a corresponding twodimensional boundary layer, which is suppor­ted by some experimental evidence. But the streamline coordinate system is inconvenient for practical purposes since it changes with the general flow conditions over the wing, and a curvilinear coordinate system fixed in the wing surface is more useful, even though it will, in general, be non-orthogo­nal. Now D F Myring (1970) has shown that the observed similarities with two­dimensional flows can be exploited even when a coordinate system is adopted which is not based on external streamlines, and P D Smith (1972) has subse­quently provided a numerical method which is flexible and well-adapted to prac­tical needs.

Because all these methods involve a strong empirical element, it is important to have good experimental evidence for relevant flows. Although this is well recognised, there is, nevertheless, a dearth of reliable and complete data and we can refer here only to a few sets of measurements: by G G Brebner & J A Bagley (1952) and T A Cook (1971) on twodimensional aerofoils; by G G Brebner (1950), (1954), and (1960), В van den Berg & A Elsenaar (1972), К G Winter &

J В Moss (1974), and В van den Berg et at. (1975) on swept wings; and by M G Hall A H В Dickens (1966), К G Winter, J C Rotta & К G Smith (1968), L F East

6 R P Hoxey (1969) on more specific threedimensional flows. Most of these measurements are not quite complete enough to give all the data needed to check all the assumptions made in the various theories and these, therefore, remain tentative to some degree.

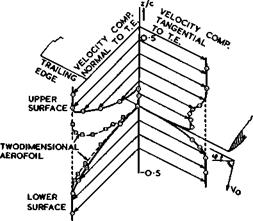
There are some general characteristics of thT^eedimensionat boundary layers over swept wings which follow from the pattern of curved streamlines sketched in Fig. 4.6. Physically, it is the transverse pressure gradient in the external stream which produces the secondary crossflow in the boundary layer: the reduction in velocity in approaching the surface results in a decrease in the centrifugal force which, outside the boundary layer, is in equilibrium with the transverse pressure gradient. Since the static pressure remains approximately constant through the boundary layer, the curvature of the stream­lines in the boundary layer must be increased as the wall is approached and the velocity reduced, to restore the centrifugal force to its required value (see also Fig. 2.5). This causes a transport of fluid towards the concave side of the external streamlines. The similarity of the velocity profiles to those in twodimensional flow, which has been mentioned above, strictly applies only to laminar boundary layers along the developable surfaces of sheared wings of infinite span. The boundary layer equations then reduce to a simple form where the solution for the velocity components in planes normal to the direction of sweep is the same as in the corresponding twodimensional case, so that a solution for the spanwise velocity component can be obtained inde­pendently by substituting the known solution for the normal components. This has been called the independence principle by R T Jones (1947). It cannot strictly apply either to turbulent boundary layers or to threedimensional wings. On a sweptback wing, the curvature of the streamlines and with it the crossflow will build up gradually away from the centreline, and the thickness due to crossflow will increase towards the tips. Thus, here again, there is a centre effect in that the rate of build-up of the crossflow (with y) is large in the central region and then becomes more gradual where sheared-wing conditions apply. The direction of the velocity vector will always reach the largest deflection from the mainstream direction at the limiting stream­lines in the wing surface. Another limit is reached when the limiting stream­lines in the surface are turned completely into the spanwise direction. As has been discussed in connection with Fig. 2.5, this may be interpreted as a separation of the flow component normal to the direction of sweep. In such a flow, the independence principle cannot possibly hold and there need be no similarity to any twodimensional flow. The separation line may be an ordinary separation line and lead to the formation of a vortex sheet extending into the external inviscid stream (see Fig. 2.7). Alternatively, the separation streamsurface may stay immersed in the viscous region. Where a bubble with

Viscosity effects

Fig. 4.27 Boundary-layer profiles at the trailing edge of a wing with 45° sweepback. After Brebner (1954)

an initial reversed flow behind the separation line might have been formed in a twodimensional flow, with subsequent reattachment to the surface, such a would-be bubble on a swept wing might be "filled in" immediately by air flow­ing sideways into it from parts of the wing further inboard and upstream. The flow does not then reattach to the surface but to a sublayer with predominantly

spanwise flow. Velocity profiles may then look like those in Fig. 4.27, as measured by G G Brebner (1954), with a nearly uniform sublayer of spanwise outflow underneath another layer which does not appreciably differ from that on a twodimensional aerofoil with a comparable pressure distribution. More intense turbulent mixing might efface the features so sharply displayed in Fig. 4.27 and lead to more blurred velocity profiles. It can then be expected that the actual flow will depend strongly on the Reynolds number as well as on the lift coefficient and the angle of sweep. Generally, the thickening of the boundary layer through outflow, with all its consequences, must be expect­ed to increase towards the wing tips and with increasing and angle of

sweep. This will be confirmed below.

The first important effect caused by the existence of the boundary layer is a drag force, which is to be added to the vortex drag and is often referred to as profile drag (for a detailed derivation of this drag force see e. g. В Thwaites (1960) and W J Duncan, A S Thom & A D Young (1970); see also Section 3.2). This consists of two parts: the skin-friction drag which can be deter­mined directly from the boundary layer, once its development along the sur­face has been calculated; and the pressure drag, or form drag, which can be de­termined by integrating the streamwise component of the pressure around the surface of the wing. This form drag is zero in inviscid subcritical flow and becomes non-zero in viscous flow when the pressure on the wing is worked out as that on the displacement surface. The profile drag is often assumed to be independent of the lift; it is then identical with the zero-lift drag Cpp in (3.42).

There are many methods for obtaining rapid, but approximate, predictions of the profile drag of twodimensional aerofoils, beginning with those by J Fretsch (1938) and H В Squire & A D Young (1937). The latter found that the pressure drag is roughly t/c times the total profile drag. On infinite sheared wings, there is a sweep effect which tends to reduce the profile drag below that of the corresponding twodimensional aerofoil, as has been measured by J Weber &

G G Brebner (1952) and explained by J C Cooke (1964). But matters are much more complicated when the drag of real aircraft is to be predicted. For ex­ample, the surface cannot be assumed to be smooth and the effects of surface imperfections must be taken into account (see e. g. S F Hoemer (1965),

L Gaudet & К G Winter (1973)). Also on complete aircraft, a very large number of individual drag sources must be accounted for, and drag prediction for the appraisal of projects and for the estimation of an aircraft’s performance re­quires a very complex framework of techniques. This must be a process of syn­thesis, rather than a simple summation, and it is essential to know about the individual flow elements, and their interactions, which together constitute the complete flow pattern. For a survey of present drag prediction methods, we refer to two recent reviews by J H Paterson et al. (1973) and by S F J Butler (1973). In view of the complexity and magnitude of the task of deter­mining the drag of aircraft, it is not surprising that the available theoreti­cal methods are as yet. inadequate and that much has to be left to experiments.

The second important effect caused by the existence of the boundary layer and wake is the reduction of the lift force and associated changes in the pitching moment. That the viscous drag of an aerofoil reduces the lift force on it was first realised by A Betz & I Lotz (1932) who proposed a model of the flow where the boundary layer and wake are represented by a suitable distribution of sources over the surface of the aerofoil, adjusted to produce a displacement surface and the right overall viscous drag. Since the boundary layer on a. lift­ing aerofoil is, in general, thicker on the upper surface than on the lower surface, these sources are put on the rear part of the upper surface so that, in the simplest model, the source flow is bounded by two streamlines: one ori­ginating from the upper surface of the aerofoil just upstream of the sources, and the other from the trailing edge. Thus the Kutta condition of smooth out­flow from the trailing edge in inviscid flow is replaced by a condition which involves two streamlines leaving the aerofoil, with a source flow interjected, in this model of the viscous flow. It is then possible to explain why visco­sity leads to a reduction of the circulation. This model could be developed further (see e. g. J Pretsch (1938)) into a routine method for practical pur­poses, including threedimensional wings, but this has not yet been done successfully.

Another approach which has led to some success is that by J H Preston (1949) and (1954). It is based on a model illustrated in Fig. 4.28. The boundary of

Viscosity effects

Fig. 4.28 Aerofoil with displacement surface superposed (schematic)

the displacement surfacg is shown schematically by adding the displacement thicknesses and 6^ , together with a new mean chordtine halfway between

the boundaries on the upper and lower surfaces. Thus the thickness of the aerofoil is increased by an amount.£(Sj + 6*) on either side of the new mean line and a wake is added; and the angle of incidence is changed by Aa and the camber changed by Af (both of which are usually negative); both of these are to be determined from J (6jJ[ – 6*). The mean line in the wake is curved and ehould be represented by a vortex distribution which changes the down – wash along the new mean line and reduces the circulation further. Again, this model of the flow explains clearly why the lift is reduced by the viscous drag.

This model leads to a relatively simple method for estimating viscosity effects, which has been applied convincingly by G G Brebner & J A Bagley (1952) to a twodimensional aerofoil for which they also obtained careful pressure and boun­dary-layer measurements*). Using experimental results for 6*(x) and 6*(x), they calculated first the pressure distribution with the Kutta condition ful­filled at the midpoint on the meanline above the trailing edge. Then they used the results of J H Preston (1949) to reduce the circulation further in order to fulfil Taylor’s theorem that equal amounts of positive and negative vorticity should be shed into the wake. One of their results for the chord – wise loading, in Fig. 4.29, shows that these effects account quite well for the measured values. It also shows how the final calculated loading comes about: starting from the loading for the thin wing and going from there to that of the thick wing, both in inviscid flow, and subsequently accounting for the camber effect, Af, this being most noticeable over the rear of the section, and then for the effects of Да and of the reduction of circulation, which are taken as constant factors to ACp(x) in inviscid flow. This is roughly the sequence of effects to be borne in mind. Evidently, each of them matters and

*) These measurements also show interesting evidence on a possible effect of transition. At low angles of incidence, transition occurred at about midchord and took the form of a laminar separation bubble with reattachment, not of an instability. The bubble was very shallow and caused only a slight dip in the pressure distribution; the bubble length was about 0.2 c.

157

any theory which cannot take some account of all of them is of limited practi­cal usefulness.

Viscosity effects

Fig. 4*29 Experimental and calculated chordwise loadings over a two­dimensional aerofoil. After Brebner & Bagley (1952)

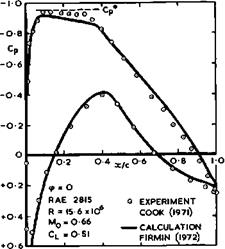
Strictly, this application of Taylor*s theorem is not sufficient, especially when the effect of the circulation in the wake is larger than in the example in Fig. 4.29, as it is on sections with significant rear loading. A better representation of the vorticity in the wake has been worked out by D A Spence & J A Beasley (1958), and attempts at achieving further improvements have been made by R C Lock et at» (1968) and (1970) and also by J Steinheuer (1973) who obtained results which represent the experiments of Brebner & Bagley very well, including the effects of changes in the Reynolds number. И С P Firmin (1972) has provided an iteration method for compressible subcritical flows, which proceeds in steps by calculating pressure distributions and boundary-layer and wake developments, using the framework of the RAE Standard Method for the for­mer and the entrainment method of J E Green (1972) for the latter. In the first step, the pressure distribution in inviscid flow is suitably adjusted

Viscosity effects

Fig. 4.30 Experimental and calculated pressure distributions over a two­dimensional aerofoil

LIVE GRAPH

Click here to view

The Aerodynamic Design of Aircraft

and changed rather arbitrarily in the region of the trailing edge to avoid any separation or divergence at this initial stage of the iteration. It is inter­esting to note that, to avoid divergence, it has also been found that only a proportion of the change in ordinates should be included during any one step, so that a relaxation factor had to be introduced and limited to 0.2. This means that the number of steps to be taken may be rather large. Thus Firmin’s may be regarded as an interim method, and subsequent developments may lead to improvements not only in the accuracy but also in the ease of obtaining a solu­tion, brought about by a better physical model of the flow. In the meantime, the results in Fig. 4.30 show that the main features of the pressure distribu­tion over a twodimensional aerofoil can be predicted very well, albeit not altogether satisfactorily.

Viscosity effects

Fig. 4.31 Reduction of the sectional lift slope due to the boundary layer on a twodimensional aerofoil and near mid-semispan on two sweptback wings

The experimental results in Fig. 4.31 show how the effects of viscosity increase with increasing lift coefficient, using as a demonstrator the sectional ■lift slope as a fraction, к , of its value in inviscid flow. Evidently, not only the displacement thicknesses themselves but also the difference б* – 6* in­crease with Cl, so that к appears to decrease roughly linearly with in­creasing CL. Even in the limit Cl 0, the boundary layer reduces the lift slope well below the value in inviscid flow. Why this value should seem to be independent of the angle of sweep has not yet been explained. The lift re­duction goes together with a slight forward shift of the aerodynamic centre.

All the observations and theories described so far concern twodimensional flows. The concepts put forward about the displacement effects and the wake have proved fairly useful, but inadequacies in the numerical answers obtained from them are clearly apparent: in the determination of the drag and of the pressure in the trailing-edge region. Also, the extension of the Kutta condition to real flows presents conceptual difficulties. We must be prepared, therefore, to find that the treatment of viscous effects in threedimensional flows is rather more uncertain.

First conjectures, together with some experimental evidence, on the effects of viscosity on the type of flow over threedimensional swept wings are given in two papers by D KUchemann (1955), based in the main on concepts already des­cribed above. In view of the properties of threedimensional boundary layers, with their significant spanwise outflow on sweptback wings, viscous interac­tions must be expected to become much stronger when sweep effects make them-

Viscosity effects

Threedimensional sweep effects

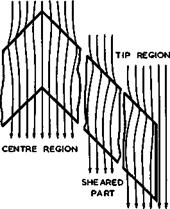
4.4 It must be realised that all the sweep effects considered so far apply to the highly-idealised concept of a sheared wing of infinite span. Real swept wings have a kink in the middle (Fig.4.5), and this affects the flow in a fundamental way. The curved streamlines typi­cal of the sheared-wing flow can persist neither into the centre of a swept wing nor up to the wing tip. As indicated in Fig. 4.6, the streamlines are straightened out in both regions. They must be quite straight in the centre plane for reasons of symmetry, and also again at some distance from the wing tips. Thus none of the relations derived so far for the chordwise loadings, the sectional lift slope, and the pressure distributions can hold in the centre and tip regions of swept wings.

We shall find that these threedimensional centre and tip effects are strong and pronounced. To deal with them in a manner suitable for our purposes, we need more than just numerical or experimental answers. We need a simple approximate calculation method which should fulfil a number of conditions: it should fit into the framework of classical aerofoil theory; it should clearly identify the physical centre and tip effects and represent the correct mathe­matical behaviour in those regions; it should be possible to incorporate em­pirical compressibility corrections; it should be possible to fit in viscous regions; it should be possible to extend it to deal with variable-geometry high-lift systems; it should be readily adaptable to identify clearly addi­tional interference effects, such as those between wings and fuselage, wing and engine nacelles, and wings and wings, and it should be possible to deal with these effects within the same framework; above all, it should provide valid pointers to physically realistic design aims, and it should be possible to in­vert the method so as to determine shapes which have desirable properties.

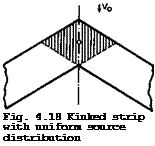
Подпись: Fig. 4.18 Kinked strip with uniform source distribution

We consider first the thickness effects at the centre section, to extend the results obtained in Section 4.3. A non-lifting swept wing of infinite span with a kink at у = 0 can again be replaced by a distribution of sources and sinks of strength q(x, y) per unit area. It can be shown that the boundary condition (2.23) still applies, and so the local source strength is related to the local streamwise slope of the wing section. But elemental source strips have a kink in the middle. Consider now the midpoint of a kinked strip covered uniformly with sources, as shown in Fig. 4.18. For zero angle of sweep, the value vx(0,0,0) at the midpoint is zero because there is al­ways a source element on one side to counterbalance the effect of another on

the other side. With a kinked strip, however, only the sources in the shaded area counterbalance each other. The remaining sources induce a local veloci­ty increment which is directed against the mainstream and proportional to the local source strength. Physically, we must expect a strong kink effect which takes the form of an additional streamwise velocity component. It must be proportional to the local source strength and hence to the local streamwise slope of the wing section at the kink.

Mathematically, this local term can be obtained as the limit z -»■ 0 of vx(x,0,z) (D KUchemann (1947)) or as the limit у 0 of vx(x, y,0)

Threedimensional sweep effects

(S Neumark (1947)). The complete velocity increment along the centre line can then be shown to be

Threedimensional sweep effects

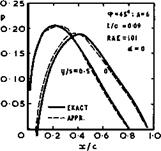
using (2.23) and the Riegels factor from (4.44) to avoid an infinite velocity at the leading edge. The accuracy of this approximation can be checked and improved by the iterative method described above, computing the velocity in­crement directly on the surface of the thick wing. A typical example is shown in Fig, 4.19. We find that the approximations need only small corrections, but that the pressure distribution at the centre у = 0 is very different from that further out on the wing at y/s =0.5 , which is close to that over

Threedimensional sweep effects

Fig. 4.19 Pressure distributions at two sections of an untapered sweptback wing without lift.

an infinite sheared wing. Thus the centre effect is very pronounced and an essential feature of threedimensional swept wings.

A similar effect must occur near the wing tips. To a first order, the tip sec­tion itself behaves like the centre section of a wing with the reverse angle of sweep but with vx taken for only one half wing, so that (4.88) could be used with a factor 1/2 and q> replaced by – cp. But, as described in Section

4.3, a factor 0.7 is more appropriate. Whereas the centre effect shifts the minimum pressure backward along the chord of a sweptback wing and usually reduces it slightly, the tip effect shifts it forward and usually makes the suction peak higher.

This departure of the pressure distribution from that of the infinite sheared wing inplies that a normal pressure drag acts at the centre of a sweptback wing and a thrust at the tips, because zero drag is obtained only with pres­sure distributions as on twodimensional aerofoils. The drag can be determined by integration from the pressure distribution or from (2.26). This gives

ACd = 4 cos V f (*>) J dx,

0

or, more generally,

1

ACD * * cos [ (4^ — dX. (4.89)

5 ‘ Jl + (dz/dx)2

This pressure drag ife thus proportional to (t/c) , and we shall see later that this drag can be quite large as compared with other parts of the total drag. However, the overall pressure drag of a threedimensional wing must still be zero in an inviscid incompressible flow (or in any isentropic flow) and so the drag forces in the central region must be cancelled by thrust forces in the tip regions. It must be expected that the drag is highest at the centre
section and that it will fall off with increasing у, to be measured in terms of the local wing chord:

Подпись: (4.90)ACD(y) = У ACD(y = 0)

Threedimensional sweep effects Подпись: 0.068 - 0.122(y/c) £ 0.068 + (y/c) for 0.073 - 0.098(yT - y)/c 0.104 + (yT - у)/с Threedimensional sweep effects Подпись: (4.91)

There is no need to determine this fall-off very accurately since any approxi­mate interpolation can readily be improved upon by the iterative method of Section 4.3. Physically, nothing much happens between the significant centre and sheared-wing stations, anyway. Any reasonable interpolation curve with у = 1 at у = 0 and у = 0 at about y/c = 0.5 like that shown in Fig. 12 of D KUchemann & J Weber (1953) and repeated in the ESDU Data Memorandum (Anon (1963)) will be quite sufficient. Similarly, another interpolation curve can be used inboard of the wing tips. If the velocity at the wing tip is taken as approximately 0.7 times that from (4.88), then y(yi – у) should have the value 0.7 at у = yp and should fall to zero somewhat further inboard at about (yT – y)/c = 0.75 , say, so that the drag and thrust forces can cancel one another. An approximate formula has been given by J Wooller (1963, unpublished):

у being zero everywhere else.

The same interpolation factor y(y) can also be used as a factor multiplying the centre term (containing f (cp) in (4.88)) to calculate the velocity or pres­sure distribution at any intermediate station. It can also be used in an ap­proximate way to determine the induced velocity component Vy in the lateral direction. Thus the complete velocity field will produce streamlines as in Fig. 4.6 , starting with a straight streamline along the centre, acquiring curvature away from the centre, and approaching that typical of sheared wings of infinite span near mid-semispan – if the aspect ratio is large enough – and then straightening out again somewhere just outside the wing tips.

Thus we find that the concept of an infinite sheared wing is still useful and may be applied to some region around mid-semispan, outside the regions domina­ted by the centre and tip effects, if the aspect ratio is large enough. But centre and tip effects will merge and leave no sheared part on the wing when the aspect ratio is about three or less. The flow over the wing is then wholly threedimensional, and properties derived for twodimensional aerofoils can no longer be applied.

We have considered compressibility effects several times already, in Section

2.3 and in Section 4.2 for infinite sheared wings. Now we have to consider the full potential equation for threedimensional flows, given by (2.2). We have seen that the simplest way of obtaining solutions is by the Prandtl – Glauert procedure in which an analogous wing of reduced thickness, higher sweep, and smaller aspect ratio is considered through the relations (2.32), (2.33), and (2.34). This means that we are now getting interested also in wings of smaller aspect ratios, when the Mach number is increased, even if the aspect ratio of the actual wing is still large. This implies, in turn, that the part of the wing where infinite-sheared-wing concepts may be applied will shrink as

139

Threedimensional sweep effects

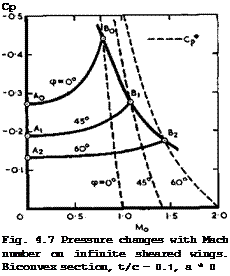
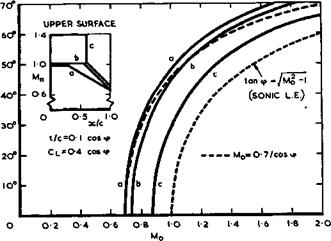
the Mach number increases. For example, on a wing with a geometric aspect ratio of 6, it would disappear altogether at a Mach number of about 0.87, if the Prandtl-Glauert rule (4.19) is applied. In reality, the flow will be wholly threedimensional at a lower Mach nuniber, since the actual answers from the Prandtl-Glauert rule are usually quite inadequate. The results in Fig. 4.20 show that Weber*s rule (i. e. (2.38) suitably adapted) gives a much better re­presentation of experimental values. This implies that the curves in Fig.4.7 can only serve to illustrate trends; numerically, they are not correct.

The Weber rule has been extended to threedimensional wings where it turns out that the compressibility factor 3 cannot be applied everywhere but takes different forms for the centre, sheared-wing, and tip regions. These compres­sibility corrections have been revised by R C Lock (1970) on the basis of the work by R C Lock et at* (1968) for twodimensional aerofoil sections. Differ­ent factors are now applied to the first-order and the second-order terms in the RAE Standard Method, but the new factors are largely empirical and could only be based on plausible suggestions. They must, therefore, remain tenta­tive in some respects until reliable experimental evidence becomes available.

We shall come back to these problems in Section 4.8. But it is already clear that, even when the flow remains wholly subcritical, compressibility effects on threedimensional wings are large.

Having found strong threedimensional centre and tip effects on thick swept wings at zero lift, we may expect that similar effects occur on lifting wings, even if we restrict ourselves first to wings of large aspect ratio in inviscid incompressible flow. We retain the same vortex model as in Section 4.3 and, in particular, the concepts of bound vortices, y^ , which now lie spanwise along the direction of sweep, and of trailing or streamwise vortices yt. We also retain the concepts of effective and induced angles of incidence, ae and df, and write the boundary condition on the wing as in (4.57). This implies that, with the assumption (4.51) for wings of large aspect ratio, we still take the downwash induced by the streamwise vortices to be constant along the chord. On a swept wing with a kink in the middle, the streamwise vortices are staggered and begin at different values of x, depending on the spanwise sta­tion у. If the spanwise loading is such as to produce a constant induced downwash ot£ along the span of the wing as well as in the Trefftz plane, the vortex drag has a minimum given by (3.22). If this spanwise loading would also correspond to a constant C^-value along the span, as on unswept wings with elliptic planform and elliptic loading, then Cpy ■ CL ai and d£ would be given by (3.24) or, more generally, by (4.56) and (4.57). This means that the

downwash from the streamwise vortices would he independent of the angle of sweep and remain the same whether the streamwise vortices are staggered or not. This simplification that there is no sweep effect on the streamwise vor­tices is made in the approximate method that follows.

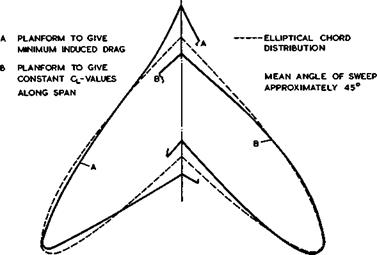
We note at this point that this rather drastic simplification must imply some errors. If the theory to be derived on this assumption is applied inversely to calculate, for example, planform shapes to give elliptic spanwise loading and hence minimum vortex drag, and also planform shapes to give constant lift along the span, it turns out that the planform shapes are not the same when

Threedimensional sweep effects

Fig. 4.21 Calculated planforms for minimum induced drag and for constant lift

the wing is swept. These two characteristics go together only when the wing is unswept; if the wing is swept, the two planforms differ significantly as the example shown in Fig. 4.21 indicates. Thus this approximation is, strict­ly, not self-consistent. Even so, we shall find that the error is small, be­cause the main effect of sweep is that caused by the change of direction of the bound vortices near the central kink of a swept wing, in much the same way as the kink effect of source lines. This affects the value of ae and leads to a chordwise loading which differs radically from that for a twodimensional

Threedimensional sweep effects

Fig. 4.22 Vortex pattern near the centre of a sweptback wing

aerofoil, or for an unswept wing, as given by (4.54).

Threedimensional sweep effects

That there must be a strong effect of the central kink becomes quite clear when we look at the likely vortex pattern песет the centre of a sweptback wing of large span, as indicated in Fig. 4.22. It is evident that the simplifying assumption (4.51) for wings of large aspect ratio is not now admissible. For a flat wing (full lines), the bound vortex lines must change direction and curve round smoothly, and some may even turn into streamwise vortices before they reach the kink. In that case, the loading at the centre will be lower than that further out on the wing. All this is likely to happen within about one chord from the centre line; further away, conditions as on an infinite sheared wing will be approached. A wing must be specially designed and shaped to have the same chordwise loading at all spanwise stations, right into the middle (dashed lines). The bound vortices then have a kink at the centre line.

using (4.92). The first term is equivalent to (4.53) for unswept wings and the second term expresses the remaining downwash as being proportional to the local vortex strength. Thus kinked source and vortex distributions, to repre­sent thickness and lift, exhibit similar centre effects. These are the signi­ficant features of threedimensional swept wings, which demand our attention above all.

At the centre, у = 0, some numerical evaluations of the actual downwash inte­gral for specific wings of small thickness have shown that the function cr(<p, x,y, z) can be approximated simply by

a = it tan <p, (4.94)

i. e. by a function of <p only, for any given shape of the wing section. J Weber

(1957) and (1973) has evaluated in detail the error introduced by this approximation.

To see what has to be done to counteract this strong centre effect, consider a swept wing of infinite span where we demand that the chordwise loading be that of the twodimensional flat plate everywhere along the span, including the centre, so that no trailing vortices are shed:

*(x) =f (4’95)

Threedimensional sweep effects Threedimensional sweep effects Подпись: (l - tan */4^) Подпись: (4.96)

for all values of у, as in (4.54), with the chord c taken as unity. Inser­ting this into (4.93), with a from (4.94), we find that the downwash integral can be evaluated in closed form:

Threedimensional sweep effects Threedimensional sweep effects

With the boundary condition vze/V0 = dz/dx, the coordinates z(x) of the shape of the centre line of the aerofoil section at the central kink of the wing can be obtained by integration:

if z(0) = 0. Far away from the centre at the sheared part of the wing, only the first term in (4.93) applies and we have

cL

z(x) = a x, where a = – z—– , (4.98)

zir costp

in accordance with (4.17), since a = ae in the absence of trailing vortices. The difference in the shape of the chordline between the centre section and a section on the sheared part of the wing can then be determined and divided into two parts:

Да = Az(x=l) = у a tan<p, (4.99)

which represents an angle of twist, and

Az(x) – Дах = іа tan <p 0 – 2x) – sin 1 (1 – 2x) + Jl – {I – 2x)^| (4.100)

which represents a camber tine. In these expressions, a (and thus Cl) and <p appear only as factors so that the twist and camber take the same forms under all conditions. The camber line has its position of maximum camber at 29% of the chord. The camber at the centre of a sweptback wing is negative, i. e. concave on the upper surface. The twist is in the sense of increasing the angle of incidence at the centre above that of the sheared part of the wing. That (4.99) and (4.100) are adequate approximations has been demonstrated ex­perimentally by shaping a wing (with <p = 45° and A = 5, t/c = 0.12) accor­dingly and testing it. Flat plate loadings were measured everywhere for angles of incidence between about -2° and +10° (see J Weber & G G Brebner (1951),

D KUchemann (1953)). We may conclude quite generally that camber and twist are needed to load up the central region of a threedimensional sweptback wing to obtain the benefits of sweep as exhibited by an infinite sheared wing.

These design matters will be discussed further in Chapter 5. .

We now proceed to consider wings of arbitrary given shape and make the assump­tion that the downwash induced by the bound vorticity component can still be approximated by (4.93), with a from (4.94). For example, if ae = vze/V0 = constant at the centre section, as for a flat wing, this relation can be regarded as an integral equation for y(x) or £(x) of the type treated by T Carleman (1922). But the relation (4.92) between vortex strength and loading

cannot be applied at the centre section because the elemental vortex lines must be expected to cross the centre line at right angles, as in the full lines of. Fig. 4.22, and thus be unswept there. Hence

y(x) = Jv0 *(x) ,

(4.101)

The solution for

the loading is then

*(x)

– sinim c/*1 " Xt

7ГП Цх – ^ J

»

(4.102)

n = i(1 ■ ¥72}

(4.103)

“e

, costp » a e 47m.

sinim

(4.104)

as in (2.46).

Подпись: where
Подпись: and

for the sectional lift slope. This fits well into our framework of classical aerofoil theory: it has exactly the same form as (4.54) for unswept wings of large aspect ratio, where n ‘ j, and as (4.71) for unswept wings of small aspect ratio, where n’ is obtained from (4.80). The Kutta condition at the trailing edge, A(xx) = 0, is fulfilled automatically.

The threedimensional sweep effect is thus described by the single parameter n from (4.103). It varies linearly with sweep angle from n = 1 at q> = -90° to n = 0 at <p ■ +90° . It also determines the behaviour of the load near the apex of the wing. The exact mathematical behaviour near this singular point has exercised many (see e. g. P Germain (1955), R Legendre (1956), Patricia J Rossіter (1969), Susan N Brown & К Stewartson (1969), R S Taylor (1971), Patricia J Davies (1972)), and it is now clear that, for P >0, the loading near the apex does indeed behave like (l/x)n, as in (4.102). But it turns out that n is not strictly a linear function of <p between n <* J for p * 0 and n = 0 for ф = +90°, as in the approximation explained above, but the de­viations are not large. This result is of interest also in the application of methods for computing the loading over swept wings by the use of collocation points: representing in the computer program both the singularity of the load at the apex and the detailed behaviour of the load near the apex leads to large increases in the accuracy or, alternatively, to considerable savings in computer time, as has been demonstrated by В L Hewitt & W Kellaway (1972).

The threedimensional effect on the chordwise loading over the centre of a swept wing is quite strong. A typical example is shown in Fig. 4.23. As for the case of a thick wing at zero lift in Fig. 4.19, the velocities are reduced over the front part and increased over the rear part, as compared with those over a twodimensional or sheared aerofoil, which is consistent with the gener­al flow model drawn in Fig. 4.6. One is tempted to say that the front part is "under-twodimensional" and tends to the behaviour of a threedimensional body, whereas the rear part is "over-twodimensional", with regard to both thickness and lift. Thus the kink effects of thickness and of lift reinforoe each other. Fig. 4.23 also shows that the approximation (4.102) represents experimental values well and that the shape of the loading curve is not strongly affected by the aspect ratio of the wing, in the region tested. The turning of the bound vortices in the central region evidently produces the overriding local effect, as is to be expected.

This characteristic feature can be exploited in order to interpolate the load­ings at other stations near the centre. At some distance away from the centre

5

Подпись:Подпись: 2Подпись:Подпись: 0-2 0-4Подпись: x/cПодпись:Подпись: I ОПодпись:Threedimensional sweep effectsО

on the sheared part of the wing, (4.92) applies and the chordwise loading is given by (4.54). We find that (4.102) formally covers both cases, n – applying to the sheared wing, у » c, and n from (4.103) to the centre section у – 0. Therefore, we simply assume that this relation applies every­where and that a reasonable interpolation can be obtained by regarding n as a function not only of cp but also of у, to be measured in terms of the wing chord. Within the present simple framework, it does not seem worth­while to go further than that and, again, nothing much of physical signifi­cance happens between the centre and sheared-wing stations. To stay safely on physical grounds, however, we use the fact that the position of the aero­dynamic centre is xac/c « J(1 – n), by (4.72), and that the locus of the aerodynamic centre along the wing span can be expected to be a smooth continu­ous line which crosses the centre line of the wing at rightangles. For a flat wing of infinite span, this locus can reasonably be approximated by a hyperbola with the quarter-chord lines of the two wing halves as asymptotes. If we now

Подпись:Threedimensional sweep effects(4.105)

as a generalisation of (4.103), the interpolation function X(y) is related to the shift of the aerodynamic centre caused by the effect of the kink at the centre,

Threedimensional sweep effects

Threedimensional sweep effects

(4.106)

which can be further simplified for small angles of <p into

Threedimensional sweep effects(4.107)

This relation has been found adequate for most practical purposes. X * 1 at the centreline у ■ 0, and X fades out to a small value at about у ■ c,

in accordance with the flow model we have in mind.

The characteristic properties of the central region of a swept wing have been derived in such a way that they can be said to apply also in the tip regions of wings of finite span, with the opposite sign of the angle of sweep, and y/c measured inwards from the tips. In this way, the chordwise loading at any spanwise station of a swept wing can be determined from (4.102), together with (4.105) and (4.107). Similarly, the sectional lift slope at any station is given by (4.104). It then remains to determine the spanwise lift distribu­tion СіДу) . Since we made the assumption that the downwash a£ induced by the streamwise vorticity components is not affected by sweep, the classical relation (4.56) can be used in the generalised form of (4.81). Thus the load distribution over the whole surface of a swept wing can be determined.

The framework of this theory is so constructed that effects caused by low aspect ratios can readily be incorporated by combining the above relations with those derived in Section 4.3, especially with (4.71) for the chordwise loading, (4.74) for the sectional lift slope, and (4.80) for the parameter n (see D KUchemann (1952)). That this is possible is based on the physics of the flows which have many fundamental similarities. Again, the effects of non-zero wing thickness and of compressibility can be incorporated, using the relations derived in Sections 4.3 and 4.4, and pressure distributions can be calculated. The application of camber and twist needs special treatment in this framework (see G G Brebner (1952)), as does the inclusion of wing taper and of any cranks in the leading and trailing edges at spanwise stations other than the middle of the wing (see G G Brebner (1953)).

When all these elements are combined and the various terms put together, a complete relation can be obtained for the velocity at any point on the sur­face of any given thick, lifting, swept wing in compressible sub critical flow. This may be found in detail in the extensive ESDU Data Memo (Anon (1963) and

(1973) ), together with explanations of how it should be used. A complete and consistent set of all the second-order terms for wings in incompressible flow has been derived by J Weber (1972). The accuracy of this RAE Standard Method has been assessed by J Weber (1973). It can readily be improved by the rapidly-converging iteration method of Weber and Sells, which has been des­cribed in Section 4.3. To account for compressibility, the Weber factor from

(2.38) can be extended to threedimensional wings and incorporated. Alternat­ively, compressibility factors proposed by R C Lock et al. (1968) and R C Lock (1970) can be used, whiah should lead to an improvement over the local linearisation. But this includes an empirical element, and it is still not clear whether or not the compressibility factors give a sufficiently accurate approximation, especially near the centre of a swept wing. Doubts have arisen ever since T E В Bateman & A J Lawrence (1955) produced experi­mental results which indicated that the actual centre effect at near-critical Mach numbers was more pronounced than in the theoretical estimates (see also A J Lawrence (1954)). These have not yet been resolved. The main character­istic of the RAE Standard Method described here is that all the terms in a rather complex formula can be interpreted and have some physical meaning. The iteration method to obtain accurate answers has the merit of retaining a "feel" for the accuracy of the results, since residual errors are known at all stages in the calculation.

A typical calculated pressure distribution over the surface of a sweptback wing is shown in Fig. 4.24, which can be compared with that over an unswept wing in Fig. 4.15. The threedimensional sweep effects are seen to be very

Pressure distributions over a sweptback wing of large aspect ratio

Подпись: Fig. 4.24

Threedimensional sweep effects Threedimensional sweep effects

large, and the pressures now vary considerably along the span. The reduction of the suction peaks in the central region and the very sharp and high peaks in the tip regions are particularly noticeable. Such non-uniformities are obviously undesirable in wing design. Among other things, they produce un­necessarily steep adverse pressure gradients and hence premature flow separa­tions; and also unnecessarily early appearances of local supersonic regions. How these shortcomings may be avoided by suitable wing design and, in particu­lar how the centre and tip effects may be counteracted will be discussed in Chapter 5.

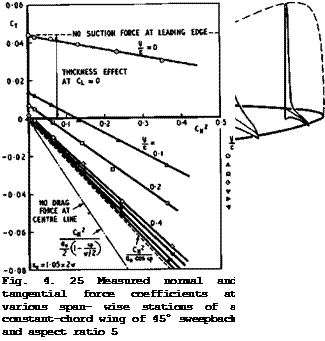
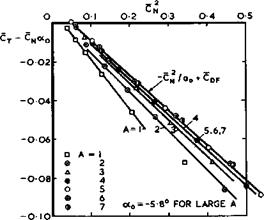
A very sensitive check to show whether or not the pressure distribution along some section has a twodimensional character is to plot the sectional tangen­tial force coefficient Cj against the square of the sectional normal force coefficient Cj^ . Extending (3.30) for uncambered wings, we should have

CT = “ CN2 . (4.108)

with a from (4.104) and n from (4.105). The tangential thrust force would be large enough to bring the sectional drag force in inviscid flow to zero if

CT —– — cJ2 (4.109)

T aQ cos ф ті 4 ‘

on the sheared part of the wing; and if

Подпись:Подпись: І7І-Подпись: )CT = "

at the centre section. Experimental evidence in Fig. 4.25, which is to be com­pared with that in Fig. 4.16 for unswept wings, shows that values according to

(4.109) are indeed approached for the larger values of y/c of about 1 or greater, i. e. there exists a sheared part on this wing, where the properties are closely related to those of the corresponding twodimensional section. But

(4.110) obviously does not apply. In fact, it can be shown that Op " 0 for the chordwise loading at. the centre, by (.4.102) (see D KUchemann (1952)), so that there is a large drag force due to lift at the centre section. By (3.29), this drag force gives 4CD = CLae. In addition, we have already seen that there is a drag force due to thickness, given by (4.89). The experimental results in Fig. 4.25 confirm this and show at the same time how the drag is built up towards the centre. The linear relationship between c2 and CT appears to be retained, however.

We note at this point that there are many other methods for calculating the loading over swept wings, usually for incompressible flow. The emphasis is not so much on the physics of the flow but mostly on the numerical aspects and the use of computers; some of them have already been mentioned in Section 4.3.

In some other methods, the wing is replaced by a lattice of vortex lines, or panels of sources or doublets, in contrast to the method described above where the load distribution is continuous over the whole surface. The boundary con­dition is thensatisfied at collocation points within such lattice elements.

The accuracy of vortex-lattice methods is sometimes doubtful (see D KUchemann (1952)). Typical of this kind of method are those by S G Hedman (1965), F A Woodward (1968), E Albano & W P Rodden (1969), W P Rodden et at. (1971) and

(1972) . Other practical methods have been developed by A Kraus & T Sacher (1970) and В Maskew (1970) and (1975). In these methods, collocation points or panels are treated in an egalitarian manner, for the sake of the computer, and the physical significance of kink and sheared-wing sections has been suppressed and does not appear. None of these methods has been specifically designed to reproduce the correct behaviour at kinks, cranks, and other significant regions, except that by В L Hewitt & W Kellaway (1972), which has already been mentioned. Numerical solutions of potential-flow problems can also be obtained by finite-element methods. A discussion of the mathematical problems involved may be found in J R Whiteman (1973). A practical finite-element method has been developed by J H Argyris & G Mareczek (1972).

Another set of methods uses distributions of singularities over the surface of the given body. These are powerful tools, where the emphasis is again on the numerical analysis – the fundamental aerodynamics are the same as in the classical treatment describe above, and no new physical concepts arise or

are involved. In fact, the various physical effects and significant mathemati­cal behaviours which have been identified above do not appear and come out clearly. It would seem to be a job for the numerical analyst in the future to identify the behaviour in all sensitive regions and to feed this into the com­puter program intentionally and carefully.

The pioneer work on ’panel methods was done by J L Hess & A M 0 Smith (1967).

The shape of the body is approximated by a number of plane quadrilateral panels – or faoets – whose corners are derived from the set of points used to define the body. Each panel carries a uniform source distribution. The source strength is determined from the boundary condition that the velocity component normal to the panel vanishes. Thus the velocity components induced by each source panel at all the others (including its own) are calculated first, and the boundary condition is then satisfied approximately at one con­trol point on each panel, normally taken to be its centroid. These conditions can be expressed in matrix form, with a matrix of influence coefficients. Be­cause of the simple way in which the problem is discretised, analytic expres­sions for the velocity vectors and influence coefficients can be determined. These expressions are rather complicated and hence time-consuming to compute. They are used only at points close to the centroid of each element, and a mul­tipole expansion is used for more distant points. The unknown source strengths are then obtained by solving a set of linear equations. If the number of panels is not too large (less than about 500), direct Gaussian elimination can be used; for larger numbers, standard iterative relaxation methods are usually successful. When the source strengths are known, the total velocity at each panel can be computed. Lift has been introduced into this method by J L Hess

(1972) by placing a distribution of vorticity of unit strength on each panel.

On a threedimensional wing, the surface is subdivided into a number of chord – wise strips of bound vorticity and a trailing vortex wake is added. The pro­cedure of obtaining solutions for the superposed source and vortex distribu­tions is otherwise the same as that for non-lifting bodies. The Kutta condi­tion at the trailing edge is not fulfilled automatically, as in the RAE Method. Therefore, a number of solutions is considered in succession until the Kutta condition is satisfied to some suitable approximation, for example, by requi­ring that the velocities at the two control points immediately adjacent to the trailing edge, on the upper and lower surfaces, shall be equal. This method by Smith & Hess has been applied successfully to many complex configurations, including multiple aerofoils, and it still remains one of the best methods available.

There are now quite a number of other facet methods, and we mention here the early work of P E Rubbert & G R Saaris (1972) and that of S R Ahmed (1973). A similar technique, but with important improvements with regard to the numeri­cal treatment, was developed by T E Labrujere et al. (1970). In this NLR Method, source panels on the surface are used as before, but the lift is represented by a system of quadrilateral vortex panels placed inside the wing, usually on the camber surface. The vortex wake is modelled as a number of discrete vor­tex lines, one for each chordwise strip of the wing. The combined flow of the source panels and the vortex system is determined in such a way that the Kutta condition is satisfied at control points just downstream of the trailing edge on the bisectors of the local trailing-edge angle. This condition appears to conflict with the result of К W Mangier & J H В Smith (1970), which says the vortex sheet must leave the trailing edge parallel to either the upper or the lower surface of the wing. The important feature of the NLR Method is an improved numerical technique for solving the large number of simultaneous equations for the source and vortex strengths. An iterative scheme of block relaxation has been devised, which leads to a dramatic reduction in the com­puting time as compared with schemes where a direct matrix inversion is used. The reduction in computing time may be as much as a factor of 5.

We note at this point that these panel or facet methods still involve quite a number of approximations and cannot, therefore, he regarded as numerically accurate. For this reason, the cubic-spline method of A Roberts & К Rundle

(1972) and (1973) is of practical interest because it should be inherently more accurate. Although the computing times are longer, it may be competitive with the iterative NLR Method because, for an expected degree of accuracy, a facet method may need about twice as many panels as Robert’s method for computing a twodimensional flow and about four times the number for a three­dimensional configuration. Besides, the Kutta condition can be fulfilled implicitly and the correct behaviour at kinks and in wing-fuselage junctions can be represented approximately. In these respects, other panel methods can­not catch up with this increased accuracy merely by increasing the number of panels. The greater accuracy is achieved by representing the body shape not by a number of plane facets but by a surface interpolation scheme based on bicubic врЫпее. Also, the flow perturbations are produced by continuous dis­tributions of sources and doublets, again built up from a number of basic spline modes. For non-lifting bodies, the procedure is otherwise similar to that used in the facet methods, leading to a set of linear equations for the strengths of the source modes. These are solved by direct matrix inversion. Lift is introduced by means of doublet sheets which cover the wake and extend for­ward inside the wing along its camber surface. Both the doublet and source strengths vary in particular ways as the trailing edge is approached so that the velocity remains finite there. All these features represent clear improve­ments over the corresponding parts of facet methods. On the other hand, the velocity fields and the influence functions can no longer be expressed analy­tically. They are now surface integrals over the panels, and these are evalu­ated numerically by means of a double Gaussian quadrature, successively sub­dividing the panels in both directions until adequate accuracy is obtained. As a result of this complexity, the computing time is much longer than that of the facet methods.

In general, results of good accuracy can be obtained by the cubic-spline method of Roberts & Rundle, at least for incompressible flows. The accuracy is about the same as that of the iterative method of Weber and Sells described above. This has been demonstrated by С C L Sells (1974), and an example is reproduced in Fig. 4.26 (see also R C Lock (1975)). This sweptback wing has been designed by J A Bagley (1965) to have straight isobars at Mq = 0.8 and Cl = 0.35, but the calculations have been made for Mq = 0 and a = 0. The wing has a simple planform and thickness distribution but the camber and twist distributions are complicated, with a. j. = 7° at the wing centre, aT = 2° around mid-semispan, and aj = 0 at the tips; the camber is strongly negative at the centre and strongly positive at the tips. It will be seen from Fig.

4.26 that the chordwise pressure distributions calculated by Sells’s method (circles) agree well with those calculated by Roberts’s method (full lines).

The dashed lines show the results of linearised theory. The computing times of Sells’s method are relatively low, about one third of those of Roberts’s method and, perhaps, two or three times those for the calculations according to linearised theory.

An alternative, method is to represent the surface of the aerofoil by vortex elements. This was first done by W Prager (1928) and then developed further by К W Jacob (1962) and D H Wilkinson (1967). A powerful and well-conditioned

surface-vortex method is that of T Seehohm & В G Newman (1975). Rubbert’ s method has also been extended into a more powerful and rapid tool by F T Johnson & P E Rubbert (1975), which requires fewer panels to reach the same accuracy

Threedimensional sweep effectsLIVE GRAPH

Click here to view

Подпись: Fig. 4.26Pressure distributions over a sweptback wing. After R C Lock (1975)

as the earlier method. Either sources or doublets may be put on curved panels, and the strengths of the singularities vary as polynomials. No special pre­cautions are taken near leading edges, kinks, or junctions, and so uncertain­ties are likely to arise in these regions. The method may be used for analy­sis as well as for design. J L Hess (1973) has extended the method of A M 0 Smith to include higher-order terms. It may not be unreasonable to expect that many of the present methods, with the emphasis firmly on the numerical aspects, will be developed further, with more attention paid to the physical features of the flows, as is done in the RAE Standard Method.

All these numerical methods need to be accompanied by suitable programs to des­cribe or to generate the geometry of the configuration, not only for analysis but also for design (of windtunnel models and of real aircraft). More work is needed to arrive at numerical programs which are consistent and coherent, flex­ible and adaptable, for practical purposes.

There is a whole field of work concerned with unsteady flows past wings and with the aeroelastic behaviour of deformable wings and bodies. A discussion of these problems goes beyond the scope of this book, and we refer to some re­cent AGARD publications (1971) and to E C Pike (1971) and to H G KUssner (1973) for theories of oscillating wings. Fundamentals of aeroelasticity have been dealt with by H W FSrsching (1974). В A Hunn (1952) applied the concepts of the RAE Standard Method to derive a method for estimating the loading on an elastic airframe.

Previous Page

the attachment line along the leading edge and near the separation line along the trailing edge also off the wing surfaoe. A solution may be regarded as accurate only if it can be shown that, for example, the attachment surface is a continuous streamsurface and intersects the wing along a continuous attach­ment line and, further, that the neighbouring streamsurfaces are also conti­nuous and do not intersect the attachment surface. No method has as yet been tested in this way and, in this sense, no "exact" solution exists for three­dimensional wings, apart from those for non-lifting ellipsoids by H Lamb (1932) and К Maruhn (1941).

Comparing the classical approximations described above with numerically exact solutions, obtained by iteration, we find typically that the approximate loading is slightly too high near the wing tips and that, as a consequence, the overall lift slope may be too high, by nearly 4% in some cases. We may infer that the cause of this error lies mainly in the assumption made in (4.51) and not so much in the many other assumptions or in the interpolation procedure. Thus (4.71) for the chordwise loading can only be approximately true and the aerodynamic centre does not remain at the same chordwise position all along the span, as it would according to (4.72). One could say that there is a threedimensional "small-aspect-ratio effect" in the tip region, moving the loading further towards the leading edge as a consequence of a larger contri­bution to the downwash from the streamwise component of the vorticity distri­bution over the wing. On these grounds, G G Brebner et at. (1965) have pro­posed that the parameter n should depend not only on the aspect ratio but also on the spanwise station y/s. Their modified relation, replacing (4.79), improves the results.

An extension to swept-winged aircraft

4.2 The considerations so far are consistent with an aircraft with unswept wings, that is, where the wings ex­tend essentially at right angles to the direction of flight. This is an un­necessarily severe restriction: sweeping the wings backward or forward through

an angle ф (so that the main lateral axis of the wing is no longer at right angles to the flight direction, where 9 = 0 designates an unswq>t wing) leads to aircraft which still conform to Cayley’s design principles and widen the operational capabilities of the classical type to a considerable extent. The main restriction which is removed by sweep is that on top speed. As already explained in Section 2.3, the physics of compressible flows leads to a change in the type of flow when the critical Mach number is exceeded anywhere on the wing, which is bound to happen at a certain speed. This defines the intrinsic
boundary of the classical type of flow and hence of the classical type of air­craft, although we have already seen that we may go some way beyond this boun­dary and allow local supersonic regions without upsetting the main character­istics of the classical aircraft.

There are three distinct physical effects which are associated with sweep and which can shift the boundary of the classical type of flow to higher flight Mach numbers. These can all be explained on the basis of the concept of a swept wing of infinite aspect ratio, the infinite sheared wing (see e. g.

D Klichemann & J Weber (1953), J A Bagley (1962). A sheared wing is obtained by shearing backward (or forward) every section of an unswept aerofoil, leaving its shape and lateral position unchanged.

For an infinite sheared wing, as sketched in Fig. 4.5, we introduce a coordi­nate system £, n, C, which is related to the rectangular system x, y, z with x in the streanwise direction by

5 * X COS9 – у 8ІПф

n = x sinq> + у cosq> >• (4.13)

? = z.

An extension to swept-winged aircraft An extension to swept-winged aircraft

The flow past a sheared wing of infinite span can be regarded as that past a

Fig. 4.5 Infinite sheared wing Fig. 4.6 Streamlines over parts of a

(left) and complete sweptback wing swept wing in planview

(right) twodimensional aerofoil put in a uniform stream with the velocity components

Подпись: VgQ “ VQ cosq> cosa VnQ = V0 sincp cosa L VC0 = v0 sinot * (4.14)

If the flow is inviscid and if the perturbations are small, then the cylindri­cal sheared wing is a streamsurface with regard to the velocity component V^q along it and only the velocity components Vg and Vg are perturbed in the same manner as the components Vx and Vz in the flow past a twodimensional (unswept) aerofoil. This means that the streamlines over the sheared wing are curved in planview, as indicated in Fig. 4.6, and that there is a non-zero ve­locity Vq sin<p along the attachment line at the leading edge (where the two­

dimensional aerofoil has its stagnation point). This kind of threedimensional effect has a profound influence on many characteristics of sheared wings.

We now compare two wings of infinite span in an incompressible flow, a thin sheared wing and an unswept wing (suffix 0) of the same streamwise section shape at the same angle of incidence in a vertical streamwise plane. Consi­der first the velocity increments caused by the thickness of the wings. On account of (4.13), we find that the streamwise velocity increment is reduced by a factor cos<p :

An extension to swept-winged aircraftvx “ vx0 cos1) vy = – vx0 vz = vz0

Thus the suction over part of a thick sheared wing is always smaller than that over a twodimensional aerofoil of the same thickness-to-chord ratio in the streamwise direction. Consider now the velocity increments caused by the lift on the wings. The lift on both wings can be determined from the distributions of bound vortices according to the Kutta-Joukowski theorem. The vorticity vector y(x) is inclined at an angle ir/2 – ф to the mainstream so that the pressure difference is

-Ap(x) = pVq yOO созф, (4.16)

according to (2.45). The sectional lift slope is then

CL/ae * 2ir cosp, (4.17)

bearing in mind the arguments leading to (3.27), so that the lift decreases in the ratio

Cl/CL0 = C0S(|1 (4.18)

with increasing angle of sweep. The same result can be derived from (4.14) and the linearised theory described in Section 2.2. These characteristic re­ductions of the perturbation velocities due to thickness and due to lift are retained even when higher-order term are taken into account (see J Weber (1972), although they take a more complex form than the simple "sweep factor" cos?.

Подпись: v x An extension to swept-winged aircraft Подпись: (4.19)

The second sweep effect is concerned with the rate at which the perturbation velocities, or pressures, change with Mach number. We have already seen in Section 2.3 that small perturbations in compressible flows may be regarded as scaled-up, or stretched, values of those in a corresponding incompressible flow, according to the Prandtl-Glauert procedure (2.35), (2.36), and (2.37). If applied to infinite sheared wings, this procedure gives the change of the streamwise perturbation velocity with Mach number as

where Vxoi is the value of vxq for the corresponding twodimensional aero­foil in incompressible flow. Hence the pressure coefficient varies as

Cp “ ~2vx – <1 " «О2) vx2 <A-20>

according to linearised theory. We find that the perturbation velocity varies more slowly with Mach number as the angle of sweep is increased.

The third sweep effect is concerned with the mainstream Mach number at which

An extension to swept-winged aircraft An extension to swept-winged aircraft

local velocities or pressures reach critical conditions somewhere on the wing and thus lead to a change in the type of flow and the development of local supersonic regions. Mathematically, the equation of motion then changes from the elliptic to the hyperbolic type. For an infinite sheared wing, the motion in the Eulerian description is governed by (2.2), which can be written in the form

Подпись:(see R Courant А К 0 Friedrichs (1948)). This is equivalent to, _ (Эф/Э£)2 + (Эф/Эг)2 o 0 _

An extension to swept-winged aircraft

Now,

The criterion for critical conditions can be generalised and applied to local conditions by introducing the concepts of isobars, i. e. surfaces joining points where the pressure, or the supervelocities, are the same. On a swept wing of arbitrary shape, the isobars on the wing surface are, in general, curved»and critical conditions can be said to be reached when the local velocity compo­nent normal to the isobars, i. e. in the direction of the local pressure gradi­ent, reaches the local velocity of sound. This is a conjecture by W G Bickley

(1946) , who stated the criterion in these terms and went further to suggest that, once the critical velocity is exceeded, a continuous steady irrotational flow is impossible and discontinuities in the form of shockwaves can be expec­ted to occur. Bickley’s criterion has been confirmed in many experiments, but theoretical and experimental evidence has been produced in the meantime, which shows that continuous shockless compressions may also exist in twodimensional inviscid flows (see e. g. G У Nieuwland & В M Spee (1968), G Meier & W Hiller

(1968) ). These matters will be taken up again in Section 4.8.

The criterion (4.25) for critical conditions can be expressed in terms of the local velocity, the mainstream Mach number, and the isobar sweep, using (2.3) for the local velocity of sound:

An extension to swept-winged aircraft(4.26)

An extension to swept-winged aircraft Подпись: (4.27)
An extension to swept-winged aircraft An extension to swept-winged aircraft An extension to swept-winged aircraft

Alternatively, we can introduce the static pressure from (2.11) and the total head „

An extension to swept-winged aircraft Подпись: (4.28)

and obtain a critical pressure ratio

1 +ГТ1мо

Подпись: P* ~ P0 ^ovo An extension to swept-winged aircraft Подпись: (4.29)

Finally, we can define a critical pressure coefficient

Подпись: 0.528
An extension to swept-winged aircraft

We note that (4.28) indicates that, the air can expand further over a swept wing than the well-known St Venant expansion which gives for the pressure ratio

Подпись: Cp Fig. 4.7 Pressure changes with Mach number on infinite sheared wings. Biconvex section, t/c - 0.1, a * 0

for у » 1.40, which applies to an unswept wing.

The three physical effects of sweep are illustrated in Fig. 4.7 for the simple case of a non-lifting infinite sheared wing. It can be seen very clearly how an increasing angle of sweep reduces the supervelocities at Mq * 0 (points A), how the pressure rise with Mq gets flatter, and how this process can be

LIVE GRAPH

Click here to view

The Aerodynamic Design of Aircraft

carried further until the critical pressure is reached (at point B). Thus, in principle, the mainstream Mach number of unity has no special significance for infinite sheared wings, and sweep is seen to be a powerful means for extending the speed range of the classical aircraft up to and beyond the sonic flight speed.

We can demonstrate the main effects of sweep again in a more practical way by considering the main design parametersi thickness-to-chord ratio t/c, lift coefficient Cl at cruise, angle of sweep q>, and flight Mach number Mq, still for the ideal case of an infinite sheared wing in a way that has first been done by J A Bagley (1961). In accordance with (4.15) and (4.18), we

An extension to swept-winged aircraft

Fig, 4.8 Values of angle of sweep and Mach number that correspond to three different design pressure distributions

consider a family of wings with

t/c * 0.1 cosq> and CL ■ 0.4 cos<p.

The main choice left open is then the design pressure distribution or, as in the case illustrated in Fig. 4.8, the distribution along the wing chord of the local Mach number component Mq normal to the direction of sweep. Three typical distributions have been chosen: two wholly-subcritical rooftop distri­butions (corresponding to RAE 101 and 104 aerofoil sections), designated (a) and (b), and one with a local supercritical region extending up to Мд s 1.4 and terminated by a shockwave at x/c =0.6, designated (c). The curves in Fig. 4.8 relate the values of the mainstream Mach number and of the angle of sweep at which these distribution are obtained over the upper surface of in­finite sheared wings. We find that some sweep is needed to fly beyond about Mo = 0.7 and that the flight speed can be higher, the higher the angle of sweep. Roughly, to reach the flight Mach number of unity requires about 45° of sweep for subcritical wings and about 30° if an effective supercritical wing could be designed. To reach Mq = 1.2 (the highest Mach number at which sonic bangs at ground level are likely to be avoidable) requires about 55° sweep for subcritical wings and about 45° for supercritical wings. If one wanted to reach Mq – 2, one would have to consider wings of about 70° sweep. The simple relation

Mq = 0.7/ cosip (4.30)

gives a fair approximation of the general trend (dashed line in Fig. 4.8). In practice, there is an additional trade-off between?, t/c, and and much

depends on the actual design of the threedimensional wing. These matters will be discussed in Chapter 5.

We can now proceed to a simple first-order analysis of the performance of a family of complete aircraft. All the members of the family are considered to be classical wing-fuselage combinations and to have the same fuselage and tail – plane. They have a finite span, but we still use the relations derived for infinite sheared wings. They are designed to fly at different speeds and thus the angle of sweep of the wing is varied according to the flight Mach number (the suffix 0 denotes the unswept member of the family). This variation may follow (4.30):

M = Mq/ cos<p (4.31)

if we postulate as before that t/c “ (t/c)g cos? and C^ = C^q cos? . The wings can then be made to have the same planform area, structural depth, panel length and breadth, so that the members of this family may be thought of as one aircraft with a wing of variable sweep. The aspect ratio then decreases in proportion to cos2? :

A = Aq cos^? ; (4.32)

but the weight of the wing structure may be taken to be the same for all air­craft, to a first order. The overall weight W and the wing loading W/S are then also the same.

This family of swept aircraft has some remarkable properties. (4.31) implies that all aircraft are designed to the same aerodynamic standard and, according­ly, the values of Cpp and Ky in (3.42) may be assumed to be independent of sweep angle and speed. If we also assume that all aircraft cruise at the same value of n (which will be shown to be justified a posteriori), we find from

(4.3) that the lift-to-drag ratio at cruise is

L/D = (L/D)0(A/Aq)* = (L/D)q cos? = (L/D)0M0/M (4.33)

by (4.31) and (4.32). Thus the value of ML/D remains the same for all air­craft of this family, which implies, with L = W = constant, that the drag in­creases only linearly with design Mach number from one member of the family to the other: D = D0 M/Mq , (4.34) instead of increasing roughly quadratically, as one would expect for each mem­ber by itself. This remarkable fact is the reason why this family of swept aircraft is unique among all known means of transport and follows exactly the limiting line postulated by G Gabrielli & Th von Karman (1950), which has been discussed in connection with Fig. 1.6.

We note that the analysis is self-consistent in that inserting A from (4.32) into (4.5) leads again to (4.18). The latter can be written in the form

Подпись:,, тЛ M

An extension to swept-winged aircraft

(lev )Q ^

and can conclude that this type of engine can indeed provide the thrust needed to overcome the drag given by (4.34). This shows how closely swept-winged aircraft are associated with turbojet propulsion. When A Busemann first pointed out the existence of a sweep effect in 1928, no practical application could be found because turbojet engines were not yet available. The time was ripe for successful developments of both swept wings and jet engines in 1940, when A Betz suggested the use of swept wings for the purposes described here, supported by convincing windtunnel measurements by H Ludwieg & H Strassl (1939). It then took only a few years for swept jet aircraft to fly and for H Dittmar to reach sonic speed in a Me 163 aircraft (with rocket propulsion), designed by A M Lippisch, in 1942.

Подпись:the members of this family must fly at different heights. The term = Po i® a function of height only, decreasing with increasing By (4.35), this varies as

An extension to swept-winged aircraft(4.37)

so that the cruising height is increased as the cruising Mach number is increased.

We note that this implies that the Reynolds number per unit length then re­mains the same for all members of this family of aircraft (see J Y 6 Evans & C R Taylor (1971)).

An extension to swept-winged aircraft An extension to swept-winged aircraft

With turbojet propulsion, we may assume that the specific fuel consumption remains constant;

according to (1.13), so that (4.38) simplifies to

WF/WF0 " R/R0 * (4*40)

using (4.36). (4.38) implies that the propulsive efficiency increases in pro­

portion to the Mach number:

у V = M/Mo • (4,41)

This is reasonable to expect for turbojet propulsion because both the jet efficiency and the thermal efficiency should improve with increasing speed: the former because the excess velocity in the jet may become smaller, the latter because the ram effect may increase the pressure at which heat is added to the airstream through the engine (see also Fig. 1.1). It is then consistent to assume that the thrust increases required by (4.36) can be achieved without in­creasing the engine weight: this follows from (4.8), inserting from (4.18) and L/D from (4.33).

Lastly, we can determine the range andpayload fraction of this family of air­craft. The range which they reach at their respective design Mach numbers is obtained from Brdguet’s relation (1.7):

R

Подпись:With (4.41), (4*33), and (4.40), this can be rewritten as

JL . “(‘ – V“) «.*»

*° “ {‘ – "po/■ іУ

which has the solution R – Rq, independent of WFq/W. We thus find that all the aircraft of this family achieve the same range, whether they are swept or not. Sweep га primarily a means for reducing the flying time for a given range.

To a first order, the payload of all these aircraft is also the same since structure weight, engine weight, and fuel weight are the same and the weights of the systems and services may be assumed to be the same. Hence, the direct operating costs are the same, if we ignore the usually favourable effects of increased speed on the productivity or on the number of aircraft required to cope with a given volume of traffic. For this family, in this approximation, speed is obtained at no cost: one pays only for the distance, not for the speed at which one travels, – a unique advantage, which, to this extent, only aviation can offer.
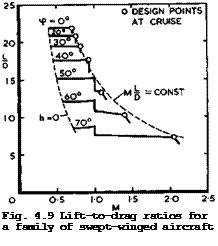
Подпись: Fig. 4.9 Lift-to-drag ratios for a family of swept-winged aircraft

As will be seen below, there are many design restrictions on real aircraft, which lead to shortcomings and prevent the ideal values derived above from being achieved. The analysis presented should, therefore, be regarded as a guide and as a framework which explains what the main physical effects are and how they can be exploited and how the large number of aerodynamic, pro­pulsive, and structural parameters hang together, to a first order. However, even the numerical values obtained are surprisingly less inaccurate than might be expected, as can be seen in a typical example for a more realistic family of transatlantic aircraft with about 150 seats in Fig. 4.9, for which the aero­dynamic properties have been estimated not only as for infinite sheared wings but in more detail. The full lines in Fig. 4.9 take account of skin friction and form drag as well as of a wavedrag due to fuselage volume (shown for

LIVE GRAPH

Click here to view

The Aerodynamic Design of Aircraft

simplicity to come in at Mq * 1 instead of slightly below that) and of a wave – drag due to lift for supersonic flight Mach numbers, in addition to vortex drag, according to (3.46). The wings are assumed to be designed conservative­ly to have subcritical flow up to Mq * 0.7/совф, as in (4.31), and to have a steep dragrise beyond that. It can be seen that the design points at cruise lie quite close to the line MqL/D = constant = 15 of the first-order analysis. There is thus a remarkable consistency within this family of swept-winged aircraft, provided they can be designed to have the characteristics of infinite sheared wings at cruise.

Fundamental conflicts arise when the low-speed flight conditions near the air­field are considered. On the left of Fig. 4.9 is a limiting line along which, if the present analysis is applied throughout, the flying altitude h = 0, i. e. the aircraft would hit the ground at speeds which are far too high to be acceptable for take-off or landing. A different analysis and different means for generating lift are, therefore, required to cover these conditions (see e. g. J Williams (1972) and Section 4.7). Here, we reproduce in Fig. 4.10 the

An extension to swept-winged aircraft

Fig. 4.10 Possible lift-to-drag ratios of a transport aircraft at different flight conditions (schematic)

L/D-values which a typical transport aircraft of moderate sweep may have at cruise and also those required at take-off and landing, which correspond to Сттяу-values to be reached, for the case already shown in Fig. 4.1. Also shown in Fig. 4.10 is a shaded area within which those L/D-values may lie, which correspond to CT v-values at low speeds that might be reached by the same single aerofoil used for the cruise design. As will be discussed in Sec­tion 4.7, the actual values within this area depend on whether the aerofoil is thick and exhibits a thick-aerofoil stall or whether it is thin and exhibits a thin-aerofoil stall. In the latter case, lift is produced without a suction force at the leading edge, for a range of C^-values, We find that, whatever the wing shape, the required values of L/D and of CTtti^y are not likely to be reached by a wing which retains its geometry: some change in wing loading might bring the required and the actual curves closer together but, in princi­ple, some high-lift devices or variable geometry will be needed to resolve this conflict. It is interesting to note that this conflict was realised very early: A M Lippisch was granted a patent on wings with variable sweep in 1942, and E von Holst flew models with various arrangements of variable sweep at about the same time.

In general terns, we may conclude that classical and swept-winged aircraft form one aerodynamic family with characteristic features which make them suitable to be flown over a network of routes of different ranges. If future developments tend to limit the flying time to about 2 hours, say, then the main application of this type of aircraft will be to short and medium ranges, up to about 3000 km if low supersonic speeds will be achieved or up to about 5000 km if it should prove possible to design an efficient swept aircraft for Mq = 2 , The potential of this type of aircraft has by no means been exploited to the full, neither in the fixed-wing nor in the variable-sweep configurations.

4.3 Classical wing theory and some extensions. Most of the properties of swept wings have been derived so far on the highly-idealised assumption of a sheared wing of infinite span, and the classical theory of unswept wings of large aspect ratio described in Section 3.2 has also been based on assumptions which are at best plausible. We need to discuss, therefore, some more rigor­ous approaches to the theory of threedimensional wings of large aspect ratio. This will be done in such a way that the flow models and the physical pheno­mena involved should come out clearly. Thus the emphasis is not so much on providing just numerical answers but on deriving approximations which have some physical meaning and give some physical insight. Whenever possible, we shall show how these approximations can be improved and numerically exact results obtained, but we shall find that some important properties, which we ought to be able to predict, cannot be calculated with reliable accuracy so that, in the end, we shall have to rely on experiments.

The theoretical approaches will, in general, be based on the method of singu­larities, because this will allow both twodimensional and threedimensional flows to be treated in a similar manner. The generality of a calculation method is an important aspect in this case because any restrictions on its applicability (e. g. to twodimensional flows only) may reduce the practical value of a particular method considerably. At the present stage, it is also an advantage if a method can provide a framework which allows the incorporation of empirical factors in such cases where a problem appears insoluble with the means presently available. We want to provide a balanced framework of methods, which can take account of all the effects that contribute significantly to the final answer, rather than some special method which can deal only with one or two of the effects, however accurately. What we want to try to avoid here is the imbalance of much of the work done so far in concentrating on twodimen­sional aerofoils and on incompressible inviscid flows, i. e. on those problems which are most amenable to a mathematical treatment.

The use of singularities implies that we shall deal separately with the effects of thickness and of lift and represent the former by suitable distributions of sources and sinks and the latter by vortex distributions. Basically, we apply the method of linearisation, as described in Section 2.2. This means that, in general, the singularities are not placed on the surface of the body but inside the body on the chordal surface.

We begin with a non-lifting, symmetrical, unswept wing in an inviscid incom­pressible flow. In a first approximation, the chordwise velocity distribution at any spanwise station of a wing of large aspect ratio may be regarded as the same as that over an aerofoil which extends to infinity on either side of that station. The velocity increment induced along the chord is then given by (2.25) for any given section shape z(x). For a wing of finite aspect ratio,

Подпись: 122
Подпись: vx(x,y,0) Подпись: 0 -s
Подпись: with
Подпись: s < у < +s, the velocity increment is given more accurately by c +s dz(xf) ,,, , dx' ГҐ і'*2 * / іч2 тЗ/2 dx dy • L(x-x') + (y-y1) J '
Подпись: (4.43)

The integrations in (2.25) and (4.43) can be performed explicitly for certain section shapes, such as ellipses and biconvex sections formed by parabolic arcs. For general section shapes, or when z(x) is specified only numeric­ally, numerical solutions may be obtained by a method due to J Weber (1954) or quite readily by existing computer programs.

An extension to swept-winged aircraft An extension to swept-winged aircraft

To replace the velocity increments on the wing surface by those on the chord – Ыпе is not always an adequate approximation. For example, the normal velo­city component differs appreciably from qV0/2 , (2.21), near the tip of a wing. That this must be so can be seen from Fig. 4.11, which shows the velo­city induced by a parallel strip of semi-infinite length normal to the main­stream and covered with a uniform distribution of sources. It will be seen

Fig. 4.11 Normal velocity induced Fig. 4.12 Streamlines of a source by a semi-infinite strip covered element of finite span

uniformly with sources

that vz/Vq is always smaller than q/2 when z ф 0 and that it falls to about half that value at the tip (y = 0). For z = 0, vz jumps discontinu­ously from q/2 at у > 0 to q/4 at у * 0 and to 0 for у < 0. The

reduction of vz is accompanied by the existence of a lateral velocity com­ponent vy . This can be seen from Fig. 4.12, which shows the streamlines in

a vertical plane induced by a strip of sources of finite span, and which is a

counterpart to the corresponding vortex flow in Fig. 3.2(b). The streamlines are turned outwards near the tips and the farfield is like that of a single source line at the centre, that is, like that of a body of revolution. The existence of this crossflow component adds considerably to the difficulties encountered in an analytical treatment of the flow near wing tips. The cross­flow will produce a wing shape which thins down towards the tips, compared with the corresponding twodimensional aerofoil section, and which also bulges out beyond the line where the source distribution ends, again similar to a body of revolution. Thus, to produce a rectangular wing with a square tip re­quires a certain increase in the strength of the source distribution towards the tip. In such a flow, it is difficult to ensure that the source distribu­tion is such as to generate a closed contour, i. e. to prevent any local inflow or outflow. This difficulty arises whether the source distributions are

placed within the wing or on its surface. The threedimensional tip effects may be localised on wings of large aspect ratio and spread inwards only about half a chord or so, but they nevertheless invalidate linearised theory in that region. The velocity increment must then be expected to lie between the full twodimensional value according to (2.25) and half that value. For a rough practical approximation, the value at the tip may be taken as about 0.7 times that from (2.25). Similar effects occur on wings of small aspect ratio in a more pronounced form. Thickness taper, whereby the wing thickness is reduced towards the wing tips, also has a distinctly beneficial threedimensional effect in that it reduces the supervelocities below the twodimensional value (see J Weber (1954) and К W Newby (1955)).

The approximation

V(x, y) = Vx(x,0) = V0 + vx(x,0)

for the velocity along the surface of the wing is also not adequate in most practical cases, especially near the attachment line along the nose of the wing. Again, it is difficult to ensure the right behaviour near the attach­ment line and, in particular, to prevent any local inflow or outflow, whether the sources are placed inside the wing or on its surface. A very good approxi­mation, based on linearised theory, can be obtained by making use of the fact that the circulation around the aerofoil is zero. Thus both the line integral of the velocity along the contour and that around the sources on the chord line must be zero:

Подпись: fПодпись: V(x,z)dsПодпись:dz(x)2 = 0

and

V (x,0)dx = 0

If the assumption is now made that

V(x, z)ds = Vx(x,0)dx

Подпись: V(x.z) V„ Подпись: dz(x1) dx' dx' x - x* Подпись: (4.44)
An extension to swept-winged aircraft

for any elemental part of the section, we have

instead of (2.25). This relation makes the solution uniformly valid up to the leading edge. It is strictly correct for aerofoils with elliptic cross sec­tions; it gives a good approximation for arbitrary shapes up to thickness-to – chord ratios of about 20% (see e. g. F Riegels & H Wittich (1942), F Riegels (1948) and (1961), J Weber (1953)). The "Riegels factor" in (4.44) can also be applied more generally to (4.43), as an approximation. The relations (4.43) and (4.44) can readily be extended to apply also to cambered aerofoils and to lifting and swept wings (see J Weber (1953)). Thus the thickness problem may be said to have been solved satisfactorily, except for the tip regions of a wing, which have received little attention so far and where a well-proven and reliable method has not yet been provided.

We turn now to the problem of a lifting unswept wing of high aspect ratio, again in incompressible flow. Consider first a thin wing, with the wing and

Подпись: v(r) An extension to swept-winged aircraft Подпись: (4.45)

its near-planar wake represented by a vortex distribution of strength > as discussed in Section 3.2. The velocity induced by the vortex distribu­tion at a point £ on the sheet is given by Biot-Savart’s relation

where a prime denotes a general value on the sheet. In principle, for steady flows, both the shape of the free part of the sheet and the distribution of the streamwise and bound parts of the vorticity on the wing may be determined by the three following conditions: 1 The velocity normal to the sheet is zero. This is made up of the compon­ents of v from (4.45) and of the mainstream velocity Vq.

2 Ap is zero on the free part of the sheet. This condition is obtained from (2.44) with AH – 0 , where Vs is made up of the components of v from (4.45) and of Vq in the tangential plane of the sheet.

3 The Kutta-Joukowski condition requires that Ap = 0 at the trailing edge.

The possibility of obtaining general solutions along these lines is obviously remote. The approximation introduced by F W Lanchester (1915) and by L Prandtl (1918) brings in drastic simplifications: it is assumed that both the wing

and the trailing vortex sheet lie in the plane z = 0 parallel to the main­stream, and that the induced velocity v is small in comparison with Vo. Thus the vortex model used here to obtain a more refined calculation meTKod is the same as that for the simpler method described in the Section 3.2 and does not in itself represent any improvement.

Подпись: Fig. 4.13 Horseshoe vortex element

Thus the equations of motion are linearised. Their use can be simplified by the introduction of the so-called horseshoe vortex element, as shown in Fig. 4.13. Each element of area of the wing surface, dx’dy’ , is assumed to

contribute to the total sum of vorticity a vortex line, of strength ydx’ , which contains a bound part and then stretches to infinity downstream. The load per unit area on the wing surface due to the bound part of this element is obtained from (2.46) and is usually put in the form

*(x, y) — = ТГ – Y(x, y) . (4.46)

К °

With wing and wake made up of such elements, all the integrals derived below are then to be taken over the surface S of the wing only.

Подпись: 8z(x,y) Эх An extension to swept-winged aircraft Подпись: (4.47)

For this simplified model, the conditions described above are fulfilled automatically on the trailing vortex sheet and, for a wing of given shape z(x, y) , the linearised boundary condition on the wing reads

Подпись: «(y) Подпись: vz(x,y) Подпись: (4.48)

For simplicity, we consider only uncambered wings here, at same angle of incidence u(y) , so that

Подпись: vz(x,y) Подпись: fc(x',y*) (у - у’Ґ An extension to swept-winged aircraft Подпись: dx'dy' , (4.49)

It then remains to relate the downwash vz(x, y) on the wing to the loading over its surface. With (4.45) and (4.46), the downwash at a point P(x, y,0) can be written in the form

An extension to swept-winged aircraft Подпись: J_JL ff A(x'.y') 8ir Эу JJ У - У' S An extension to swept-winged aircraft Подпись: (4.50)
An extension to swept-winged aircraft

which has been derived in different ways by L Prandtl (1936), E Reissner (1944) and A H Flax & H R Lawrence (1951). The latter gave the equivalent form

An extension to swept-winged aircraft

which we prefer here since the integral involves only a Cauchy principal value; the higher-order singularity in (4.49) is more difficult to handle, although H Multhopp (1950) has defined a principal value to be taken at the singularity у = y’ . We follow here a method derived by D KUchemann & J Weber, which is described in В Thwaites (1960) (see also D KUchemann (1952)).

An extension to swept-winged aircraft An extension to swept-winged aircraft An extension to swept-winged aircraft
An extension to swept-winged aircraft

in the downwash equation (4.50). This clearly cannot hold for the region around у = y’ , but the error may not be serious as long as dC^/dy varies only a little. We expect, therefore, that the errors will be greatest near the wing tips, but the fact that Cl tends to zero at the tips may have a mitigating effect. However, we shall see below in Section 4.7 that the vortex model used here may be inadequate itself near the wing tips. (4.50) can then be written as

J – – L ff dx. dy. + _L f *(Х’»У> dx.

Подпись: vz(x,y)Подпись: (4.52)8ir Эу Jj у – у’ dx ay 4ir J x – x’ dx 8 *L

According to the boundary condition (4.48), this is a function of у only. The first integral in (4.52) is already a function of у only and hence the second integral must also be a function of у only:

. . .

This is an integral equation from which the dependence on x of the loading function £(x, y) can be determined without a knowledge of the spanwise load distribution. The function F(y) may be interpreted as being related to the downwash induced by the bound vortices, as in (3.26):

Подпись: Is± = _LF(y) = -L f *(-X-'_L?>- dx. v0 4ir <‘y' 4i j x-x’ ‘ ‘ (4.53)

*L

Подпись:

Подпись: which becomes Подпись: Л(х.У) Подпись: fCL(y> An extension to swept-winged aircraft Подпись: (4.54)

Cauchy’s principal value must be taken in the integral. The solution of (4.53) is

if the Kutta-Joukowski condition Л(х^,у) =0 is to be satisfied and the sec­tional lift coefficient

x-r(y)

cL<y> = ^7 J *(x, y)dx (4*55)

xL^y>

introduced, so that F(y) = 2C^(y). We have now derived what had only been assu­med before – in (3.26) and (3.27) in Section 3.2 – namely, that flat wings of finite span but of large aspect ratio have the same ohordwise loadings as the twodimensional flat plate, at all spanwise stations. Corresponding results can be derived for cambered wings, where the series of loading functions of W Bimbaum (1923) can be introduced, of which (4.54) is the first term.

Подпись: “(y) Подпись: 2? <г<»> - An extension to swept-winged aircraft

To find the spanwise loading, we insert £(x, y) from (4.54) into (4.52) and observe the boundary condition (4.48). This gives

Integrating by parts and demanding that C^(y)c(y) vanishes at the wing tips, we find

(4.56)
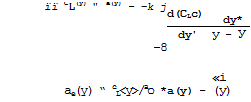
Подпись:(4.57)

in accordance with (3.25). This is Prandtl’s classical aerofoil equation.

For an uncambered wing, it connects a(y), c(y), and CL(y), and it is norm­ally regarded as an integral equation for Ci,(y). (3.34) gives the particular solution for an elliptic wing according to (3.35). The complete solution for the loading over the whole lifting surface is found by combining the spanwise loading Cx,(y) from (4.56) with the chordwise loading £(x, y) from (4.54).

The analysis can be repeated for cambered and twisted wings where a may be regarded as a function of x and у. respectively. The resulting loading £(x, y) is then again of a form similar to that of (4.54) but with the function of x replaced by that which corresponds to the chordwise loading of the two­dimensional cambered aerofoil section. The spanwise loading is again deter­mined by (4.56), where it is possible to replace a by a function of у alone; but a(y) must then be measured from the direction along which the mainstream does not produce a lift force on the twodimensional cambered section, that is, from the no-lift angle.

The solution (4.54) allows the sectional pitching moment of the uncambered wings to be determined once and for all. The pitching-moment coefficient in the direction of increasing angle of incidence, referred to the leading edge x = xL(y), is found to be

*T

Подпись:Подпись:cm(y)

for each section. This gives, for the particular loading (4.54),

Cm(y) = – iCL(y) . (4.59)

Cm is negative, i. e. this is a nose-down moment. (4.59) implies that the same sectional pitching moment can be obtained from the resultant sectional lift force put at the distance of a quarter of the local chord behind the leading edge, i. e. the position of the aerodynamic centre is

xac/c = " Сш’Сь = І

at all spanwise stations.

There were numerous early attempts to solve the aerofoil equation (4.56). The first successful method, for rectangular wings, was obtained by A Betz (1919), who assumed the spanwise loading to behave like (1 – (y/s)2)J near the wing tips, which is still used in most numerical approaches. Exact solutions have been given by H Schmidt (1937), (1938) and his collaborators, while N J Musk- helishvili (1946) has treated (4.56) from a more formal mathematical stand­point. E Trefftz (1921) introduced the use of Fourier series, and this method was extensively applied by H Glauert (1926). The earlier methods have been reviewed by I Lotz (1931), A Betz (1935), and by Th von Karman & J M Burgers (1935), among others. A very successful numerical treatment was introduced by

H Multhopp (1938) (see e. g. В Thwaites, Section VIII.19, 1960). Modern num­erical procedures allow solutions to be obtained in a very short time on com­puters. Special extensions of Multhopp’s method needed to deal with discon­tinuities in wing chord, or sectional lift slope, or angle of incidence have been developed by J Weissinger (1952) and J Weber (1954).

An important aspect of this derivation of the classical aerofoil theory is that it is possible to split the basic integral equation (4.50) into two equa­tions: (4.53) for the chordwise loading, and (4.56) for the spanwise loading. Thus the loading over the whole lifting surface is obtained, and it is quite mistaken to call classical aerofoil theory a "lifting-line theory" in contrast to other "lifting-surface theories". The concept of a single lifting line on which all the bound vorticity is concentrated could be used to derive the re­lation for O£o » i. e. the integral in (4.56), but not the complete equation and not (4.53) either. This is an almost universally accepted mistake which originates from Prandtl (1918) himself. It has led to much confusion and to many misguided attempts at deriving improved lifting surface theories. To ob­tain a real improvement on classical aerofoil theory evidently requires a more accurate evaluation of the downwash equation (4.49) or (4.50), preferably on the surface of the thick wing, without invoking the assumption (4.51). What has colluded in sustaining this mistake for so long is the fact that the far – field of the flow past a twodimensional flat plate tends towards that of a line vortex at its quarter-chord point (see Fig. 3.3), and that the aerodyna­mic centre is located there, by (4.59).

The particular form in which the solution emerges justifies some potent con­cepts which were introduced in Section 3.2. We can rightly think in terms of separate contributions to the downwash from bound and from trailing vortices and hence of effective and induced angles of downwash, both of which can be regarded as constant along the wing chord, and correspondingly of effective and induced angles of incidence, ae and «j, as indicated in Fig. 4.14. The

An extension to swept-winged aircraft

Fig. 4.14 Angles and forces on a wing section

resultant air forces(in this potential flow) is then normal to the direction inclined at the angle ae. The fact that the chordwise loading is always the same as that of the correponding twodimensional aerofoil puts all the results obtained for twodimensional aerofoils as well as those of the theory of two­dimensional boundary layers at the disposal of threedimensional wing theory. Thus refinements to the thin-wing concept can be made in order to take account of wing thickness and of effects of viscosity from data for the corresponding twodimensional aerofoil. The dichotomy of classical wing theory and boundary – layer theory has dominated aircraft design for over half a century.

On this basis, methods for calculating the pressure distribution over thick twodimensional aerofoils, from an extension of (4.44) to lifting wings, or in a more general way by methods such as that by J Weber (1955), can be used to determine also the pressure distribution over threedimensional wings. The Riegels factor

1/(1 + (dz/dx)2)^

from (4.44) is then applied also to lifting wings to remove the infinite suc­tion pressure at the leading edge which obtains in first-order theory. Fig. 4.15 gives a typical example for the pressure distribution over a flat wing of large aspect ratio.

An extension to swept-winged aircraft

Fig. 4.15 Pressure distributions over an unswept flat wing of large aspect ratio

Within this framework, the sectional lift slope ад = Сі/ае = 2ir can be replaced by that for a thick aerofoil:

aQ = 2ir(l + t/c) . (4.60)

This is exact for elliptic sections when the Kutta condition is fulfilled at the rearmost point, and

aQ = 2ir(l + 0.8t/c) (4.61)

is a useful approximation for practical aerofoil sections with sharp trailing edge (see e. g. the example in Fig. 3.4). Correspondingly, we have for an in­finite sheared wing

a = 2ir(cos<p + 0.8t/c) , (4.62)

using (4.18). On the basis of Fig. 4.14, we can also expect that (3.30) for the normal and tangential forces should hold approximately for wings of high aspect ratio. Fig. 4.16 shows some results from experiments by L Prandtl &

A Betz (1920), which were designed to check the usefulness of (3.28) and (3.42) for correlating the properties of wings of different aspect ratios (in this figure, Cf is taken to be positive in the x-direction, as for a drag force, i. e. in the opposite sense as in Fig. 4.14). A series of rectangular wings of aspect ratios from 1 to 7 was tested. The wings were cambered and (3.30) must, therefore, be used in the more general form

CT–^S2 + e0®B + °DF (4*63)

(see D KUchemann (1940)), where ag is the no-lift angle of the cambered aero­foil section. The results in Fig. 4.16 show a remarkably good agreement with the prediction from classical aerofoil theory for aspect ratios between 5 and 7, which are of practical interest. Deviations become apparent only when the

aspect ratio is as low as about 3 or less, and these may be regarded as being caused by the fact that the chord is no longer small as compared with the span so that (4.51) is no longer a reasonable assumption.

To get some notion of how smatl-aspeat-ratto effects modify classical aerofoil theory, we reverse the inequality in (4.51) and assume that spanwise distances are small as compared with chordwise distances:

(У – У’)2 « (X – x’>2 . (4.64)

The downwash equation (4.50) then reads

Подпись: ±±[[ By JJ у - у* S An extension to swept-winged aircraftПодпись: <x,y)Подпись:

Подпись: Fig. 4.16 Overall normal and tangential forces on a series of rectangular wings. After Prandtl & Betz (1920)
An extension to swept-winged aircraft

(4.65)

An extension to swept-winged aircraft An extension to swept-winged aircraft Подпись: (4.66)

The term in square brackets has the value 2 for xT < x and is zero for Xі > x. This implies that the integration along x need be extended only from the leading edge, x s x^ , up to the plane x = constant; parts of the wing behind x* = x do not contribute to the downwash at x = x’. Hence,

where s(x) is the local semispan in the plane x = constant. The downwash is now in a form which can be manipulated further, and we refer here to the work of R T Jones (1946) on slender delta wings, from which the theory of wings of small aspect ratio originated (see also В Thwaites, Section VIII.12, I960). Some of the resulting properties which interest us here are as follows: the

load over a flat wing at an angle of incidence is

,,x”> ■ 1 <*•">

the spanwise loading is elliptic:

CL(y) = 4a |(1 – (y/s)2)* ; (4.68)

and the overall lift coefficients

CL = ітг A a, (4.69)

which is half the classical value obtained from (3.28) in the limit A -»■ 0.

The flow model we can have in mind, to give these results, is one where the concepts of bound and of streamwise vortices are be retained and where the bound vortices do not contribute to the downwash on the wing surface and the streamwise vortices provide the whole downwash:

ai= a = dK = 2aio • (4-70)

We find that this is twice the value of the downwash оцд on wings of large aspect ratio, (3.24), and equal to that in the Trefftz plane. In other words, any plane x = constant across a wing of small aspect ratio may be regarded as a Trefftz plane for the part of the wing ahead of it. Thus the general concept introduced for wings of large aspect ratio and, in particular, the angles shown in Fig. 4.14 can be used again in the case of wings of low aspect ratio; only the numerical values change. These similarities make it attrac­tive to derive a method for determining the properties of wings of •inter­mediate aspect ratios, between the limiting cases of very large and very small aspect ratios, merely by interpolation, without justifying precisely which in­terpolation function should be chosen, provided only the behaviour at and near either limit is correctly represented. Such a method has been developed by D Ktlchemann (1952), where further details may be found.

Подпись: A(x,y) Подпись: (4.71)
An extension to swept-winged aircraft

A suitable interpolation function for the loading, which includes the limiting cases from (4.54) and (4.67), can have the form

The parameter n is then a function of the aspect ratio, still to be deter­mined. The value n = J represents the limit A <*> and the limit n ■+■ 1 represents A 0. With this general loading, the aerodynamic centre lies at

^ – id – n) , (4.72)

which indicates the characteristic forward shift of the loading as the aspect ratio is decreased.

We retain the concepts of bound vortices and of streamwise vortices, part of which now lie on the wing, and also the corresponding downwash angles ae and 0£, with a = ae + ot£ , (4.57), as the boundary condition. But we can no longer expect that the downwash induced by the bound vortices will be constant along the chord. Therefore, we consider only its mean value over the chord, with vze formally taken from (4.53). With fc(x, y) from (4.71), this gives by integration

oe " C^(l – irn cot irn) (4.73)

and for the sectional lift slope

Подпись: (4.74)

Подпись: 0 1 - im cot irn

a – CL/oe = a

An extension to swept-winged aircraft

where the parameter ш is a function of the aspect ratio. The value ш = 1 represents the limit A -*■ » , and the limit ai 2 represents A -*■ 0. The variations with aspect ratio of both u and n must go sensibly together in this model of the flow and since ш = 2n in the two limiting cases, we assume

An extension to swept-winged aircraft

ш = 2n (4.76)

An extension to swept-winged aircraft An extension to swept-winged aircraft Подпись: (4.78)

We can now fulfil the boundary condition (4.57) on the average over the wing chord and obtain the overall lift slope

An extension to swept-winged aircraft

A suitable relation for the single interpolation function n(A) is

with a from (4.74). This relation has been used to calculate the overall lift slope of a series of rectangular wings, and the results in Fig. 4.17 (full line ) agree well with the experimental results of L Prandtl & A Betz (1920). This figure also demonstrates quite clearly how the actual wings in­terpolate between the solutions of L Prandtl (1918) and of R T Jones (1946). One is tempted to draw the general conclusion that interpolation between two good solutions is quite good enough, if suitable parameters can be found, and that heavy mathematical tools are not then needed.

Подпись: A Fig. 4.17 Overall lift slope of rectangular wings

Properties of Classical and Swept Aircraft

Подпись: «LFig. 4.17 also contains a curve due to H В Helmbold (1942), which is an inter­polation for the total lift only, based on results for elliptic wings. This approximation agrees quite well with results by W Kinner (1937) for a circular wing and by К Krienes (1940) for elliptic wings. N Scholz (1950) obtained similar results, and F W Diederich (1951) extended Helmbold*s relation to include sweep on the basis of the concept of an infinite sheared wing. Finally, D KUchemann (1952) included sweep and compressibility on the basis of (4.19) so that _

Подпись:Подпись: cos ^ irAAn extension to swept-winged aircraftПодпись: 2 cos An extension to swept-winged aircraft(4*82)

This is a useful relation for quick estimation purposes. It also indicates in which preferred combinations the main parameters appear.

The methods described above for determining the properties of thick lifting wings together form a framework which can be used for many, practical purposes, including the calculation of the pressure distribution over the whole wing.

This framework is sometimes described as the RAE Standard Method. Details of the actual calculation procedure are described in an ESDU Data Memorandum (see Anon (1963) and (1973)). A consistent theory including second-order effects has been developed by J Weber (1972). There is also a very large number of other methods for calculating the loading over wings, employing a great vari­ety of numerical techniques. In general, no new physical concepts or flow models need to be introduced, the classical model of Lanchester and Frandtl being retained, and the emphasis is on the numerical aspects. We refer here only to some od the more recent methods by H Schlichting & E Truckenbrodt (1959) and (1969), M van Dyke (1964), W Gretler (1965), P J Zandbergen et al.(1967),

H Schubert & W Wittig (1971), P Jordan (1973), H C Garner & G F Miller (1972),

H C Garner (1974), and С E Lan (1974). „

These approximate methods cannot be expected to give sufficiently reliable numerical answers in all practical cases. Therefore, the question arises of how any errors can be determined and subsequently rectified. Consider the case where the wing shape zw(x, y) is given and where first-order solutions

Next Page

q(l)(x, y) and Л^(х, у) for source and vortex distributions on the chordal plane of the wing, z = 0, are assumed to be known. We follow now a method developed by J Weber (1972) for checking and improving the accuracy of the RAE Standard Method. The singularities induce perturbation velocity components vx^, Vy(l), and vz on the surface of the wing, which, together with the components of the mainstream velocity Vq, should result in a vanishing velo­city component normal to the wing surface and hence make this into a stream – surface. If the wing surface is defined by F(x, y,z) = 0, then this stream – surface condition can be written in the form

Подпись: (4.83)V — + V — + V — =

x Эх у Эу z 3z

where Vx, Vy, and Vz are the components of the total velocity. With F(x, y,z) = z – г„(х, у), and restricting ourselves, for simplicity, to uncam­bered (but twisted) wings at an angle of incidence a(y) in symmetrical flow, we have

Подпись: 3z (x,y) w Эх

1 3zw(x, y) |VQ cos a + vx(x, y,zw)j + ц

V (X, y,z ) = V. sin a + V (x, y,z )

…. (4.84)

where the perturbation velocity components are used again. This is a general form, of (2.9) for threedimensional wings. If the approximate values of vx* ^, Vy 1 , and vz(l) are inserted into this relation, the error resulting from the various approximations can be determined, in principle in the form Az(x, y) of the difference between the given shape and that obtained from (4.84) when the approximate velocity components are used. This provides a valid check on the accuracy of any approximate method, and everyone who propounds a theory should feel obliged to produce such an assessment of the errors involved. So far, such checks have only been carried out on the RAE Standard Method by J Weber (1954), (1955), (1972) and J C Cooke (1958), and by В L Hewitt &

W Kellaway (1972) on their method.

An advantage of this method of checking the accuracy of approximations is that the procedure can be extended to obtain improved approximations by an itera~ tive process. In a method developed by J Weber (1972) and С C L Sells (1973) and (1974), (4.84) is used to determine not Az but Av?(x, y,zw), as the dif­ference between the required value and that obtained by inserting the first – order approximations. By splitting Avz into a symmetrical part (arising from thickness) and an asymmetrical part (arising from lift), one can obtain corrections Aq(x, y) and A£(x, y) to the singularity distributions, using again the same approximate first-order method as before. For л(0(х, у), vor­tex-lattice methods, such as those by S G Hedman (1965) or by С E Lan (1974), may be used as an alternative. This leads to improved solutions

q^(x, y) = q^(x, y) + Aq(x, y) and i^(x, y) = Л^(х, у) + A£(x, y), (4.85)

and the process can be repeated. One step in this iteration is the determina­tion of the perturbation velocity field induced by planar source and vortex distributions. This can be done to any desired accuracy by computer programs devised by J A Ledger (1972) and С C L Sells (1969). In general, the itera­tion converges quickly and only a few steps need to be taken.

In principle, such an iteration method may be regarded as giving numericalty_ exact answers. Strictly, to substantiate any method using singularity distri – distributions – and this includes panel or facet methods and finite-element schemes – it will be necessary to calculate the flowfield in the regions near

. The Aerodynamic Design of Aircraft

Подпись: Fig. 4.2 Optimum values of n and lift coefficient at cruise for given flight ranges and efficiencies

which does not depend on the structural constants c^ and C2 . This cannot be solved explicitly, and we quote here some numerical values in Fig. 4.2, where WE/W has been kept constant, somewhat inconsistently; but less restric­ted calculations show the same trends, as it turns out that WE/W is nearly independent of R, in this first-order approximation. We find that the op­timum value value of n is near unity for longer ranges when fuel fraction is

. The Aerodynamic Design of Aircraft

large and the fuel weight matters more; and that n is noticeably smaller than unity for shorter ranges when the fuel fraction is small and the engine weight matters more. The values of the lift coefficient С^сг at cruise change correspondingly. With these values of n, a maximum of the payload is reached, which is given by

These first-order results lead to some important conclusions: whether an air­craft of the classical type is designed for flight over short or tong ranges, this task can be fulfilled by much the same layout – the aircraft look the same at first sight and have a strong family resemblance. For a given cruis­ing speed, the aerodynamic and propulsive parameters (L/D)m and np can be kept about the same. This means that the aspect ratio is high and nearly the same for all these aircraft and that the same kind of engine can be installed. The L/D-curves will then look much the same as the curves in Fig. 4.1, and only the operating point at cruise will move up or down curve (1) according to the range to be flown; at longer ranges (such as the transatlantic range), the operating point will be fairly close to (L/D)m ; at shorter ranges, it may be as much as halfway down.

As the fuel fraction increases with range, the wing loading at take-off will be the higher the longer the range, but the wing loading at landing can be much the same for all aircraft; if the demands on airfield performance are the

Properties of Classical and Swept Aircraft

Подпись: 109same, on which the degree of complexity built into the high-lift system depends. This implies, in turn, that the payload fraction can be increased as the fuel weight is reduced and that it will be the greater the shorter the range, as can already be seen from the dominant factor 1/R in (4.12). All this con­firms that it is quite realistic to think in terms of a whole family or type of aircraft designed according to Cayley’s concept.

For a self-consistent set of the numerical values of the parameters involved, we illustrate by an example of a typical transatlantic aircraft of no excep­tional performance, Fig. 4.3, how the various weight items vary with n on either side of the optimum value. This should have a salutary and moderating effect on aerodynamicists in that it demonstrates very clearly how precarious it is for the aircraft designer to be left with a worthwhile payload; and also how much the mechanical and structural engineers, as well as the materials, avionics, and propulsion engineers can contribute to the success of an air­craft by providing lightweight solutions for their parts of the design. Fur­ther, the certification engineers can exert a very significant influence when they define safety standards and factors and conditions for environmental acceptability. For instance, an allowance has been made in the example of Fig,

4.3

Подпись: Fig. 4.3 Weight breakdown of a series of classical aircraft for R ■ 5000 km, tip <L/D)m - tt

for reserve fuel to cope with stand-off conditions, diversions etc; this

takes up about as much weight as the best payload, so that any changes in the rules for fuel reserves, brought about by improvements in air-traffic control, say, will have a proportional effect on the payload and hence on the economics of the aircraft.

Fig. 4.4 shows a similar weight breakdown for a family of aircraft designed to fly over different ranges. This demonstrates how shorter ranges and hence less

The Aerodynamic Design of Aircraft

fuel weight allow the payload fraction to be increased and with it the weight of the fuselage and of the furnishings. Very roughly, half the weight of an aircraft on take-off is fuel if it is to cross the Atlantic Ocean. The points in Fig. 4.4 represent values for actual aircraft, the upward-pointing symbols

. The Aerodynamic Design of Aircraft

Fig. 4.4 Weight breakdown for a series of classical aircraft with optimum payloads for different flight ranges. Mq ■ 0.8

having been obtained by addition from the bottom and the downward-pointing symbols by subtraction from the top. Similarly, an inspection of the aspect ratios of actual transport aircraft, and of many of the more outstanding mili­tary aircraft, shows that the value of the aspect ratio is usually between 5 and 8, i. e. it is always high in an aerodynamic sense. Also, specialised air­craft, such as the LockspeiserLand Development Aircraft (see M Wilson (1975)), fit into the general framework. Gliders, which have no engine and carry no fu$l, and are designed to more stringent aerodynamic performance requirements, generally have higher aspect ratios and thus reinforce the conclusions drawn here. The aerodynamic design of gliders, nowadays often for two different design points for different purposes, is very instructive, and we refer to investigations by A Quast & F Thomas (1967), F Thomas (1971), and G Redeker (1975Dl

The theoretical framework presented here evidently provides a good representa­tion of the overriding trends in the characteristics of actual aircraft. This implies that classical aerofoil theory for wings of high aspect ratio, which has been discussed partly in Section 3.2 and will be discussed again in more detail in Section 4.3, goes well together with the engineering requirements of the classical type of aircraft. On reflection, and bearing in mind the very many conceptual abstractions, simplifications, and approximations which have to be made before we arrive at this theory, this is one of those striking and fortunate coincidences on which the aerodynamics of aircraft lives.

The assumptions made in this performance analysis are so drastic that it is of interest to know what the answer would be if more detailed and accurate para­meters of the airframe and engine were taken into account and also realistic assumptions made for the flight path and requirements during take-off and landing (see e. g. D Lean (1962), D H Perry (1969) and (1970), and J Williams

(1972) ) and for the range itself (see e. g. J F Holford et a£.(1972)). Such detailed calculations are made, anyway, in the actual design of aircraft where multivariate analysis is beginning to be used and to prove itself a useful tool. We refer here to such an analysis carried out by D L I Kirkpatrick

(1972) and (1973) on how the optimum design for payload is affected by changes in the mission requirements, the operational constraints, and the design stan­dards. This analysis shows that, in general, second-order effects arising from the complex interactions between the variations with range, aircraft size, fuel fraction, and wing loading and of the variations of passenger capacity and structural efficiency must be taken into account in an actual design but do not change the main trends established in the first-order analysis. For example, the aspect ratios of the wings of various turbojet aircraft of dif­ferent sizes, ranges, and ages (past and estimated future) should all be close to 7 and vary at the most between about 5 and 8 . Again, the value of the parameter n varies in much the same way with range as in Fig. 4.2, with some of the actual values slightly below those given there. The engine weight fraction may be below 0.1 (down to nearly 0.07) for some short-range aircraft and the wing loading at the approach may increase as the range decreases. We note also that the optimum design of a short-range aircraft, which does not need to carry fuel reserves, has a maximum lift-to-drag ratio which should be about 12% larger than that of an aircraft which does. There is also a bene­ficial effect of larger sizes (see e. g. D L I Kirkpatrick (1972), D KUchemann & J Weber (1968)).

Altogether, these results confirm that the first-order performance analysis gives a good guide to the required characteristics of classical aircraft de­signed according to Cayley’s principles, for the time being. But some of the aspects of the analysis are restricted to classical aircraft, and we shall see later that other types of aircraft require a different kind of performance an­alysis, even to a first order.

Before we discuss the design of the classical aircraft in more detail, we con­sider first an extension of this concept to include swept-winged aircraft, be­cause these are so closely related to one another that they can be treated together.

PROPERTIES OF CLASSICAL AND SWEPT AIRCRAFT

4.1 A family of aircraft according to Cayley’s concept. Long before Lilienthal flew his first glider (1891) and the Wright Brothers made the first flight in a powered aircraft (1903), Sir George Cayley thought out the design concept of the classical type of aircraft. In 1799,he gave up the idea of designing aircraft as ornithopters and thus imitating bird flight, which had dominated man’s thinking from the beginning, and replaced it by a concept well – adapted to human engineering: to separate the functions which he identified as essential for achieving flight and to design aircraft to have largely independ­ent organs to fulfil these functions, namely, of providing volume for the pay­load, lift forces, thrust forces, and control forces and moments. These distinct organs can readily be identified as a fuselage, wings, engines, and various control surfaces. Interference effects between them are intended to be essen­tially small. Cayley published his results and proposals in a classical paper in three parts (1809 and 1810) and this laid the foundations of aviation. De­tails about Cayley’s work may be found in С H Gibbs-Smith (1962). There are now good reasons to believe that one of the gliders designed by Cayley was, in fact, flown successfully in 1853 by his "reluctant coachman" (see Anon (1974)).

Conceptually, the classical type of aircraft reached its final form in the streamline aeroplane of Melvill Jones (1929), and this was then extended to the closely related swept-winged type of aircraft by A Betz (1940). Cayley’s design concept has not only replaced the old craving for imitating Nature but it has now been widely accepted as though it was itself a law of Nature and the only possible layout for aircraft. It is only recently that other major types of aircraft have appeared, which utilise different types of flow and, to various degrees, the principle of integrating the functions of several organs, as is generally done in animal flight, but in different ways adapted to human engineering.

On the basis of Cayley’s concept alone, some fundamental properties of the classical subsonic aircraft can be derived. The separation of functions allows us to break down the weight of such an aircraft in a simple manner, to a first order. It also allows us to use a simple relation between lift and drag and to regard the engine thrust as independent of these, again to a first order.

We follow here a performance analysis given by D KUchemann & J Weber (1966).

A first-order weight breakdown has already been described in Section 1.2, and

(1.9) presents the overall weight W of a classical aircraft as the sum of items which are proportional to the overall weight, others which are propor­tional to the payload Wp, and of the engine weight Wg and the fuel weight WF. This breakdown will be retained here, and we shall see later that more detailed considerations do not alter the main conclusions which we shall derive.

A first-order drag relation has already been given in Section 3.2, and (3.42) presents the overall drag of a classical aircraft as the sum of two terms: a friction and form drag, Cpg, which includes the profile drag of the wing as well as friction forces on the other organs, such as the fuselage and the engine nacelles; and a lift-dependent drag, Сщ,, which is predominantly the vortex drag Cjjy of the wing. We have already seen that (3.42) may be

regarded as a good approximation if the wing has a high aspect ratio A, and if the trailing vortex sheet is reasonably flat near the wing, i. e. when

A = 4s2/S = 2s/c » 1 ,

where s is the semispan of the wing, S the area of the wing planform, and "C the mean chord of the wing. That this assumption is consistent with the concept of the classical subsonic aircraft can be seen as follows: the analy­

sis given in Section 1.2 and the relations derived there for the flight range, (1.7), and for the payload fraction, (1.11), indicate that the value of the product npL/D of the propulsive efficiency and the lift-to-drag ratio should reach some value (about тг) so as to give reasonably economic transport aircraft, by (1.12). Now, L/D as determined from (3.42) has a maximum value with respect to CL :

PROPERTIES OF CLASSICAL AND SWEPT AIRCRAFT(4.1)

and so this maximum value should reach at least ir/n, which can be taken as about 16 if a typical value of n = 0.2 is assumed for a turbojet engine at a subsonic flight Mach number Mq = 0.7. This means that A should have a minimum value which can be determined from (4.1):

PROPERTIES OF CLASSICAL AND SWEPT AIRCRAFT(4.2)

To get some rough indication, we may put Ky * 1.2 and Сщ – 0.02, and so we find that the aspect ratio should be around 7 or more, i. e. we are indeed interested only in classical aircraft which have wings of high aspect ratio. This is an important result which we shall recognise also as the basis of clas­sical aerofoil and wing theory.

Подпись: Fig. 4.1 Lift-to-drag ratios of a typical swept-winged transport aircraft at various flight conditions

At this point, we should check the approximations made so far against some ac­tual values pertaining to a typical subsonic transport aircraft of the present

LIVE GRAPH

Click here to view

generation for medium ranges. Such an aircraft may have an aspect ratio of about 7 and an angle of sweep of about 35°. Fig. 4.1 shows typical values of L/D for six different flight conditions. The cases are listed in the Table below. Each condition corresponds to a different geometric configuration of

Curve

Configuration

CDF

(1)

cruise

Г low Mach number

0.0165

1.2

(2)

1_ cruise Mach number

(3)

low

■ no flap deflection

0.0285

1.1

(4)

speed, leading edge * device

small flap deflection

0.041

1.1

(5)

moderate flap deflection

0.0605

1.05

(6)

in use

. large flap deflection

0.116

1.0

Cases taken for the curves in Fig. 4.1

the aircraft: the wing is "clean" at cruise, but various devices are exten­

ded at the other flight conditions. Strictly, therefore, we are dealing with a variable-geometry aircraft.

In the cruise configuration, values of (L/D)m near 16 are obtained, and the curve labelled (2) shows how the drag rise due to compressibility effects re­duces the value of (L/D)m. A leading-edge device such as a slat, brought into operation at low speeds, curve (3), causes a considerable drop in (L/D)m but shifts it to a higher value of Cl, as desired. The same trend persists when trailing-edge flaps are deflected. The curves (4) and (5) represent typical take-off conditions and (6) the landing approach. One might query why the various high-lift devices reduce the lift-to-drag ratio so much, bearing in mind that the flow can be expected to be attached everywhere, with the excep­tion of case (6) where the flow may well be separated over the flap deflected through about 45°. Here, we can only note that the viscous effects, i. e. both friction and pressure drag, must be relatively large on these multiple aerofoils. We also note that the results given in Fig. 4.1 still imply that there exists a strong overall suction force in the direction of the wing chord (see Section 3.2, (3.30)). If this had vanished, as a result of vis­cous effects, then L/D would have been about 4 at Cl = 1 and about 2 at

Cl = 2 . This does not mean that one could not do better than the results

in Fig. 4.1, and to improve the aerodynamic design of high-lift devices remains an important task.

Fig. 4.1 also gives some indication of how well the simple drag relation (3.42) can represent the actual properties of a complete aircraft. The dashed lines have been worked out from (3.42), choosing values of Cpy and Ky empirically to fit the actual values somewhere near the maximum values of l/d. As

listed in the Table above, we find that the values of Ky can b’e reduced

from about 1.2 for the cruise configuration to about 1.0 for the high-lift configuration in the approach to landing, possibly because the trailing vortex sheet becomes significantly non-planar at the higher lifts in a way which reduces the vortex drag factor. Thus the reductions of the lift-to-

drag ratio are caused by considerable increases in the viscous drag Cpp, emphasising again the need for understanding the viscous effects so that improvements can be attempted. We note further that (3.42) gives a good fit for the cruise configuration, curve (1), with the exception of the very last part of the curve at the higher CL-values. The fit is not quite so good for the low-speed configurations. This indicates some sensitivity to off-design conditions: if the high-lift systems work efficiently near (L/D)m, their

performance deteriorates somewhat at both lower and higher CL-values and, because of non-linear effects, the drag cannot be represented by constant values of Сцр and Ky. On the whole, however, we find that (3.42) is a useful relation for survey purposes.

The next question that arises from such an overall view of the lift and drag forces as shown in Fig. 4.1 is that of where, i. e. at what CL-values, the aircraft will operate under the various flight conditions. Considering only the aerodynamic properties, one would require operation at the maximum value of the lift-to-drag ratio, (L/D)m, but this is not generally acceptable in practice because other considerations must be taken into account. At low speeds, both at take-off and landing,, safety considerations, as defined by the certification authorities, demand that the aircraft should be flown at speeds well above the stalling speed, Vg, which corresponds to the maxi­mum lift obtainable. For example, the speed at take-off should be more than 1.2 Vc; and the approach speed should not be lower than 1.3 Vg. The

curves in Fig. 4.1 end where С^тах, i. e. the stalling speed, is reached

and hence the circles on the curves indicate typical operating conditions.

In a good design, one would aim at having these operating points to coincide with (L/D)m for the particular configuration; it helps that the maximum of the L/D-curve is likely to be fairly flat.

Matters are more complicated when it comes to the choice of a suitable opera­ting condition at cruise. Here, the aim is obviously to make the payload

fraction Wp/W as large as possible and to keep the other weight items down.

Подпись: (4.3)
PROPERTIES OF CLASSICAL AND SWEPT AIRCRAFT PROPERTIES OF CLASSICAL AND SWEPT AIRCRAFT

To a first order, this is a compromise between the opposing effect of the fuel weight and the engine weight on the payload. It must then be admitted that the aircraft flies at a value of L/D which is below the maximum value, so that, with (3.42) and (4.1),

PROPERTIES OF CLASSICAL AND SWEPT AIRCRAFT Подпись: 9 Подпись: (4.4)
PROPERTIES OF CLASSICAL AND SWEPT AIRCRAFT

Since (L/D)m is reached at

the Cl-value at cruise can then be expressed as

Подпись: 'L crPROPERTIES OF CLASSICAL AND SWEPT AIRCRAFTC,

PROPERTIES OF CLASSICAL AND SWEPT AIRCRAFT Подпись: (4.6) Подпись: w

Consider now the fuel weight Wp. This can be written as

according to (1.10) where R is the Broguet range. This decreases with in­creasing n, if the aerodynamic and propulsion parameters are regarded as given quantities, i. e. if the configuration of the aircraft is fixed. The lowest fuel fraction Wp/W is then reached when n = 1 .

Подпись: = ІР V 2Kcr cr Подпись: Lcr/s CL cr Подпись: (4.7)

Consider next the engine weight Wp. Here, we must make several assumptions. We consider the case of turbojet engines and assume that the engine thrust (and hence the weight) is determined by cruise considerations and that the thrust so obtained is then also sufficient to meet the airfield and clind> re­quirements. Further, the engine is assumed to be of the kind where, for a given cruising Mach number, Mcf, and cruising height above the tropopause, hcr, the thrust varies approximately in proportion to the dynamic head

Hence, the engine weight may be assumed to be

Подпись: WE =Th

‘3!p v2

2 cr cr

Подпись: where Thus

Подпись: _E W Подпись: L cr C3 n(L/D)mW/S Подпись: (4.8)

C3 is a constant associated with the particular kind of engine chosen.

since Lcr ts W and Th = D in level flight. Using (4.3) and (4.5) we have finally

E = 2c C —__ L (і – 11 – n2 ^ (4.!

W 2 3CDF W/S д2 у */ J ‘

We find that the engine weight shows the opposite trend to the fuel weight and decreases with decreasing n. The function of n in (4.9) decreases from 1 at n = 1 to J at n – 0 . We note also that the engine weight decreases with decreasing zero-lift drag Сцр and with increasing wing loading W/S. But, in the subsequent first-order analysis, the important design parameters Срр and W/S are considered to be constant, as is the value of the factor C3 . All this means in simple terms is that, although

L/D increases with increasing n, the drag itself may also increase and

thus a more powerful and hence heavier engine may be required.

Подпись: 2!l -LI c, * c, uF W/S 2 2. L n Подпись: R Hn na/D) p m Подпись: (4.10)
PROPERTIES OF CLASSICAL AND SWEPT AIRCRAFT

With Wp/W from (4.6) and Wp/W from (4.9), the payload fraction Wp/W can be determined from (1.11), using the general weight breakdown (1.9):

This relation for the payload may be regarded as a function of n for any member of a family of aircraft with given values of C])p, A/Ky, W/S and R as well as cj_, c2 , C3 . A value of n must exist for which the pay­load has a maximum value. This value of n is determined by the relation

Elements of propulsion engines

3.7 Rather than describing details of actual engines, we shall concentrate in this Section on certain basic types of flow which are characteristic of the aerodynamics of propulsion and may help to ex­plain some of the design features of propulsion engines. We shall discuss

flows with energy addition, either in the form of heat or mechanical energy;

air intake and nozzle exit flows of engines surrounded by fairings; and

some very simple complete engines, to see how the elements can be put together.

Consider first two hypothetical flows past a поп-ducted burner disc, where heat is assumed to be added at constant area. We know in advance that there can be no thrust force because there is no solid body to take it. A burner disc in a subsonic stream produces a flow like that sketched in Fig. 3.17. Pressure and density increase as the air approaches the disc. They both fall again by a larger amount during heat addition, whereas the temperature increases. Behind

Means for Generating Lift and Propulsive Forces

Подпись: 89

Подпись: LIVE GRAPH Click here to view
Elements of propulsion engines
Подпись: LIVE GRAPH Click here to view

the burner, the pressure rises to the undisturbed value but the density remains below and the temperature above their respective undisturbed values. The velo­city of the air falls as it approaches the burner; it is then suddenly increa-

„ Fig, 3,17 Subsonic flow past a burner

Подпись: Fig. 3.18 Flow cycle for a non-ducted burner in a subsonic stream Подпись: Fig. 3.19 Flow cycle for a non-ducted burner in a supersonic stream

sed and falls again behind the burner to the freestream value. Thus no jet is formed, which is consistent with the fact that the burner cannot take any for­ces, The flow properties imply that the streamtube that passes through the disc increases all the way and that the burner produces nothing but hot air behind it. This state of affairs is fortunately revealed at once by the flow

cycle for the air that takes part in the combustion process, as shown in Fig. 3.18. We find that the curves in the cycle diagram cross over and that all the heat supplied is again rejected to the surroundings. Hence no available mechanical energy is left.

If the flow is supersonic, the non-ducted burner may be regarded as a detona­tion wave standing on a disc normal to the mainstream. Such a detonation wave may be interpreted for our purpose as the combination of a normal shock­wave with heat addition at constant area. Thus the change of state of the air from far upstream to the beginning of combustion may be thought of as includ­ing the non-isentropic compression by the shockwave between 0 and 1, as shown in Fig. 3.19, and heat addition at constant area between 1 and 2. Although we know that again no thrust force is produced, this is not now revealed by the flow cycle for that part of the airstream subjected to these changes of state; a genuine jet with increased velocity is produced, the thermal efficiency is quite good (0.37 in the example shown), and the propul­sive efficiency (0.34) would suggest that the available propulsive work is considerable. The explanation for this apparent paradox has been given by

Подпись: Fig. 3.20 Supersonic flow past a burner
К Oswatitsch (1959): it can be seen by inspection of the actual flow, as indi­cated in Fig. 3.20. The expanding flow behind the burner and the widening jet require that at least one shockwave is generated in the external stream. Hence

a strong interaction with the external stream occurs and work is done on it by the heat-addition process. The entropy is increased not only in the jet but also in the external stream, and the associated effects cancel each other out exactly: the burner produces hot air and shochwaves, This then is a case where the assumption d’w ■ 0 cannot be made and where the basic thrust equa­tion is not true. Thus the example of the non-ducted burner demonstrates in a drastic manner that there can be strong interactions between the flow of air that takes part in the heat-addition process and the external stream, and that the propulsive efficiency of the onedimensional flow cycle is not a measure for the actual propulsive force obtained for the combined flowfield. This de­fines a fundamental aerodynamic problem of propulsion, especially of heat ad­dition at supersonic and hypersonic speeds, and we shall have to come back to it later in Section 8.5.

It may be somewhat reassuring to consider next a counterpart to these flows, namely, one where only mechanical energy is added to the flow, instead of heat. This means we ignore that part of the propulsion system where heat is conver­ted into mechanical energy. This process can be interpreted as a non-ducted airscrew3or propeller, where heat is converted into work and taken out by a shaft by means of a piston engine. Consider the ideal propeller in a subsonic

WITHOUT FRICTION

Elements of propulsion engines

WITH FRICTION

I*

T

To

I-

o-

Elements of propulsion engines

О о O-l О о O-l 0*2

As/R As/R

Fig. 3.21 Flow cycles of a propeller in a subsonic stream

LIVE GRAPH

Click here to view

flow without friction. There is no supply of heat, q = 0 ; but mechanical work is done by external means and transferred to the propeller, w Ф 0. Neither enthalpy of the air not the entropy in the slipstream is different from those upstream: Tj = Tq and sj = Sq. The whole of the energy supplied is

eventually transferred into kinetic energy in the jet. The propulsive effi­ciency is not unity since the kinetic energy is only partly used to produce thrust. The efficiency is given by the Froude efficiency of (3.74). All the changes of state of the air follow a single isentropic curve, as indicated in Fig. 3.21. Up to the propeller disc, 0 •+• 1, pressure, density, and also tem­perature decrease. In the passage through the propeller disc, 1 2, each of

these parameters rises suddenly. As the pressure decreases gradually to pg behind the propeller, 2 -*■ j, density and temperature approach their initial values at 0. The diagram in Fig. 3.21 shows that no work is done by the flow, as the curve encloses no area. The air only serves as a converter of the me­chanical energy in the propeller shaft into kinetic energy in the slipstream.

The streamline pattern of this flow is such that the streamtube containing the air that passes through the propeller disc narrows all the way and looks, at first sight, like the reverse of that in Fig. 3.17, except that a proper jet is formed. The upstream influence of the propeller is such that the velocity increases from Vq to some higher value just upstream of the disc; and the downstream influence produces a further increase to Vj in the Trefftz plane. By the application of Bernoulli’s equation separately to the flow upstream and downstream of the propeller, we find that the average axial velocity Vp at the propeller is the mean of the velocities far upstream and far downstream:

Vp = i(V0 + Vj) (3.82)

But there is a sudden increase of the axial velocity component at the propel­ler disc so that there must be a velocity jump also at the edge of the stream – tube of the slipstream all the way downstream of the propeller. This means that there exists, in this model of the flow, a vortex sheet around the slip­stream, composed of elemental ring vortices which are shed from the tips of the (infinite number of) propeller blades and continued as bound vorticity along the blade, around which there is a circulation. This flow model is thus closely analogous to that of classical lifting wings, which was discussed in Section 3.2.

With a real propeller, some energy is lost due to frictional forces at the propeller blades, leaving a viscous wake behind. It is still true that q =* 0, w ф 0, but now Tj Ф Tq. Both entropy and enthalpy are now greater in the slipstream than in the undisturbed flow: T. > Tq. Thus only part of the ener­

gy supplied is converted into kinetic energy and the rest is wasted on an in­crease of the enthalpy in the slipstream. The changes of state of the air are also shown in Fig. 3.21. The entropy increases when the air passes through the propeller disc. The area aOjba represents the energy wasted due to fric­tion, which appears as a temperature increase in the flow downstream. The ef­ficiency is naturally less than that of the ideal propeller. Here then is a flow cycle where a genuine thrust force is produced and we know where it acts: on the blades of the propeller itself, again in close analogy to the genera­tion of lift on classical aerofoils.

We learn from this example of the propeller that a thrust force is obtained only when the specific momentum in the Trefftz plane is increased, at the same pressure far upstream and downstream. Further, the generation of a thrust for­ce is associated with the shedding of a vortex sheet and this, in turn, requi­res the presence of a solid body from which it originates. This should apply
also to the flow with direct heat addition and we must ask ourselves, there­fore, what form such a body should take.

Elements of propulsion engines

A simple shape of a solid body to think of is a cylindrical fairing that sur­rounds the burner or the propeller, so that we have energy addition in a duct. This leads us to the somewhat more realistic engine concepts of ducted bur­ners, or ramjets, and ducted propellers, or fanjets. To be quite clear about

the properties of propulsion systems with heat supply and with supply of mech­anical energy, Fig. 3.22 has been prepared to summarise the aerodynamic and thermodynamic characteristics at subsonic speeds of non-ducted and ducted bur­ners and propellers. For simplicity, the ducts have zero length, but it is assumed that there is a circulation around them, which changes the velocity field inside the duct. The main streamlines, the variations of velocity and pressure, and the thermodynamic parameters density and temperature are shown.

The numerical values have been chosen so that the overall thrust is the same in all cases for Mg – 0.63 (except for the non-ducted burner where the thrust is zero). To obtain these flows, all that must be assumed is that the fairing is suitably shaped so that the mass flow through the duct is regulated in an appropriate manner and that the thrust force can act on it.

What the circulation around the fairing should be and how the fairing should

Elements of propulsion engines

Fig. 3 .23 Subsonic flows past a burner – ducted and non-ducted

be shaped so as to be able to sustain a thrust force can be explained by con­sidering the special case of heat addition to a subsonic stream in more detail. The basic flow without a duct is sketched in Fig.3.23(a). The sudden increase in velocity at the burner disc is indicated by a corresponding increase in the density of the streamlines (which signifies a certain analogy between flows with heat addition and flows with mass addition). But we know that no jet is formed and that, consequently, there is no vortex sheet dividing the air which goes through the burner from that which flows around it. If we put a cylindri­cal fairing around the burner, as in Fig. 3.23(b), the fairing is inclined to the local flow direction in a manner similar to the plate at an angle of inci­dence shown in Fig. 2.14(a). In an inviscid fluid, we can then conceive a flow like that shown in in Fig. 3.23(b), where the flow pattern is changed only locally by the fairing and where there is still no jet and no axial force on the fairing. The air flows round both the leading and trailing edges and the suction forces there are equal and opposite. If we now consider what may happen in a real flow, by the sudden application of viscosity as argued in Sec­tion 2.4, and if we want to satisfy the Kutta condition of smooth outflow at the trailing edge of the fairing, then a time-dependent and possibly periodic shedding of vorticity would be a possible solution, as indicated in Figs.2.14 and 3.23(c). Only in special cases could the fairing be shaped in such a way that the pressure in the exit plane would be equal to the undisturbed pressure Pq so that a smooth steady vortex sheet could be formed. In general and on time-average, a jet will now emerge and the resulting thrust force will act as a suction force at the leading edge of the fairing. There is now a circulation around the fairing, and the shape of the fairing will have to have a rounded leading edge to realise the suction force, in the same manner as on twodimen­sional aerofoil sections (Fig. 3.4). We must expect that the periodic vortex cores around the jet will make a noise. In any real subsonic engine with heat addition, conditions are fundamentally similar to those indicated in Fig.3.23 (c). The flow through the duct is normally regulated by control of the exit area, by means of the Kutta condition, but important changes occur also at the inlet.

In practice, the fairing may often be regarded as an annular aerofoil with circulation. In some cases, e. g. with ducted fans, the length is comparable to the diameter. The design of such annular aerofoils is closely related to that of wings amd approximate design methods have been developed. We refer to some recent papers on the matters by C Young (1969), W Geissler (1973), and V Krishnamurthy & N R Subramanian (1974), where further references may be found. In a complete design, the flow induced by the burner, or fan, inside the fairing is also taken into account. Depending on the initial circulation around the annular aerofoil, the ducted fan may be designed to have a larger mass flow (than the fan alone) at low speeds and hence an augmented thrust, absorbing more power; or a lower mass flow at high speeds to reduce the Mach number at the blades. In either case, the viscous drag of the fairing must be taken into account. The overall propulsive efficiency has a maximum which is reached when this viscous drag and the loading on the fan are correctly balan­ced: if the fan loading is too low, the viscous drag will dominate and reduce the efficiency; if it is too high, the fan losses themselves will reduce the efficiency. Although the physical principles of such ducted devices have been clarified some time ago (see e. g. D KUchemann (1941) and (1942)), some practi­cal applications have appeared only recently.

Elements of propulsion engines

b STATIC CONDITIONS

Elements of propulsion engines

Fig. 3.24 Subsonic flows into an air intake

Actual jet engines, such as turbojets and fanjets, combine the addition of heat and of mechanical energy. A multistage compressor is added upstream of

the combustion chamber, to increase the pressure at combustion, and a turbine is added downstream of the combustion chamber, to drive the compressor. The gas generator – i. e. the compressor, the combustion chamber, and the tur­bine – is then surrounded by a fairing which is so long in relation to its diameter that the flow into the inlet and around the nose of the intake of the fairing can be treated separately from the flow inside the fairing (for de­tailed information, see e. g. R Hermann (1956), J C Eward (1957), J Fabri

(1958) , and AGARD Conference Proceeding CP-91 (1971)). The same applies to the nozzle flow at the end of the fairing. This leads to a very convenient separation of problem areas.

We now arrive at the concept of a subsonic intake flow, as sketched in Fig.

3.24, where the flow is uniform in some inlet plane A£ with a velocity V^. Roughly, Vj might be kept the same under all flight conditions, whether the flight speed Vq is high or even zero, so as to deliver the same mass flow to the gas generator inside the fairing (we igftore here density changes brought about by operation at different altitudes). We assume that the fairing is long enough for the flow over the outer surface to come back to the undis­turbed velocity Vq at some point where the fairing is assumed to be cylindri­cal, with the maximum cross-sectional area A_. Thus the inlet flow pattern may vary a great deal. Near the maximum speed of the aircraft, there may be a definite retardation of the flow ahead of the inlet, Fig. 3.24(a), while un­der static conditions (V0 =0), the air approaches the inlet from all direc­tions, Fig. 3.24(b). The flow is closely related to that around the nose of a classical aerofoil section (Fig. 3.4), but the range of flow conditions is much wider. Each section of the fairing experiences an aerodynamic force which is inclined forward. The component normal to the mainstream affects, in gene­ral, only the stressing of the fairing, but the streamwise (thrust) component may make an appreciable contribution to the thrust-drag balance of the whole power unit.

Подпись:Elements of propulsion engines(3.83)

(3.84)

This relation is a direct counterpart to (3.30) for the tangential force on classical wings. To obtain a genuine thrust force, the velocity over the ou­ter surface of the intake must be greater locally than the mainstream veloci­ty, and p^ < Pq. On the other hand, the local velocities should exceed the flight velocity as little as possible if the intake is to be designed to reach a high critical Mach number. Clearly, the velocities Vjj are least for given values of A£ and V^/Vq if the shape of the intake is such that VN is uni­form over the whole curved outer surface so that Vv0 = W/Vq is the con­stant velocity ratio there. In this case, the integral in (3783) can be eva-

Подпись: luated:

Elements of propulsion engines(3.85)

using (3.84). This relation shows that a certain minimum frontal area, or thrust area, is needed to keep the external velocities within given limits. Every inlet opening, therefore, requires a surrounding fairing with a definite thickness, which must be the greater the smaller the velocity increments are allowed to be. Thus we come to the, perhaps, surprising conclusion that high critical Mach numbers require thick intake watts, that is, small values of

W ’

We note that these relations hold for intakes of any cross-section, including twodimensional, circular, or threedimensional shapes. Actual shapes with p„

■ constant have been calculated for twodimensional intakes by P Ruden (1940), and approximate shapes have been devised for circular air intakes by D KUche – mann & J Weber (1940) and (1953), D D Baals, N F Smith & J В Wright (1949).

Note that, so far, corresponding design calculations have not yet been made for aerofoils and wings. General threedimensional shapes for air intakes with constant-pressure contours can also be determined experimentally by observa­tions of cavitation bubbles (see H Reichardt (1944)). All these shapes pre­sent us with an interesting aspect of the general design problem: they might be called optimum shapes for the precise design condition but, to achieve this, the nose shape must be rather sharp, with a very small nose radius, so that these shapes are very sensitive to any changes in the flow conditions. A small change either way in V^/Vq, say, may move the attachment line around the nose in such a way that a very high suction peak occurs, either on the inner or on the outer surface, with a subsequent adverse pressure gradient which the boun­dary layer is not able to negotiate, and hence the flow separates. For a two-

Elements of propulsion engines

Подпись: so that, in general
Подпись: (l - VV2 «'wv2 - 1
Elements of propulsion engines
Подпись: +
Подпись: (3,86)

LIVE GRAPH

Подпись: Fig. 3.25 Twodimensional Ruden air intake and variations of peak velocities in incompressible flow

Click here to view

dimensional Ruden intake, these changes can be calculated and some results are shown in Fig. 3.25. These indicate how small the "working range" is (the actual working range will be somewhat larger than that shown in Fig.3.25 since some suction peak can be allowed before flow separation occurs). As a general principle, such sensitive designs with a very limited working range are not acceptable in practice. This example shows very clearly that we must make it a rule to check every design principle with a view to the off-design behaviour which the resulting shapes can be expected to have.

The case of air intakes shows us also one possible way in which such short­comings can be overcome. Evidently, the rate of growth of suction peaks in off – design conditions depends on the radius and bluntness of the nose, and rounding – off the nose should make the intake less sensitive and widen its working range. This has been proved in practice by a series of air intakes designed in this way (D KUchemann & J Weber (1940) and (1943)). The pressure distribution along the outer surface cannot then be uniform, and the local velocity must be higher in some places than that over the corresponding constant-pressure con­tour. This does not invalidate (3.86), and the "greater-than" sign then applies. This means, in turn, that the velocity exceeds the speed of sound earlier, i. e. at a lower value of the flight speed, and that a looal supersonic region has already been formed over part of the outer surface when the optimum intake just becomes critical. But whereas the drag of the latter tends to rise steeply when the critical Mach number is exceeded, the drag of the former may rise only very little: for an appreciable range of supercritical Mach num­bers, the local supersonic region is terminated by a shockless recompression or by a weak shockwave, so that the entropy increase is small or nearly zero (see also Section 5.2). Thus the rounded air intakes can be operated effi­ciently well beyond their critical Mach numbers. This is thus a design prin­ciple of practical value; to allow supercritical regions of this kind to deve­lop from "peaky" pressure distributions is now common practice also on aero­foils and on wings. This was first demonstrated on air intakes by H Ludwieg (1943), but there is still no complete and rational design procedure.

In all cases where a retardation of the flow into the fairing is required, as for example in Fig. 3.23(c), where the velocity Vg at the burner, say, should be smaller than Vq and the pressure higher than pg, the aerodynamic load on the outer surface of the intake can be relieved by incorporating a subsonic diffuser downstream of the narrowest cross-section A^ of the intake so that the burner area Ag > A^. The pressure rise then takes place partly in the freestream upstream of the inlet (external compression – ram effect) and partly in the duct (internal compression). Momentum considerations which led to (3.84) still apply, and the total thrust force on the intake and on the walls of the diffuser is given by

Elements of propulsion enginesПодпись:Подпись:Elements of propulsion engines(3.87)

(3.88) and this can be smaller than that of (3.84), for a given value of V^/Vq, if A^/Ag < 1, that is, if we compare an intake without diffuser and mass flow

pVjA^ with an intake with diffuser and the same mass flow pVgAg. Part of the thrust load is then carried in the diffuser, and the design of the actual intake may be eased considerably. A diffuser is incorporated in most practi­cal cases, not only in the design of ducted burners but also in the design of turbojets and of ducted fans and coolers. This may bring considerable advan­tages in the design for a high critical Mach number; also, very useful reduc­tions of the frontal area and of the length of the intake may result. On the

other hand, we are then faced with the problem of designing an efficient duct and this may be quite severe, especially when the duct has to change its cross-sectional shape or when it is curved and changes its direction, as is sometimes required for layout reasons. Therefore, the external and internal aerodynamics of air intakes should always be treated together.

Next, we discuss briefly the design of air intakes to operate at supersonic speeds. Even more than at subsonic speeds, an air intake’s function is to re­tard the air from a supersonic Mach number and to deliver it to the engine

(say, to the compressor face of a turbojet) at a subsonic Mach number and in­

creased pressure, unless we design for supersonic combustion. Such compres­sions are usually effected through one or several shockwaves, and we can de­sign the compression surfaces needed in much the same way as we designed com­pression surfaces for lifting bodies from known flowfields, as discussed in Section 3.4. In fact, this kind of intake design preceded the design of lift­ing bodies. Consider, for example, the curved wedge surface with a centred compression of an infinite number of weak shockwaves, as shown in Fig. 3.10. This flow can readily be converted not only into that past a lifting body (Fig. 3.11) but also into that of an efficient air intake, as first proposed by К Oswatitsch (1944) and (1947), and as indicated in Fig. 3.26. The last

characteristic through the centre C can be regarded as the plane of the in­let and the streamline through C can be replaced by a solid wall downstream

of C and regarded as the inner wall of the inlet cowl. This centrebody in­

take delivers air at a uniform’velocity and pressure into the duct (in inviscid

Elements of propulsion engines

Fig. 3.26 Supersonic flow past the centrebody of an air intake with cowl

flow). In principle, the air can be retarded further in a subsonic diffuser downstream of the inlet.

This kind of intake design has several drawbacks; some are associated with the relatively large deflection of the intake flow from the mainstream direction. Although the compression itself is very efficient, the Townend surface in Fig. 3.11 does not necessarily lead to an efficient lifting body and the Oswatitsch intake in Fig. 3.26 is not necessarily an efficient air intake, in an overall sense. Within the duct, the air must be turned back into an axial direction, and this presents difficulties. In the external flow, the shockwave emanating from C causes a drag force on the forward-facing surface of the cowl. Thus engine cowls of this kind have an associated wavedrag, (see e. g. G N Ward (1948) Apart from these drawbacks, there is the usual question of whether a viscous flow can be fitted into this inviscid flow without upsetting it all, through flow separations. Further, there are the problems associated with off-design conditions when the infinite number of compressions, centred on the lip of the intake at C, can no longer exist. A different flowfield involving a shock system detached from the lip of the intake will then appear. Especially the final shockwave is likely to stand off from the lip of the intake, i. e. the intake is what is called spilling. These problems of intake design form a specialised branch of aerodynamics, and we can refer here only to the relevant literature (see e. g. AGARD Conference Proceedings CP-91 (1971), A Ferri (1972)) Some similar problems which occur in off-design conditions of lifting bodies will be discussed in Section 8.3.

A centrebody intake like that in Fig. 3.26 can be axisymmetric or twodimen­sional; it can be split along a plane of symmetry. Further, the centrebody it­self can be a right-circular cone or a straight wedge and produce only one shockwave; it may have one or several kinks so that the changes in flow direc­tion lead to one or several additional shockwaves. Thus a great variety of supersonic air intakes can be designed by this approach. In all cases with more than one shockwave, the boundary layer on the protruding compression sur­face is subjected to adverse pressure gradients and, to keep the flow attached, boundary-layer control in the form of suction through bleed slots is often applied. For flight at low-supersonic speeds, the compression surface may be omitted. In such a pitot intake, the air is compressed through a shockwave mainly at right angles to the inlet stream, which is detached from the nose of the intake, and the intake is then spilling under all conditions in supersonic flight.

In general, the air entering the inlet experiences an increase in entropy through shockwaves or due to the effects of friction before it reaches the en­gine face. We have already seen the effect of a shockwave just upstream of a non-ducted burner on the flow cycle in Fig. 3.19, where the change from state 0 to state 1 involves a large entropy increase. To define such inflow los­ses in a general way, we compare the real flow from freestream conditions

Elements of propulsion engines

Fig. 3.27 Isentropic and non-isentropic inflow into an air intake

(subscript 0) up to the inlet or a station inside the duct (subscript i) with an isentropic inflow up to the same station (parameters marked by a dash), as indicated in Fig.3.27. To determine the respective states fully, we assume the same volume flow into the inlet in the two cases: V^’ = V^. In the ideal in­

flow, the temperature would rise from T0 to T^’, the entropy remaining un­changed. Since V£ = ‘, we find that the enthalpy and the temperature at the
inlet are the same for the two inflows, which follows from (3.52) and the assumption that no technical work is done during either change of state. A lower pressure is, therefore, reached in the real flow, i. e. p£ < p|, and the entropy increase can be expressed in terms of a pressure loss:

*i – *0 – R1"(jr) ■ * 1,1 i – 4^1 > 0′ (3,TO

This affects the flow cycle of the engine and reduces its efficiency.

Подпись: n ram Подпись: (3.90)
Elements of propulsion engines

Now, the pressure rise in the real inflow from p0 to p^ could have been obtained with a temperature rise from Tq to T| , had the inflow been isen – tropic. We can, therefore, introduce a ram efficiency

For ideal gases, this ram efficiency can be expressed as a function of the flight Mach number Mq, the inlet velocity ratio V^/Vq, and the pressure-loss coefficient ЛРі/Рі’. Under given flight conditions, the ram efficiency is proportional to Api/pj/. Since it can be shown that the loss of efficiency of a complete engine due to inflow losses is also proportional to Др^/р^’, to a first order, it follows that the overall efficiency is reduced directly in proportion to the ram efficiency by these inflow losses. This makes it very important to design air intakes with a good pressure recovery.

In this analysis, the flows were still assumed to be uniform so that a one – diemsnional treatment was adequate. In reality, inflow losses are often accom­panied, or caused, by significant non-uniformities in the velocity distribu­tion across the engine face, which may also be highly unsteady. The associa­ted thrust losses and increases in specific fuel consumption can be serious; they are much more difficult to assess in a general way. The nature and amount of the non-uniformities will have to be measured and their effects assessed individually for any given engine.

The outflow from an engine, which leads to the formation of a jet, usually takes place through a nozzle. The outflow can be regarded as a near-isentropic change of state during which the pressure drops until atmospheric pressure is reached, i. e. pj = Pq. This often happens at the end of the nozzle. Geo­metrically, the nozzle is a contraction as long as the Mach number at the nozzle exit is smaller than unity. If the flight Mach number is supersonic, the velocity in the jet must still be higher than the flight speed so that a thrust force is produced, and the convergent-divergent shape of a Laval nozzle may then be used to speed up the air to supersonic Mach numbers. What interests the aircraft designer, in particular, is the size of the nozzle area in rela­tion to the largest cross-sectional area of the whole engine. This determines whether or not the external shape of the rear end is boattailed and this, in turn, affects the drag of the engine and of its installation. These matters will be discussed later in Section 5.9.

The concepts and flow models discussed so far are based on the assumption that a certain part of the airstream past the aircraft can be identified, which is subjected to an addition of energy. This can most easily be defined in the case of isolated engine nacelles, which produce thrust forces essentially in­dependently of other parts of the aircraft. Thus the engine nacelle must be

designed in such a way that it can carry the whole thrust required. To illu­strate where the thrust forces act on a complete engine nacelle, we consider the simple case of a subsonic ramjet, as shown in Fig. 3.28, which is instruc­tive because the forces can only act on the fairing (if we ignore possible drag forces on the burner elements or flameholders). For a particular set

Elements of propulsion enginesLIVE GRAPH

Подпись: Fig. 3.28 Thrust forces on a subsonic ramjet. MQ * 0.8; = 3;pgVg/p^VQ =0.3

Click here to view

of values of the flight Mach number, the mass-flow ratio, the heat input coef­ficient Cq, and hence a given total thrust Tht, the diffuser area ratio A^/Ag is varied. In this particular case, there is always a certain drag force on the rear of the fairing, acting partly as overpressures in the nozzle and partly as suction over the outer surface of the boattailed rearbody. The thrust on the intake and in the diffuser must, therefore, together sustain more than the total thrust. As the inlet area decreases, the diffuser takes more of the thrust force, thus relieving the suction over the outer surface of the intake. This example demonstrates that the main aerodynamic problems are once again reduced to the design of shapes with adverse pressure gradients along the walls, which allow the viscous layer to flow along them without caus­ing a flow separation. A useful overall survey of ramjet performance has been given by H Gorges & J E P Dunning (1949).

Since the presence of the fairing is essential to the generation of thrust, the viscous layers along it must generate drag forces at the same time so that the effective thrust is always less than that associated with the thermodyna­mic flow cycle. These friction forces are unavoidable; their magnitude depends on the extent of the wetted area and on the state of the boundary layer and must be determined in each individual case. The friction forces matter more when the wetted area is large in relation to the cross-sectional area of the

engine and when the thrust per unit frontal area is small.

We have already seen that the fundamental principles of thrust generation are much the same whether the flight speed is subsonic or supersonic, but there are differences in detail. In particular, the shape of a fairing or of any other solid body to take the thrust forces depends strongly on the Mach number and, at higher Mach numbers, the body is generally designed to sustain not only thrust but also lift forces. These propulsive lifting bodies will be dis­cussed in Section 8.6.

We have discussed the generation of propulsive forces so far mostly in terms of energy addition in the form of either heat or mechanical energy. But the most common engines in aircraft propulsion at present, installed in nacelles, are turbojets, which are mixed engines in the sense that both heat and mecha­nical energy are supplied (for more detailed information see e. g. J Chauvin

(1969) ). The principles of thrust generation are much the same as those dis­cussed above. The thermal efficiency of the flow cycle of a turbojet engine shows an overall gain at subsonic and low-supersonic Mach numbers, compared with a pure heat engine, even though part of the available mechanical energy is not now used to form a jet but to drive the turbine which, in turn, drives the compressor. There are many variants of the turbojet engine. For example, in bypass or fan engines, a pure turbojet is surrounded by a second ducted air – stream, in which mechanical energy is supplied to that stream by means of a fan. This is closely related to the ducted propeller discussed above. Alto­gether, we can conceive of a whole spectrum of types of engine, as has been indicated in Fig. 1.1.

In many practical cases, the engine may not be installed in an isolated nacelle but in the fuselage or in or near a wing. There are then significant inter­ference effects between engine and airframe flows, which cannot be ignored. Inlet and exit flows and jets must then be considered in their proper environ­ments, that is to say, in the flowfields induced by the other parts of the air­craft. These problems will be discussed later in the context of the particu­lar types of aircraft where they arise.

Propulsion flow cycles

3.6 We consider now the changes of state of a cer­tain mass of air, or system, between a station 1 just upstream of where energy is supplied and a station 2 just downstream of it. All properties and functions of state of the medium used here are specific values, referred to unit mass. In undergoing a change of state, the flowing air delivers to the

surroundings mechanical energy which can be technically utilised. This energy we shall call the technical work, denoted by w. Mechanical energy may also be delivered to the air from the outside. Since the system considered is the air, this, by our definition, is negative work. To write down an energy balance for a flow process, we must include the kinetic energy e^ » ,

where V is the velocity of the medium, and the heat supplied, q^ • Final­ly, we must include the work done on the medium in state 1 in delivering it across a surface of area S to the region in which the change of state takes place and the work which it does in leaving the region in state 2. To dis­place the gas which is in the surface a distance dx through it, work pjSdx is done, that is, work p^Sdx is done in delivering a mass Sdx/v^ , where v^ is the specific volume (referred to unit mass). Then the work done delivering unit mass is p^Sdxv^/Sdx = p. v^. Similarly, work P2V2 is done by unit mass of air leaving the region. This can be shown to be the specific enthalpy h which, for an ideal gas, can be written as с T, where c_ is the specific heat at constant pressure and T the absolute temperature.

We shall restrict ourselves to ideal gases as these show the main effects we want to consider. This means that the basic functions of state: pressure p, density p, and temperature T, are not independent of one another but obey the equation of state

p = PRT, (3.51)

where R is a characteristic dimensional constant of the gas concerned (for air, R “ 287 m^/s2°K). Altogether, we have for the energy balance between the two states*)

hl + *kl

+ q12

“ W12 + h2 +

ek2

or

CPT1+ ekl

+ q12

‘ W12 + CpT2

+ ek2

► .

(3.52)

or

d’w

= – dh-dek

+ d’q

This may be called the first law of thermodynamics for flowing media. To be complete, the relation should contain also the changes in potential energy of position, which are ignored here. In some cases, technical work and kinetic energy may conveniently be taken together as the available mechanical energy of the flow:

ea = w + ek. (3.53)

Air enters with kinetic energy and e&^ = ekl" Energy is added by the

thermodynamic process and the available energy of the air is then ea2 = e^ + w.

To describe the flow cycle fully, we must also invoke the second law of thermo­dynamics, which relates to the availability of the energy of a system for con­version into mechanical work. It states the impossibility of converting into

*)

Some of the differentials are primed because neither q nor w is a func­tion of state. The integration of these equations can only be carried out if the path of integration is given, i. e. if the way in which the gas changes from state 1 to state 2 is fixed.

Propulsion flow cycles Propulsion flow cycles Подпись: V /reversible path Подпись: (3.54)

work all the heat supplied to an engine operating on a periodic cycle. The quantitative statement of the law, which we shall need here, defines a func­tion of state, the entropy s. If s^ is the specific entropy of a medium in state 1 and S2 is the specific entropy in state 2, then

Подпись: 2 1 actual path Подпись: or Подпись: ds Propulsion flow cycles Подпись: (3.55)

where the integral is taken over any reversible path by which state 2 can be reached from state 1. A reversible change 1 -* 2 is defined as a change such that both the system and its surroundings can somehow be restored exactly from state 2 to the original state 1. In an irreversible change, e. g. a process involving friction, the increase in specific entropy of a medium exceeds the value of the integral in (3.54). To include both types of process, we state

where the d’q now refers to the actual heat received in the change of state 1 -*• 2. Reversible and irreversible changes between the same conditions of a

system differ in the changes of entropy of the surroundings. Irreversibility is wasteful in the conversion of energy into mechanical work. All real flow processes are irreversible, but the idea of a reversible process is, neverthe­less, of practical value as a guide to perfection.

Reversible processes may be thought of as brought about by macroscopic motion. It is then conceivable that the process could be reversed and the original state restored. Irreversible changes may be thought of as brought about by microscopic motion. In that case, one cannot see how matters could be organ­ised so as to bring all the particles back to their original positions and states.

The second law of thermodynamics, as expressed in (3.54), is not used in the sense of providing a differential equation, as does the first law; but the second law is necessary to exclude certain processes that satisfy the govern­ing equations but are physically impossible because they lead to a net decrease in entropy.

In building up flat) cycles, we frequently meet some specific changes of state. Some of these are:

1 Isobaric processes, where p = constant, so that for perfect gases which obey (3.51),

p2/pl = Tl/T2 * (3.56)

In this case, the available energy remains constant.

2 Isothermal processes, where T – constant, so that

Подпись: (3.57)Pl/pl – P2/P2 •

In this case, all the heat is transformed into available energy.

3 Adiabatic processes, where d’q = 0, so that

Подпись:Подпись: (3.59)c dT – RT dp/p = 0 .

P

Integration gives the well-known relations

pl/p2 = (ti/T2>Y/(Y-1) pl/p2 = (P1/P2>Y f

pl/p2 = (T1/T2)1/(y_1)

where у = Cp/cv is the ratio of the specific heats, which we shall assume to be constant. Certain processes of this kind are isentropic, i. e. s2 ~ S1 = °*

4

Подпись: 7^T^+iv? + q.2 Подпись: (3.60)
Propulsion flow cycles

If no technical work is done, d’w = 0 , so that

In general, we present the variables in non-dimensional form. Reference values can easily be found in the undisturbed flow upstream of the body.

Those employed are pg, pg, and Vg. RTg is used as reference unit for specific energies. The energy equation (3.60) for perfect gases then reads in non­dimensional form

Подпись: i = V P2/p0 RT0 Y - 1 P2/P0 _<f > II where II CM *° YPQ/PQ Подпись: * 2Й2Подпись: (3.61)_L_ LL^!2 + Im2

Y – • pj/pg 2 1

introducing the Mach number M (3.62) defines the velocity of sound in the undisturbed flow, used for reference here. There are, of course, various other ways of defining a Mach number and it is often convenient to use the local velocity of sound for reference. Bernoulli’s equation (2.11) is a special form of (3.60) for isentropic flows without heat supply.

We can now proceed to consider some complete flow cycles and begin with some simple cases where we assume that no technical work is done on the surround­ings, i. e. w ■ 0 in (3.52). This is a severe restriction; it implies that changes of state along streamlines in a complete flow pattern in two or three dimensions can be treated as those in a onedimensional flow along a streamtube. Within this restriction, we can use (3.50) and equate the available propulsive work per unit mass, V0(Vj – V0), to the specific thrust work, ThV0. In such a onedimensional treatment, we also ignore how any such changes come about; for example, we assume that heat is added at some station without considering the physical and chemical processes that must be involved. We also ignore any mass addition, e. g. by the fuel. But we can then get some first relations for the efficiencies with which energies can be converted into mechanical work and thus provide some basis for the approximations used in the overall assessment in Section 1.2.

Consider a flow cycle in which heat is supplied at constant pressure in a streamtube with slowly-varying cross-section. This is a fairly realistic case; it can be approached in combustion chambers with diffusion flames. In such a
process between stations 1 and 2,

q12 = q = cp(T2 – Tx) , (3.63)

so that the available energy remains constant by (3.52), i. e.

Леа “ i(V22 “ Vl2) * q12 ‘ cp(T2 " V “ 0 ‘ (3.64)

Подпись: Fig. 3.14 Flow cycle with heat addition at constant pressure

This means that the velocity does not change during heat addition.

In a T, s-diagram (for obvious reasons, we plot only the changes, As, in en­tropy), Fig.3.14, the process is represented by the isobar between points 1 and 2, and the area al2ba represents the heat input. To obtain something useful, we must add another change of state in the flow downstream of "combustion", in which the available mechanical energy is converted into kinetic energy. This change from state 2 to state j in the jet far downstream can be an expansion without further heat addition:

i(Vj2 " V22) " ~cp(Tj " V • (3.65)

Propulsion flow cycles

We find that the kinetic energy in the jet is the higher the cooler the jet is. This change is accompanied by a fall in pressure and must end on the isobar p * p0 because the pressure far downstream in the jet must be the ambient pres­sure. If no energy losses are involved, this isentropic change is represented by a vertical line 2 -»■ j in the diagram 3.14. It is essential, of course, that the isobar p * p0 lies wholly below the isobar of heat addition, p * plt and this implies that there must be a compression in the flow from p » p0 far upstream to p * p^ at the beginning of combustion, i. e. from 0 ■* 1 in the diagram. This change has again been assumed to be isentropic and without tech­nical work being done. The flow process can now be completed into a oycte by linking conditions far behind with those far ahead by adding a fictitious change of state from j to 0 at constant pressure, during which heat is rejected to the surroundings. This amount of wasted heat is represented by the area aOjba. It can be shown that the continuous flow process and the flow cycle are equivalent as regards the available energy and the total intake and output of energy. In particular, the area 012jO represents the work done on the flow.

In view of (3.63), it is convenient in this case to use Damktthler’s parameter q/СрТф for the nondimensional heat input. Since, for isentropic compressions
and expansions between the same isobars, without technical work being done, the jet temperature ratio is the same as the combustion temperature ratio,

Tj/T0 = T2/Tl • (3.67)

Подпись: T. -1 Тл Propulsion flow cycles Подпись: (3.68)

we can express the jet temperature in the form

Подпись: V. -1 V„ Propulsion flow cycles Подпись: 1 - Подпись: (3.69)

In this relation, the Mach number is referred to the local velocity of sound. We then find

This states that V- > Vq, and hence that a thrust force according to (3.50) can indeed be obtained, as soon as q > 0. But V – > Vq and T. > Tq also mean that energy in the forms of kinetic energy and of heat is lefi behind in the stream so that the generation of a thrust force must be paid for.

Propulsion flow cycles Propulsion flow cycles Подпись: (3.70)

To measure how efficiently the heat input q is converted into available thrust work Vq(Vj – Vq), an overall propulsive efficiency can be defined:

This is the same propulsive efficiency which appears in Brdguet’s range equa­tion (1.7), multiplied by H, the calorific value of the fuel. Now,

q “ pH, (3.71)

Подпись: % Подпись: V Подпись: (3.72)

where p is the ratio between the mass of fuel and the mass of air used in the combustion process. Hence,

This quantity should be as large as possible, which implies that the fuel-to – air ratio p should be as small as possible, that is, we want to burn lean mixtures.

Propulsion flow cycles Подпись: Y^h Подпись: (3.73)

It is convenient to split up the overall propulsive efficiency into two compo­nents, one mechanical and the other thermal, so that

Подпись: Vvi - V Kvj - vl) Подпись: ттЪг0 Подпись: (3.74)

The get efficiency гц, or Froude efficiency, measures the available propul­sive work in the jet in terms of the kinetic energy lost in the jet:

The thermal efficiency nth measures the kinetic energy in the jet in terms

of the heat input:

(3.74) together with (3.50)lead to an important conclusion: a given value of the actual thrust Th is generated most efficiently if the largest possible mass of air is captured and then subjected to the flow cycle with energy addi­tion. Further, the backward acceleration should be as small as possible and hence the jet velocity Vj should be as close as possible to the velocity Vq of the mainstream. We have reached similar conclusions in Section 3.1 with regard to the generation of lift forces, in that the largest possible mass of air should be given the smallest downward acceleration to generate the requi­red lift. However, as in that case, aircraft design does not require us to achieve the absolute optimum but only the best within a given set of constrai­nts and of other given quantities. In the present case of propulsion, there are many constraints imposed by the design of the airframe. One of these is the massflow through the propulsion device and hence its size, which must evi­dently be restricted by geometrical and structural considerations. We note, therefore, that the design of a propulsion system is quite inseparable from the design of the aircraft as a whole.

Подпись: or Подпись: h Propulsion flow cycles Propulsion flow cycles Propulsion flow cycles

In the case of constant-pressure combustion discussed above, Vj and Tj from (3.69) and (3.68) can be inserted into (3.74) and (3.75) and the component ef­ficiencies determined. With (3.67), the thermal efficiency is simply

Thus the thermal efficiency increases with increasing pressure ratio or increa­sing temperature ratio. This can readily be seen also from the diagram in Fig. 3.14: if the isobar 12 is shifted to higher pressures, the heat input is us­ed to better effect. (3.77) states, in particular, that ntjj increases strong­ly with increasing flight Mach number and approaches unity for infinite Mach number, if the Mach number at the beginning of combustion is kept constant.

This trend is general and not restricted to constant-pressure flow cycles only; it is the basis for Fig. 1.1 and for the assessment given in Section 1.2.

The thermal efficiency (3.76) of the constant-pressure cycle bears a formal re­semblance to that of the hypothetical Carnot cycle. This is built up of an isentropic compression 0 1, a supply of heat at constant temperature Tj,

1 •> 2, an isentropic expansion 2 -»• 3, and a rejection of heat at the con­

stant temperature T3 = Tq of the surroundings. The thermal efficiency is then given by (3.76), but Tj is now the highest temperature reached during the cycle, whereas T2 > T^ in the constant-pressure cycle. A Carnot cycle with T2 as the highest temperature would clearly have a higher efficiency than that given by (3.76). What matters here is that the constant-pressure flow cycle rejects the heat at too high a temperature and hence wastes more
energy during the absorption and delivery of heat, where differences in temp­erature occur between the source of heat and the working medium. This emphas­ises the importance of the maximum temperature reached in a cycle; it must also be one of the main engineering constraints in an actual engine.

The Carnot cycle is important in that it sets a standard, because the exergy of heat can be reached, i. e. the maximum work that can be done by a system when it is brought into equilibrium with its surroundings by reversible changes of state (see e. g. E Schmidt et аЪ. (1975)). It has been striven for by many as an ideal for a long time, but it was found very difficult to see how heat could be added to an actual flow, or subtracted from it, at a constant tempera­ture. Its realisation has been one of the goals of engineers ever since Carnot drew attention to the favourable properties of this cycle in 1824. It was only recently that E G Broadbent & L H Townend (1969) showed that, in principle, this goal oan be reached by an expanding and accelerating flow in which heat is added along a falling pressure gradient. Their analysis applies to a whole class of flows that have a certain kinship with the Prandtl-Meyer expansion. This arises from the fact that it is a turning flow around a corner and that, in cylindrical coordinates with the axis in the direction of no variation, the physical properties depend only on the turning angle ф and not on the radius r. A typical result of their analysis is shown in Fig. 3.15. The mainstream Mach number is Ho * 1 (which is not now a special case as in a Prandtl – Meyer expansion) and the flow is unheated up to ф – ф0 = 0.564. Thereafter, heat must be distributed in a precisely-specified manner in order to preserve isothermal conditions. A few streamlines are shown and a number of radii are labelled with the local values of the Mach number M, the pressure ratio р/р. and a parameter Q defining the heat addition per unit volume 0

Propulsion flow cycles<}(г, ф)

Подпись: Fig. 3.15 Flow with an isothermal expansion around a corner at Mg = 1. After Broadbent & Townend (1969)

where q is the local heat addition per unit mass. Although q varies inversely with r for ф fixed, Q is found to depend only on ф. This would

seem to be quite a realistic flow pattern which could have practical applica­tions in combustion chambers, or in afterburners or in base flows with com­bustion. What remains to be solved are the many problems of fuel injection, mixing, and chemical reactions in the combustion process.

Other attempts to approach the ideal have been concerned with the introduct­ion of heat exchangers into the cycle, without changing the pressures of the working medium and the temperatures of the heat sources. In principle, these heat exchangers pick up heat at the downstream end of the cycle, which would otherwise be rejected to the surroundings, and then move to the upstream end of the cycle to give the heat to the flow there. But the technical difficul­ties to be overcome are considerable, and there is as yet no such engine in the air.

Returning to flow cycles with cons tant-^pres sure combustion, we can determine the overall propulsive efficiency from (3.70) and (3.69) or (3.66) and work out some actual values when we apply the practical constraint that the maxi­mum temperature T2 in the flow should be limited. In the numerical examples given, we put T2/T0 $ 10, to indicate also that such effects as dissocia­

Propulsion flow cycles Подпись: (3.78)

tion of the air should be excluded since this would, in general, lead to further energy losses from the working fluid and invalidate the relations used. Writing the thermal efficiency from (3.76) in the form

Propulsion flow cycles Подпись: 1 Подпись: J h Подпись: (3.79)

we find that the heat input

must be kept low if nth to be reasonably high and if the maximum tempera­ture is prescribed. It must, in fact, be kept well below that of combustion of hydrogen, say, at the stoichiometric mixture, where q/cpTQ is about 15. Thus, as has been concluded before, one of the design aims is to bum tean mixtures for the sake of keeping the engine reasonably cool without a severe penalty in thermal efficiency. Since the size of the engine is also restrict­ed in practice, we are led to include in our considerations flow cycles where the mass flow of air per unit time through the engine is high. This means that the Mach number at the beginning of heat addition may have to be

supersonic in many cases.

Propulsion flow cycles Подпись: rh-[(‘ -V -'] <3-80)

Some numerical results are shown in Fig. 3.16. It is indicated where combus­tion is subsonic and where it is supersonic. This can easily be determined since the Mach number at the beginning of combustion, M^ , depends only on Mq and Tj and hence on nth (or on T2/T0 and q/cpTo):

by the energy equation for perfect gases. Hence M^ > 1 when

Подпись:„2 > ‘ * ГН "th

– "th

LIVE GRAPH

Click here to view

Подпись: 87Means for Generating Lift and Propulsive Forces

Подпись:
We conclude that ёгШвопго or supersonic combustion is not a matter for debate; it simply follows that, if a certain thermal efficiency is desired in a constant-pressure-combustion flow cycle, then combustion is supersonic above a certain flight Mach number. To illustrate this by a numerical example, nth 85 0.8 when Mi2 ■ 0.2Mq2 – i. e.

MX *

0

1

1.8

2.4

3.0

3.5

4.0

Mo =

4.47

5

6

7

8

9

10

If, at the same time, T2/T0 is restricted to 10, then Ti/Tq * 5 and q/cpT0 e 5 by 0.79). The ideal inflow pressure ratio is then Pi/po = 280 , which is a very high value by comparison with what can be achieved by mechani­cal means, such as compressors. From the results in Fig. 3.16, we might state that we should investigate further the range of flight Mach numbers between about 5 and 12 and the range of combustion Mach numbers between about 2 and 6 . Most of this work still remains to be done. These matters will be

discussed further in Section 8.5.

In Fig. 3.16, T2/T0 = 10 everywhere to the right of the dotted line. To the left of this, the ram pressure obtained in the inflow streamtube is not high enough to reach this temperature with the specified heat inputs, even though Mi has arbitrarily been put to zero. These cases are thus typical of what may be described as subsonic ramjets. Their propulsive efficiency falls rapidly with decreasing Mach number. This is partly because the compression ratio is becoming too low; and partly because the jet velocity increases and the Froude efficiency, nj, falls. Near Mq = 2 , even the ideal efficiency is no better than the actual propulsive efficiency of existing turbojet engines. Ramjet engines with supersonic combustion, or scramjets, come into their own at higher flight Mach numbers. It is interesting to note again that both the turbojet at low Mach numbers and the scramjet at high Mach numbers want a high excess of air in the combustion process, but for different reasons: in the

turbojet, this improves the Froude efficiency (and high-bypass engines are desirable in this respect); in the scramjet, this keeps the maximum tempera­ture within given limits for a given value of the thermal efficiency.

On the right of the dotted line in Fig. 3.16, and especially in the range of supersonic combustion, the Froude efficiency is generally quite good, which can be seen by comparing the actual values of Пр ■ nth ^j with the scale for nth

on the righthand side, which applies to the whole of the region to the right of the dotted line, where T2/T0 = 10. What matters there is primarily the mixture ratio and the proper coupling of flight Mach number and combustion Mach number.

Although the values shown in Fig. 3.16 refer to an ideal and simple flow cycle, they are certainly not so remote from reality that they could not serve as potential guidelines. The striking improvements with flight speed, in particu­lar, are based on simple physical arguments and therefore set a realistic aim for the future.

We must remenber that the numerical values in Fig. 3.16 refer to a series of different propulsion systems, designed for different Mach numbers. The charac­teristics of a given engine and the actual amount of fuel required to pro­pel a given aircraft at a given altitude and speed depend not only on the flow cycle of the air taking part in the combustion process but also on the proper­ties of the whole flowfield past the lifting propulsive body. Further, they depend on the total thrust needed and hence on the size of the combustion unit relative to the size of the body. Thus the design of any real propulsion system will require a careful and complex matching procedure, and general state­ments about the engine characteristics cannot readily be made. But we can say that, for an engine of given size and thermodynamic flow cycle, we would not want to keep the mass flow through the engine constant with speed and altitude. If we did, Vj would remain constant and the thrust would fall off with in­creasing speed, according to (3.50). Instead, we might aim at approaching a constant-volume flow, in which case V^/Vq would decrease with speed and Pl/p0 increase so that ntu from (3.77) would improve and Vj/Vq increase, according to (3.69). The tnrust could then be kept approximately constant with speed, although it would still fall with altitude. These are possibilities which can be exploited in propulsion systems with flow cycles – other systems are much more restricted.

We must also remember that the numerical values in Fig. 3.16 apply to an ideal flow cycle with constant-pressure combustion and no energy losses other than the heat rejected to the surroundings. There are many other possible sources of energy loss, and these will lower the propulsive efficiency. Before we can assess these, we must discuss in some more detail the flowfields which are associated with the flow cycles and also how thrust forces can be generated and where they can act.