
Our heavyweight helicopter equal in the world does not have
In Rostov started production of the most load-lifting rotary-wing car The Russian holding «Helicopt[...]

Everything about aircrafts and helicopters. News and events in aviation worldwide. Civil, transportation, military helicopters and airplanes.

Everything about aircrafts and helicopters. News and events in aviation worldwide. Civil, transportation, military helicopters and airplanes.

Everything about aircrafts and helicopters. News and events in aviation worldwide. Civil, transportation, military helicopters and airplanes.

Everything about aircrafts and helicopters. News and events in aviation worldwide. Civil, transportation, military helicopters and airplanes.


The various systems of analysis are based on the following logics:
■ direct measurement of the frequency through the use of narrow band filters;
■ measurement in the time domain (period counters);
■ measurement in the frequency domain (frequency spectrum).
4.3.7.1 Bank of filters
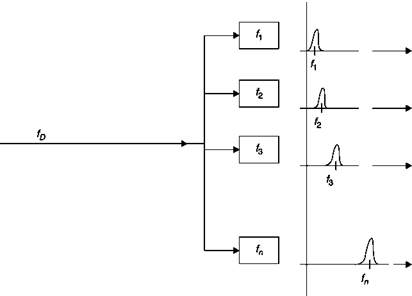
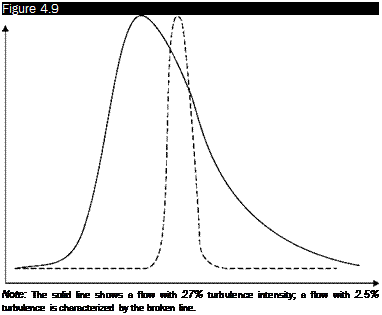
This is a very effective but a very expensive method: it needs a lot of filters connected in parallel, each corresponding to a different frequency. It is obvious that there will be an output signal only from the filter whose frequency is fD (Figure 4.20). Counting the number of signals passed by each filter, a histogram of the kind of Figure 4.9 can be drawn.
Since each filter requires a certain time (or a number of cycles) to decode the signal, it can immediately be seen that the great advantage of this system is speed: typically it can analyze in a given time a number of
 |
signals 50 times higher than those processed by a tuner that reviews in passing the different frequencies one after the other. Because of the high cost, this system is used only when necessary, as for example in the analysis of supersonic turbulent flows.
The LDA can obtain information on the speed of the particles and therefore, if certain conditions are met, on the fluid stream flowing in an extremely small volume and whose position can be controlled with precision.
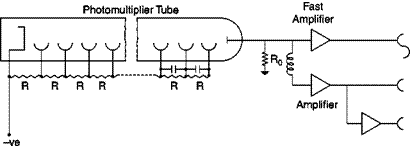
This information is in the form of a sinusoidal variation in the amount of light that reaches the surface of an optical detector that usually is a photomultiplier, since the intensity of the light scattered by the particles is low. Without going into the details of a photomultiplier, it suffices to say that variations in light intensity are converted into a proportional change in the flow of electrons whose number is amplified by a cascade system of electrodes, called dynodes (Figure 4.19), and finally collected by the anode in the form of an electrical signal variable over time.
An electrical signal whose frequency is proportional to a component of the particle velocity is generated:
fD = KUcos у
where fD is the frequency of the signal (Doppler frequency) and the constant K is a function of the wavelength of laser light and the geometry of the optical system. This extremely simple relation is the main attraction of LDA. The signals should be well separated in time: this can be achieved with a proper seeding of the stream which means that there should be only one particle at a time in the control volume.
The characteristics of the signal to be analyzed can be summarized as follows:
■ There is an intermittent signal that contains a number of periods less than or equal to the number of interference fringes, which means typically between 15 and 100, and the signal can be present for a certain percentage of the total time.
■
 |
The frequency of the oscillations can be different for each signal: in the particular case of turbulent motion in which the velocity varies over time, it is necessary to measure these variations in frequency.
■ The frequency range is very wide, typically from a few Hz to 100 MHz.
■ The signals are modulated on a continuous level (the pedestal) that can be lowered with a high-pass filter.
■ A certain amount of noise is superimposed on these signals due to noise in the photomultiplier and other electronic devices, optical noise produced by the higher order modes of the laser light scattered from outside the measuring volume, dirt, scratches on windows, ambient light, multiple particles, reflections from windows, lenses, mirrors. Furthermore, the signal can be very weak because the particle is too small or the distance of the measuring point from the photomultiplier is large; in some extreme cases, the signal to noise ratio can go down to 1.
A measure of the frequency of each signal is relatively easy (Figure 4.13): it is sufficient to count the number of complete oscillations per unit time, the speed is calculated from the measured frequency, so in theory the measure is obtained. If the motion is turbulent, however, it is unfeasible to memorize the signals from thousands of particles to get the histogram of Figure 4.9 for each component and analyze them manually, of course automated systems are needed.
If the direction of speed is not known, it is necessary to measure two components if the motion is 2D, or three components if the motion is 3D. If the flow pattern is constant in time, the various components of velocity can be measured by rotating the optical emission of the LDA, so that the bisector of the angle formed by the interfering beams is normal to the direction of the velocity component to be measured.
If the motion is unsteady, this technique cannot be used because the measurements of different components of velocity would be made at different times: in turbulent flow it is mandatory to measure all components simultaneously. With the same device (Figure 4.17), two components of velocity can be measured in the plane perpendicular to the optical axis, using an argon ion laser: the beam is split into two beams by a beam splitter, the green and blue colors are separated by a prism, pairs
![Подпись: Figure 4.17 Source: [2]](/img/3131/image237_1.gif)
Four beams LDA for the measurement of two components. Backscatter configuration
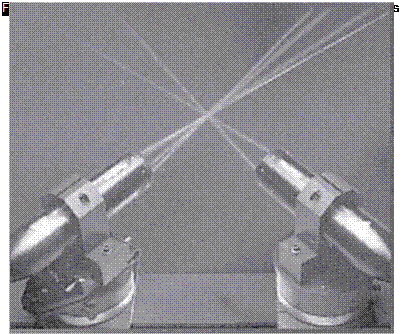 |
of each color beams are focused in two perpendicular directions in the same measurement volume.
The light scattered from particles contains both colors; two photomultipliers, each preceded by an appropriate interferometric filter, green or blue, respectively, will measure only one of the two components of velocity.
If a third component of velocity has to be measured, another separate LDA is needed with an optical axis normal to that of the 2D system (Figure 4.18) which uses a third color, such as the purple of an argon ion laser.
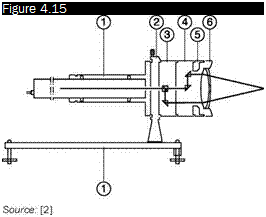
In the reference beam LDA, the direction of observation is that of the reference beam; in the crossed-beams LDA, this direction is free. Taking the forward-scatter signal (Figure 4.15) by placing the sensor on the opposite side of the light source with respect to the measurement zone, is advantageous in terms of signal strength but is not always possible and/ or convenient:
■ two optical accesses are needed in the test chamber, which is usual in a wind tunnel but can be very difficult in turbomachinery;
■ problems in collimation caused by vibration can arise.
By placing the laser and the sensor together (Figure 4.16) the problem of vibrations is eliminated, as they are treated in the same manner by the laser and by the photomultiplier; but operating in back-scatter, the light
 |
 |
Configuration of a forward-scatter crossed-beams LDA
intensity from the particles is reduced. In the back-scatter configuration the laser power must therefore be increased and/or the two beams can be focused in the measurement volume; with the latter technique, a double benefit is obtained:
 |
■ the measurement volume is smaller: it is possible to get measurements closer to the walls of the model or of the test chamber, preventing strong reflections that can distort the signal detection and damage the opto-electronic instrumentation
■ the contrast between light in the measuring volume and the surrounding region is greater so the signal from the region under investigation will be sharper, and more easily recognizable by spurious signals: ultimately a gain in SNR (signal/noise ratio) is obtained.
The focusing should not be too strong in order to prevent an excessive reduction of the number of interference fringes.
This device is different depending on the chosen configuration:
■ in the reference beam LDA, it consists of a series of very small orifices, e. g. 1 mm in diameter, and a photodetector. The diaphragms are designed to intercept all the light except that coming in the direction of the reference beam:
■ the crossed beams LDA includes a lens that allows the capture of scattered light in a large solid angle; a diaphragm in the image plane of the measurement zone stops the light scattered by particles passing through only one of the two laser beams, or worse, possible reflections of laser beams from the model or from the walls and the windows of the test chamber;
■ an interferometric filter with the wavelength of the laser stops the light from the environment or from any other source.
The LDA comprises three distinct parts:
■ an optical emission device, comprising a laser and a system of division of the beam (beam splitter);
■ a receiving device comprising an optical system as well as a photomultiplier;
■ a system for processing signals received by the photomultiplier.
4.3.4.1 Optical emission device
This device consists of a laser beam which is split into two parallel beams by a prism, then the two beams pass through a lens that makes them converge in its focus. The point of intersection of the two beams is the measurement volume. In the case of the reference beam LDA, a neutral density filter is interposed in the path of one of the beams in order to reduce its intensity.
 |
This system represents an improvement on the previous one and is also easier to be interpreted. The moving particle is illuminated by two light beams of equal intensity (Figure 4.11) obtained from splitting one laser beam. The particle scatters the light from each of the two beams: from
beam 1, with wavelength 1s1 and frequency fs1, and from beam 2, with wavelength 1s2 and frequency fs2.
Using Equation (4.3):
f1 = f0 +UU ■ (s – e,1) f2 = f0 +^’ (s e’2 )
Since, as we have seen, the variable part of the photomultiplier signal is only due to the difference of the frequencies, the Doppler frequency, we have:
f f2 – fsі =-^- (i – e2) (4.6)
From this equation some important conclusions can be inferred:
■ The frequency fD of the output signal of the photomultiplier is directly proportional to the velocity component (Ucosy normal to the bisector of the angle в formed by the two incident beams).
■ The frequency fD is independent of the direction of observation: this allows great freedom in the choice of configuration (forward – and back-scatter), and furthermore, allows the scattered light to be captured at a large solid angle and focused on the surface of the photomultiplier that therefore receives a much higher light intensity than in the reference beam system: a less powerful laser can be used.
■ The frequency fD can be made convenient for signal processing by an appropriate choice of the angle в between the two incident beams.
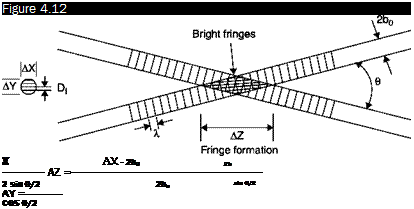
The crossed-beam system can be analyzed in a different way that leads to the interference principle. Consider the area where the two beams intersect (Figure 4.12): there are two beams of laser light from the same source coherent and with the same wavelength, l, and the same intensity I1 = I2 = I. By Equation (4.5):
![]() /1+2 = 2/[1 + cos (a1 – a2)] = 2I
/1+2 = 2/[1 + cos (a1 – a2)] = 2I
Since the pairs of interfering beams have different paths, the light intensity of their sum will vary with the difference in path lengths. The extreme cases are:
 |
Formation of interference fringes in the measuring volume of a crossed-beams LDA
Source: [1]
■ the difference in path lengths is equal to a multiple of the wavelength, f1 – f2 =N1 (N = 0, ±1, ±2….): the resulting light intensity is I1+2 = 47;
■ the difference in path lengths is equal to an odd multiple of half wavelengths, f 1 – f 2 = (2N + 1) 1/2: the resulting light intensity is zero, 71+2 = °.
In the area of intersection of the two laser beams, which is the measurement volume, a series of parallel interference fringes is generated; the distance between two consecutive fringes is:
![]() Я
Я
![]() 2 • І в 2sinl — ‘ 2
2 • І в 2sinl — ‘ 2
When a particle crosses the measuring volume, it is illuminated by a light variable with the Doppler frequency, recalling Equation (4.4):
so the velocity component normal to the fringes can be calculated by measuring the Doppler frequency and the distance between the fringes.
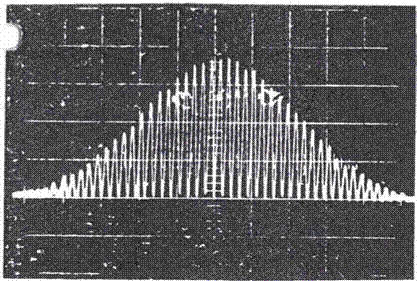 |
The trace on an oscilloscope of a typical signal is shown in Figure 4.13: since the laser beam has a Gaussian intensity distribution of light, even the signal has the same trend.
The angle of intersection of the two beams should be chosen so that the distance between two adjacent fringes is 10 pm. For Equation (4.9), this leads to signal frequencies of 50 MHz for a velocity component of 500 m/s. The precision with which the velocity of the particle can be measured knowing the Doppler frequency depends on the accuracy with which the distance between the fringes can be measured; the measurement can be done by projecting the magnified image of the fringes together with a microscopic net inserted in the control volume.
If the flow is turbulent (zone of separation, wakes, etc.), speed can be null or of unknown direction. The zero speed is not recognized because there is no output signal from the photodetector, the direction of the velocity component cannot be inferred from Equation (4.9) since the Doppler frequency is independent of the sign of the velocity component.
This ambiguity can be eliminated by passing one of the beams through a Bragg cell, which is an acoustic-optical modulator (Figure 4.14) consisting of a crystal or a liquid, transparent, to which a vibrator (a piezoelectric transducer) sends a pressure wave, and then a wave of an index of refraction with a constant frequency, typically 40 MHz. For the
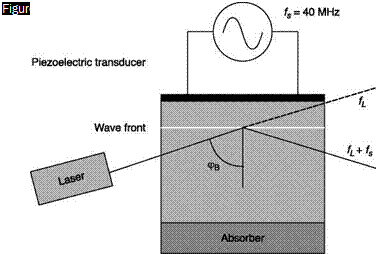 |
laser beam passing through the cell, this is a change of optical path with the same frequency of the vibrator.
At the intersection of the two beams, the interference fringes are apparently moving in the direction orthogonal to the fringes themselves with a speed that has to be algebraically summed to the particle velocity component normal to the fringes. In particular, a steady particle, due to the moving fringes, emits a signal with the frequency of 40 MHz; if the velocity of the particle is concordant or discordant with the motion of the fringes it will give a signal with a frequency less or greater than 40 MHz.
In another interpretation it can be said that the Bragg cell changes the frequency of the beam (frequency shift) that crosses it, giving rise to a constant Doppler signal which acts as a carrier for the signals generated by the moving particles.
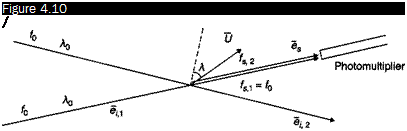
In this system, two laser beams converge on the area of measurement (Figure 4.10) and a photodetector is placed on the extension of beam 1. The particle, when crossing the measurement zone, scatters the light from both beams and the photomultiplier receives the beam 2 spread in the direction of beam 1, in addition to the direct beam 1 (the Doppler effect for beam 1 is null since the direction of observation and that of the incident beam coincide). The intensity of beam 1 must be strongly attenuated by a suitable filter to be made comparable with the faintest light scattered by the particle.
 |
Schematic of a reference beam LDA
The frequencies of the rays that reach the photomultiplier are:
fi = f f2 = f U • ( Єу2 )
A)
From Equation (4.5), the output signal from the photomultiplier has the frequency
f2 – fo = ‘U • ( – e,2 ) = fD
A)
In this system, the scattered light must be captured in a very small solid angle, as near as possible to zero, since the relationship between velocity and the Doppler frequency depends on the direction of observation. This feature is a major drawback since it results in a limitation of the intensity of the detected optical signal and therefore requires a high-power laser. The system is also sensitive to vibrations because it requires perfect alignment between the photomultiplier and the laser beam.
4.1.1 The Doppler effect
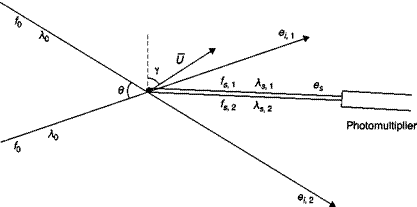
The laser-Doppler anemometer, invented in 1964 by Yeh and Cummins, is a tool that allows the measurement of the velocity of a particle from the difference in frequency between the light that strikes the moving particle and that is scattered and seen by an observer (Doppler effect).
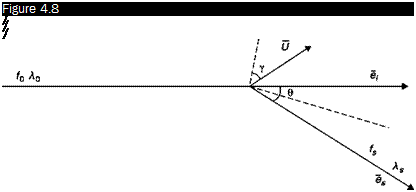
Consider a particle that moves with speed U and is hit by a laser beam of wavelength 10 and frequency f0 = c/10 (Figure 4.8). Denote with e the unit vector corresponding to the direction of propagation of the incident beam. The light is scattered by the particle in all directions (Figure 4.1). Consider the light scattered along the unit vector es, the frequency of this radiation is fs and the wavelength 1s, the Doppler effect is the difference in frequency fS – f0.
The speed of the wave fronts of the incident beam with respect to the particle is
c-U ■eI
thus, the frequency with which the wave fronts are intercepted by the particle is:
 |
Schematic representation of the Doppler effect
 |
|
The light re-emitted by the particle has the frequency f and the wavelength A _ c/f. A fixed observer, who receives the light scattered in the direction es, will intercept the wave fronts with the frequency:
From Equation (4.2), taking account of Equation (4.1):
Since 1S И l, then A A = A):
f _ fo +-y–ei)
A)
The difference in frequency due to the Doppler effect is thus equal to
fD _ fs – fo _ U• ( – A) (4.3)
A)
Recalling the meaning of the difference of two unit vectors, Equation (4.3) can be interpreted by saying that the detected Doppler frequency is proportional to the velocity component in the direction normal to the bisector of the angle в formed by the laser beam with the direction of observation:
r 0 • (вЛ Ucosy
fD _ 2s’“ll)— (4’4)
where у is the angle, unknown, formed by the velocity vector with the normal to the bisector of the angle в.
The benefits for an instrument which works on this principle are many:
■ It requires no calibration.
■ Measurements are made without disturbing the flow.
■ A velocity component can be measured in any desired direction (in the case of 2-D and 3-D flow fields, the resultant velocity vector can be obtained by, respectively, two or three measured components).
![]()
![]()
If the flow is turbulent, it is necessary to measure the speed of a large number, n, of particles and report its statistical distribution (Figure 4.9), it is possible to obtain the average velocity, Ucosy and the turbulence intensity, Tu, by calculating:
To measure a velocity component of a particle irradiated with a laser of known frequency, it should be sufficient to measure the frequency of the scattered light: this procedure is unfortunately impossible because it would be necessary to measure the effects on the frequency produced by the velocity of the particle (order 101 – r – 102 m/s) with respect to the speed of light (order 108 m/s) and so the measure would require
 |
Frequency histograms
Number of Events
a tool with a sensitivity of 10-6 – r – 10-7. The LDA must therefore rely upon a system able to measure the Doppler frequency, fD directly. This can be done by overlapping two electromagnetic waves with electric vectors
E = E (cos a + isin a1) E2 = E2 (cos a2 + isin a2)
where a = 2nft = 2’nct = 2n^ and I is the optical path; by indicating
Я Я ’
the intensity of waves with/1 = E and I2 = E^the intensity IU2 of the resulting wave is:
I1+2 = I1 + I2 + 2//"/~cos(a2 – a1) (4.5)
The resultant light intensity is thus composed of a continuous part and an alternative part that is proportional to the difference of the frequencies of the incident rays, linked in some way to the speed of the particle, in the case of LDA.
For the high degree of coherence, the laser appears an attractive light source for optical methods of visualization, especially for the interferometric methods, some of which can only be achieved if a laser is used as the light source.
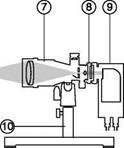
To use a laser as a light source in flow visualization, it is necessary to provide two optical components. The first is an objective of very small focal length, 1 cm or less, which makes the thin and parallel laser beam divergent. The focus of this lens coincides with that of a subsequent larger diameter lens through which the beam is made parallel before traveling through the test chamber. The set of two lenses is the beam expander (Figure 4.7).
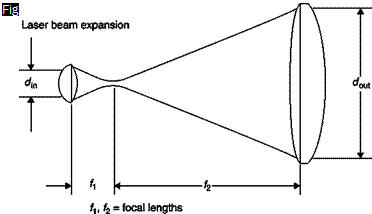 |
The second element is the pinhole that is necessary to clean the beam from the background noise of diffraction. Because of its high level of coherence, the laser light generates a significant configuration of diffraction images of rigid bodies and edges so that the cross-section of the beam is not evenly illuminated but disturbed by various fringes and interference patterns that can also generate diffraction of light on particles of dust on optical surfaces. Also, if there are higher-order transverse modes, the distribution of light in the focal plane of the beam expander is not a single bright spot but rather a pattern of diffraction usually in the form of some concentric circles of light and dark alternately. The diameter of the pinhole, which is placed in the focus of the beam expander, must
be so small as to let pass only the light of the inner circle, the image of zero-order diffraction; in this case, the cross-section of the beam becomes evenly illuminated. The pinhole and the beam expander form a spatial filter.