Category AERODYNAMICS, AERONAUTICS, AND FLIGHT MECHANICS

NACA 6-Series

The 6-series airfoils were designed to achieve desirable drag, com­pressibility, and Clmaj performance. These requirements are somewhat conflicting, and it appears that the motivation for these airfoils was primarily the achievement of low drag. The chordwise pressure distribution resulting from the combination of thickness and camber is conducive to maintaining extensive laminar flow over the leading portion of the airfoil over a limited range of Q values. Outside of this range, Cd and C|max values are not too much different from other airfoils.

The mean lines used with the 6-series airfoils have a uniform loading back to a distance of x/c = 2. Aft of this location the load decreases linearly. The a = 1 mean line corresponds to the uniform loading for the series-16 airfoils.

There are many perturbations on the numbering system for the 6-series airfoils. The later series is identified, for example, as j

NACA 65,-212 a = 0.6

— v 6.0

Here 6 denotes the series; the numeral 5 is the location of the minimum pressure in tenths of chord for the basic thickness and distribution; and the subscript 1 indicates that low drag is maintained at Cj values of 0.1 above and below the design G of the 0.2, denoted by the 2 following the dash. Again, the last two digits specify the percentage thickness. К the fraction, a, is not specified, it is understood to’equal unity. The 65r212 airfoil is shown in Figure

3.7.

T ift and drag curves for the 65i-212 airfoil are presented in Figure 3.8. Notice the unusual shape of Q versus CJ, where the drag is significantly lower between Q values of approximately 0 to 0.3. In this region, for very smooth surfaces and for Reynolds numbers less than 9 x Ю6, extensive laminar flow is maintained over the surface of the foil with an attendent decrease in the skin friction drag. This region, for obvious reasons, is known as the “drag bucket.” In practice this laminar flow, and resulting low drag, is diflicult to achieve because of contamination by bugs or by structurally transmitted vibration that perturbs the laminar boundary layer, causing transition. Chapter Four will discuss the drag of these airfoils in more detail.

NACA 1-Series (Series 16)

The NACA 1-series of wing sections developed around 1939 was the first series based on theoretical considerations. The most commonly used 1-series airfoils have the minimum pressure located at the 0.6c point and are referred to as series-16 airfoils. The camber line for these airfoils is designed to produce a uniform chordwise pressure difference across it. In the thin airfoil theory to follow, this corresponds to a constant chordwise distribution of vorticity.

Operated at its design Q, the series-16 airfoil produces its lift while avoiding low-pressure peaks corresponding to regions of high local velocities. Thus the airfoil has been applied extensively to both marine and aircraft propellers. In the former application, low-pressure regions are undesirable from the standpoint of cavitation (the formation of vaporous cavities in a flowing liquid). In the latter, the use of series-16 airfoils delays the onset of deleterious effects resulting from shock waves being formed locally in regions of high velocities.

Series-1 airfoils are also identified by five digits as, for example, the NACA 16-212 section. The first digit designates the series; the second digit designates the location of the minimum pressure in tenths of chord. Following the dash, the first number gives the*design Q in tenths. As for the other airfoils, the last two digits designate the maximum thickness in percent of chord. The 16-212 airfoil is shown in Figure 3.7.

AIRFOIL FAMILIES

t

NACA Four-Digit Series

Around 1932, NACA tested a series of airfoil shapes known as the four-digit sections. The camber and thickness distributions for these sections are given by equations to be found in Reference 3.1. These distributions were not selected on any theoretical basis, but were formulated to approximate efficient wing sections in use at that time, such as the well-known Clark-Y section.

The four-digit airfoil geometry is defined, as the name implies, by four digits; the first gives the maximum camber in percent of chord, the second the location of the maximum camber in tenths of chord, and the last two the maximum thickness in percent of chord. For example, the 2412 airfoil is a 12% thick airfoil having a 2% camber located 0.4c from the leading edge. The 2412 airfoil is pictured in Figure 3.7 along with other airfoils yet to be described.

NACA Five-Digit Series

The NACA five-digit series developed around 1935 uses the s ness distribution as the four-digit series. The mean camber line differently, however, in order to move the position of maximum camber

Whitcomb—type supercritical airfoil

C

NASA GA(W)—1

Figure 3.7 Comparison of various airfoil shapes.

forward in an effort to increase Indeed, for comparable thicknesses and cambers, the Qma values for the five-digit series are 0.1 to 0.2 higher than those for the four-digit airfoils. The numbering system for the five-digit series is not as straightforward as for the four-digit series. The first digit multiplied by 3/2 gives the design lift coefficient in tenths of the airfoil. The next two digits are twice the position of maximum camber in percent of chord. The last two digits give the percent thickness. For example, the 23012 airfoil is a 12% thick airfoil having a design Ct of 0.3 and a maximum camber located 15% of c back from the leading edge. This airfoil is also pictured in Figure 3.7.

AIRFOILS

A considerable amount of experimental and analytical effort has been devoted to the development of airfoils. Much of this work was done by the National Advisory Committee for Aeronautics (NACA), the predecessor of the National Aeronautics and Space Administration (NASA). Reference 3.1 is an excellent summary of this effort prior to 1948. More recently NASA and others have shown a renewed interest in airfoil development, particularly for application to helicopter rotor blades, general aviation aircraft, and aircraft operating at transonic speeds of Mach 0.7 or higher.

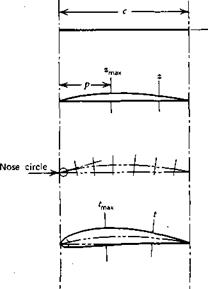
The development of an unflapped airfoil shape is illustrated in Figure 3.2. First, in Figure 3.2a, the chord line, c, is drawn. Next in Figure 3.2b, the camber line is plotted up from the chord a small distance z, which is a function of the distance from the leading edge. Next, as shown in Figure 3.2c, the semithickness is added to either side of the camber line. Also, the nose circle is centered on a tangent to the camber line at the leading edge and passes through the leading edge. Finally, an outer contour is faired around the skeleton to form the airfoil shape. Observe that the chord line is the line joining the ends of the mean camber line.

The early NACA families of airfoils were described in this way, with the camber and thickness distributions giveir as algebraic functions of the chordwise position. However, for certain combinations of maximum thick- ness-to-chord ratios, maximum camber-to-chord ratios, and chordwise posi-

<a)


(cl


(d)


Figure 3.2 The construction of an airfoil contour.


AIRFOILS

tion of maximum camber, tabulated ordinates for the upper and lower surfaces are available (Ref. 3.1). f

Before discussing the various families of airfoils in detail, we will generally consider the aerodynamic characteristics for airfoils, all of which can be influenced by airfoil geometry.

To begin, an airfoil derives its lift from the pressure being higher on the lower surface of the airfoil than on the upper surface. If a subscript l denotes lower surface and “m” denotes upper surface, then the total lift (per unit span) on the airfoil will be [1]

mLE (l/2)pVV (3’8)

Note that lowercase subscripts are used to denote coefficients for a two-dimensional airfoil, whereas uppercase subscripts are used for the three – dimensional wing.

Writing

Pi ~ Pu Pi ~ Po Pm ~ Po (1 mpV2 (l/2)pV2 (l/2)pV2

and redefining x as the distance in chord lengths from the leading edge, Equations 3.5 and 3.6 become

G= f (CPI – CPu) dx (3.9)

JO

and

CmLE = ~ j0 ~ *^X (3.10)

where the upper and lower pressure coefficients are defined according to Equation 2.73.

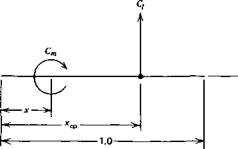
The moment calculated from Equation 3.10 can be visualized as being produced by the resultant lift acting at a particular distance back from the leading edge. As a fraction of the chord, the distance xcp to this point, known as the center of pressure, can be calculated from

-XcpCi = CmLE (3.11)

Knowing xcp, the moment coefficient about any other point, jc, along the airfoil can be written, referring to Figure 3.3, as

Cm = – (xcp – *) Cl (3.12)

AIRFOILS

Figure 3.3 Dimensionless moment at x produced by dimensionless lift acting at

It will be shown later that a point exists on an airfoil called the aerodynamic center about which the moment coefficient is constant and does not depend on Q. Denoting the location of the aerodynamic center by xac, Equation 3.12 can be solved for the location of the center of pressure.

AIRFOILS

Do not confuse the aerodynamic center with the center of pressure. Again, the aerodynamic center is the location about which the moment is constant, the center of pressure is the point at which the resultant lift acts.

The progressive development of an airfoil shape is illustrated by reference to Figure 3.4a and 3.4b. Historically airfoils developed ap­proximately in this manner. Consider first the simple shape of a thin, flat plate.

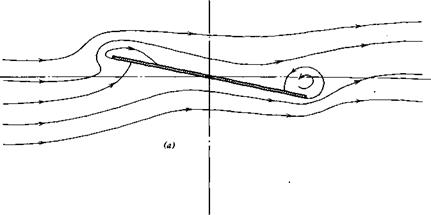
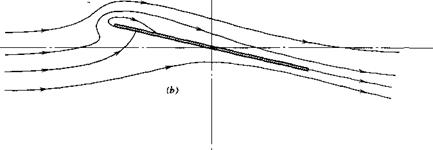
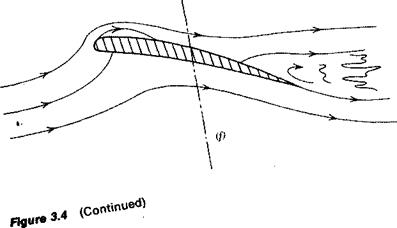
Beginning with Figure 3.4a if the angle of attack of a thin, flat plate is suddenly increased from zero, the flow will appear for a moment as shown. Because of near-symmetry, there is practically no lift produced on the plate. However, because of viscosity, the flow at the trailing edge cannot continue to turn the sharp edge to flow upstream. Instead, it quickly adjusts to the pattern shown in Figure 3.4b. Here the flow leaves nearly tangent to the trailing edge. This condition is known as the Kutta condition after the German scientist, W. M. Kutta, who in 1902 first imposed the trailing edge condition in order to predict the lift of an airfoil theoretically. In Figure 3.4b observe that there is one streamline that divides the flow that passes over the plate from that below. Along this “dividing streamline,” the flow comes to rest at the stagnation point, where it joins perpendicular to the lower surface of the plate near the leading edge. As the flow progresses forward along this line, it is unable to adhere to the surface around the sharp leading edge and separates from the plate. However, it is turned backward by the main flow and reattaches to the upper surface a short distance from the leading edge. The resulting nonsymmetrical flow pattern causes the fluid particles to ac­celerate over the upper surface and decelerate over the lower surface. Hence, from Bernoulli’s equation, there is a decrease in air pressure above the plate and an increase below it. This pressure difference acting on the. airfoil produces a lift.

If the angle of attack of the plate is too great, the separated flow at the leading edge will not reattach to the upper surface, as shown in Figure 3.4c. When this occurs, the large separated region of unordered flow on the upper surface produces an increase in pressure on that surface and hence a loss in lift. This behavior of the airfoil is known as stall. Thus the limit in Q, that is, Cimsx, is the result of flow separation on the upper surface of the airfoil.

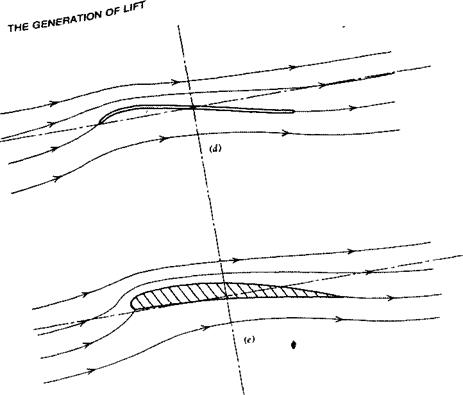
To improve this condition, one can curve the leading edge portion of the flat plate, as shown in Figure 3.4d, to be more nearly aligned with the flow in

AIRFOILS

AIRFOILS

AIRFOILS

Figure 3.4 Progressive development of airfoil shapes, (a) Flat plate at sudden angle of attack—no lift, (b) Flat plate at angle of attack in steady flow and generating lift, (c) Flat plate experiencing leading edge separation and loss of lift (stall), (d) Flat plate with curved leading edge to prevent leading edge separation, (e) Airfoil with thickness and camber to delay stall, (f) Airfoil with trailing edge separation.

AIRFOILS

AIRFOILS

that region. Such a shape is similar to that used by the Wright Brothers. This solution to the separation problem, as one might expect, is sensitive to angle of attack and only holds near a particular design angle. However, by adding thickness to the thin, cambered plate and providing a rounded leading edge, the performance of the airfoil is improved over a range of angles, with the leading edge separation being avoided altogether. Thus, in a qualitative sense, we have defined a typical airfoil shape. Camber and thickness are not needed to produce lift Gift can be produced with a flat plate) but, instead, to increase the maximum lift that a given wing area can deliver.

Even a cambered airfoil of finite thickness has its limitations, as shown in Figure 3.4f. As the angle of attack is increased, the flow can separate initially near the trailing edge, with the separation point progressively moving forward as the angle of attack continues to increase.

The degree to which the flow separates from the leading or trailing edge depends on the Reynolds number and the airfoil geometry. Thicker airfoils with more rounded leading edges tend to delay leading edge separation. This separation also improves with increasing values of the Reynolds number.

Leading edge separation results in flow separation over the entire airfoil and a sudden loss in lift. On the other hand, trailing edge separation is progressive with angle of attack and results in a more gradual stalling. The situation is illustrated in Figures 3.5 and 3.6 (taken from Ref. 3.1). In Figure 3.5 note the sharp drop in Q at an a of 12° for R = 3 x 10⁶, whereas for R = 9 x 10⁶, the lift curve is more rounded, with a gradual decrease in Q beyond an a of 14°. In Figure 3.6, for a thicker airfoil with the same camber, the lift increases up to an angle of approximately 16° for all R values tested. At this higher angle, even for R = 9 x 10⁶, it appears that leading edge separation occurs because of the sharp drop in Q for a values greater than 16°. From a flying qualities standpoint, an airfoil with a well-rounded lift curve is desirable in order to avoid a sudden loss in lift as a pilot slows down the airplane. However, other factors such as drag and Mach number effects must also be considered in selecting an airfoil. Hence, as is true with most design decisions, the aerodynamicist chooses an airfoil that represents the best compromise to conflicting requirements, including nonaerodynamic con­siderations such as structural efficiency.

Figures 3.5 and 3.6 illustrate other characteristics of airfoil behavior that will be considered in more detail later. Observe that the lift curve, Cj versus a, is nearly linear over a range of angles of attack. Notice also that the slope, dCJda, of the lift curve over the linear portion is unchanged by deflecting the split flap. The effect of lowering the flap or, generally, of increasing camber is to increase C( by a constant increment for each a in the linear range. Thus the angle of attack for zero lift, a0<, is negative for a cambered airfoil. In the case of the 1408 airfoil pictured in Figure 3.5, a0i equals -12.5°, with the split flap deflected 60°.

Figure 3.5 Characteristics of the NACA 1408 airfoil.

Section angle of attack, a0, deg Section lift coefficient, C,

Figure 3.6 Characteristics of the NACA 1412 airfoil.

Moment coefficient, Cf

If a is increased beyond the stall Q will again begin to increase before dropping off to zero at an a of approximately 90°. The second peak in C, is generally not as high as that which occurs just before the airfoil stalls. S. P. Langley, in his early experiments, noted these two peaks in the Q versus a curve but chose to fair a smooth curve through them. Later, the Wright Brothers observed the same characteristics and were troubled by Langley’s smooth curve. After searching Langley’s original data and finding that he, too, had a “bump” in the data, Wilbur Wright wrote to Octave Chanute on December 1, 1901.

“If he (Langley) had followed his observations, his line would probably have been nearer the truth. I have myself sometimes found it difficult to let the lines run where they will, instead of running them where I think they ought to go. My conclusion is that it is safest to follow the observations exactly and let others do their own correcting if they wish” {Ref. 1.1).

To paraphrase the immortal Wilbur Wright, “Do not ‘fudge’ your data—it may be right.”

THE GENERATION OF LIFT

Lift is the component of the resultant aerodynamic forces on an airplane normal to the airplane’s velocity vector. Mostly, the lift is directed vertically upward and sustains the weight of the airplane. There are exceptions however. A jet fighter with a thrust-to-weight ratio close to unity in a steep climb may be generating very little lift with its weight being opposed mainly by the engine thrust.

The component that is the major lift producer on an airplane and on which this chapter will concentrate is the wing. Depending on the airplane’s geometry, other components can contribute to or significantly affect the lift, including the fuselage, engine nacelles, and horizontal tail. These latter components will be considered, but to a lesser extent than the wing.

WING GEOMETRY

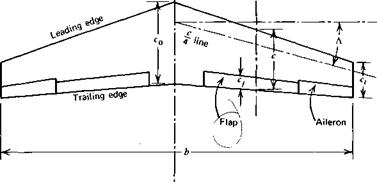
The top view, or planform, of a wing is shown in Figure 3.1. The length, b, from one wing tip to the other is defined as the wingspan. The chord, c, at some spanwise station, y, is the distance from the wing’s leading edge to its trailing edge measured parallel to the plane of symmetry in which the centerline chord, c0, lies. The chord generally varies with у so that, for purposes of characterizing wing geometry, a mean chord, c, is defined as the value that, when multiplied by the span, results in the planform area, S.

THE GENERATION OF LIFT(3.1)

The aspect ratio of a wing, A, is a measure of how long the span is with respect to the mean chord. Thus

THE GENERATION OF LIFT(3.2)

For a rectangular planform where the chord is constant, this reduces to

Подпись: c(3.3)

Hof air relative to wing)

——— У——— Э»

THE GENERATION OF LIFT

Figure 3.1 Top view of a wing (planform).

As shown in Figure 3.1, a wing planform may be tapered and swept back. The taper ratio, Л, is defined as the ratio of the tip chord, ct, to the midspan chord, c0.

A = — (3.4)

Co

The sweep angle, Л, is frequently measured relative to the quarter-chord line of the wing, that is, a line defined by the locus of points a quarter of the distance from the leading edge to the trailing edge. Л, on occasion, is also measured relative to the leading edge.

Usually the center portion of a wing is enclosed by tne fuselage. In such an instance the wing’s aspect ratio and taper ratio are determined by ignoring the?" fuselage and extrapolating the planform shape into the centerline. The midspan chord in this instance is thus somewhat fictitious. The wing root is defined as the wing section at the juncture of the wing and fuselage. Occasionally, in the literature, one will find wing geometry characterized in terms of the wing root chord instead of the midspan chord.

Approximately the aft 25 to 30% of a wing’s trailing edge is movable. On the outer one-third or so of the span the trailing edge on one side of the wing deflects opposite to that on the other. These oppositely moving surfaces are called ailerons; ailerons provide a rolling moment about the airplane’s long­itudinal axis. For example, when the aileron on the left wing moves down and the one on the right moves up, a moment is produced that tends to lift the

left wing and lower the right one; this is a maneuver necessary in making a coordinated turn to the right.

The inner movable portions of the wing’s trailing edge on both sides of the wing are known as the flaps. For takeoff and landing the flaps are lowered the same on both sides. There is no differential movement of the flaps on the left and right sides of the wing. The purpose of the flaps is to allow the wing to develop a higher lift coefficient than it would otherwise. Thus, for a given weight, the airplane can fly slower with the flaps down than with them up. Flaps, including leading edge flaps and the many different types of trailing edge flaps, will be discussed in more detail later.

* For some applications both ailerons are lowered to serve as an extension

I to the flaps. In such a case they are referred to as drooped ailerons, or I flaperons. When flaperons are employed, additional roll control is usually I provided by spoilers. These are panels that project into the flow near the trailing edge to cause separation with an attendant loss of lift.

In order to understand and predict the aerodynamic behavior of a wing, it is expedient to consider first the behavior of two-dimensional airfoils. An airfoil can be thought of as a constant chord wing of infinite aspect ratio.

The Numerical Calculation of Potential Flow Around Arbitrary Body Shapes

The preceding has demonstrated how particular body shapes can be generated by the superposition of elementary flow functions. This procedure can be generalized and the inverse problem can be solved where the body shape is prescribed and the elementary flow functions that will generate the body shape are found.

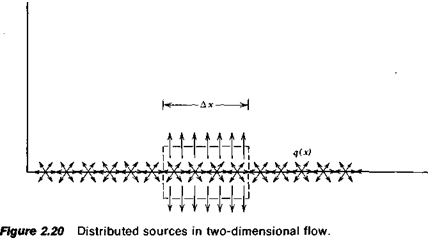
The concept of a point source or a point vortex can be extended to a continuous distribution of these functions. Consider first the two-dimensional source distribution shown in Figure 2.20. Here q is the source strength per unit length.

Consider the closed contour shown dashed in Figure 2.20, having a length of Дх and a vanishing small height. The total flux through this surface must equal q Дх. Close to the surface the и velocity components from the elemen­tal sources will cancel so that only a v component remains. Thus

2v Дх = q Дх

or

Подпись: £ 2 (2.82)

In Reference 2.4 this relationship is used to determine the flow about arbitrary shapes. Thus, unlike the Rankine oval, the body shape is specified, and the problem is to find the distribution of singularities to satisfy the condition that the velocity everywhere normal to the body surface to be zero. This particular problem is referred to as the Neumann problem. Essentially the numerical solution of the problem proceeds by segmenting the body

surface and distributing a unit source strength, q„ over the ith element. The normal velocity induced at the middle of the ith element by q> is obtained immediately from Equation 2.82. The contribution to the velocity at the ith element from another element is calculated by assuming the total source strength at the second element to be a point source located at the middle of that element. Taking n elements and letting і = 1,2, 3,…, n leads to a set of n linear simultaneous algebraic equations for the unknowns, qu q2, q3,…, q„.

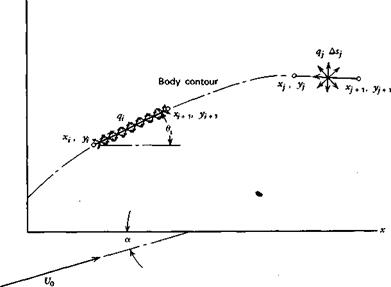
Consider in more detail this approach for two-dimensional flow. Figure 2.21 shows two elements along the surface of a body. The ith element is the control element over which the unit source strength q, is distributed. At the Jth element a point source is located having a strength equal to q; ASh ASj being the length of the /th element. The free-stream velocity U0 is shown relative to the body x-axis at an angle of attack of a.

At the center of the ith element the normal velocity components from each source and the free stream must vanish. Hence

a N

U0 sin (0, – a) = t + 2 4fn І * і (2.83)

Z j = i

Сц is an influence coefficient, which accounts for the geometry of the body shape in determining the normal velocity induced at the ith element by the source at the jth element.

If £ and t)j correspond to the midpoints of the ith element then, for Figure

2.21:

Подпись:

The Numerical Calculation of Potential Flow Around Arbitrary Body Shapes

_ sin (fl, – фц)

" 2тгг„

У

The Numerical Calculation of Potential Flow Around Arbitrary Body Shapes

Figure 2.21 Numerical solution of the Neumann problem by a distribution of sources.

гц = [(£ – Cif + Ы ~ Vi)2]m

(2.84 b)

<Pij tail у у

ьі ьі

(2.84c)

0;-tan-‘yi+1-*

(2.84 d)

Хі+і ~ Xi

£ = ^ (Xi + x/+i)

(2.84c)

Vi = (Уі + Ум)

(2.84/)

Having thus determined the source strengths, the resultant velocity at any location can be determined by adding vectorially the free-stream velocity to the contributions from all of the sources. Finally, the pressure distribution can be determined from Equation 2.74.

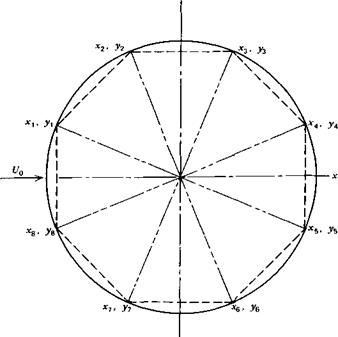
This numerical procedure applied to a circular cylinder with a unit radius is illustrated in Figure 2.22. Here, only eight elements are shown. For this case,

Xi = cos dj. y, = sin 0,

У

The Numerical Calculation of Potential Flow Around Arbitrary Body Shapes

Figure 2.22 Approximation to a circular cylinder with straight-line segments.

The Numerical Calculation of Potential Flow Around Arbitrary Body Shapes

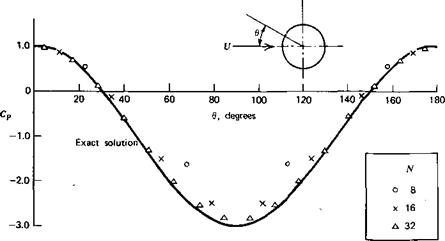
Figure 2.23 Convergence of the numerical result to the exact solution for a circular cylinder.

where

The Numerical Calculation of Potential Flow Around Arbitrary Body Shapes

n = 8

The numerical calculation of the pressure distribution around a circular cylinder is compared in Figure 2.23 with the exact solution given by Equation 2.78. As the number of segments increases, the approximate solution is seen to approach the exact solution rapidly. In Chapter Three this numerical method will be extended to include distributed vortices in addition to sources. In this way the lift of an arbitrary airfoil can be predicted.

The Calculation of Flows for Well-Defined Body Shapes

The flow functions described thus far are basic functions. By combining these functions a multitude of more complicated flows can be described. When combining these functions, the velocities will add vectorially. This is obvious from Equation 2.53a, since

grad ф = grad ф + grad ф2 + • • • or

v = v, + v2+–•

As an example of the use of these functions, consider the classic

У

The Calculation of Flows for Well-Defined Body Shapes

X = -1 X = 1

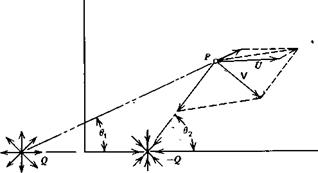
Figure 2.16 Source-sink combination in a uniforn^flow.

two-dimensional case illustrated in Figure 2.16. Here a source and a sink (a negative source) of equal strength are placed a unit distance from either side of the origin in a uniform flow. Three velocities from the source, sink, and uniform flow are shown added vectorially at P giving the resultant velocity, V.

It is easily verified that the entire resulting flow is symmetrical about both the x – and у-axes. To the left of the source along the x-axis a distance of ^ from the origin a stagnation point exists where the resultant velocity is zero/ The location of this point can be found from Equation 2.59 for the velocity from a source (or sink).

0 = U——- —- H————

2тг(Хо-1) 2ir(*o+l)

or

Xo2=1+47 (2.65)

7TU

It will be seen that this point lies on a dividing streamline that is closed and that separates the flow leaving the source and entering the sink from the uniform flow. The resultant streamline pattern can be constructed by- cal­culating the velocity at many points in the field and fairing streamlines tangent to these vectors. However, a more direct way is to form the stream function and then solve for y(x) for constant values of ф. Adding the ф functions for the uniform flow, source, and sink, one obtains

ф = ^(в1-в2)+иУ (2.66)

where в and в2 are shown in Figure 2.16. Because of the multivaluedness of the tangent function, one must be careful in evaluating this expression.

Подпись: 02-0,=
Подпись: 2ir'Uy Я Подпись: (2.67)

At the stagnation point, 0, = 62 and у = 0, so that ф = 0. Since this point lies on the dividing streamline, a value of ф = 0 will define this streamline. Hence

Since the flow is symmetrical, we only need to calculate the streamline shapes in one quadrant, say the one for which x and у are both positive. In this quadrant,

Подпись: 0, = tanУ

l + x

-i У

2 = 7г – tan – r^—

1-х

Hence x and у along the dividing streamline are related by

tan~‘ j _I*-yi = i}~2^y) (2’68)

This can be solved explicitly for x.

Notice that as у approaches zero in Equation 2.68, x approaches the value given by Equation 2.65.

Since any streamline can be replaced by a solid boundary, the dividing streamline represents a closed body. If it is assumed that the body’s fineness ratio (i. e., thickness to length) is small, then at its maximum thickness point (x = 0), Equation 2.68 can be written approximately as

2уо=тг(і-2-^у0)

or

Уо=2[1 + (тг Ulq) (2‘70)

y0 is the semithickness of the body corresponding to x0, the semilength. Hence the fineness ratio of the body, t/l, is related to ql U by

Подпись: (2.71)t qlU l 2[1 + (qlnU)]312

This classical body shape is referred to as the Rankine oval. The streamline pattern can be determined as a function of the streamline position far from the body. If y„ is the location of a particular streamline away from the body

then, for this particular streamline,

ф = у„и

Equating this to Equation 2.66, one obtains a relationship between x and у along the streamline as a function of y«, and ql U that can be solved explicitly for x.

The Calculation of Flows for Well-Defined Body Shapes(2.72)

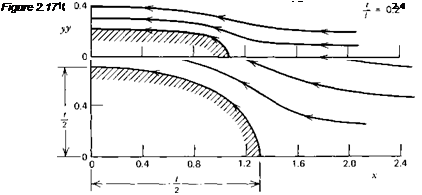
This relation was used to calculate the streamline patterns of Figure 2.17. Only the flow external to the dividing streamline is shown.

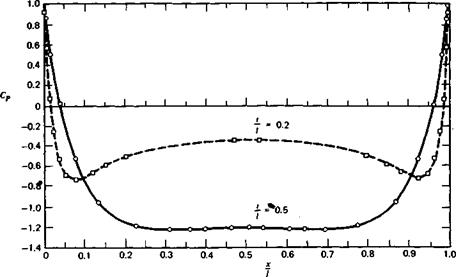
For comparison, this figure presents the streamline patterns (in one quadrant only) for 20% and 50% thick ovals. For each thickness, qlU was chosen on the basis of Equation 2.69. Because this equation assumes t/l to be small, the thickness ratio of the one shape is Slightly greater than 50%.

The Calculation of Flows for Well-Defined Body Shapes Подпись: (2.73)

Having defined the shape of a body and the velocity field around it, the next obvious point of interest is the pressure distribution over the body’s surface. In order to remove the dependence of the predicted pressure dis­tribution on the free-stream pressure and velocity, the pressure distribution is normally presented in coefficient form, Cp, where Cp is defined according to

From Equation 2.29, Cp is found from the ratio of local velocity to free – stream velocity.

Подпись: Cp = 1-The Calculation of Flows for Well-Defined Body Shapes(2.74)

Returning now to the Rankine oval, note first that Cp = 1 at the stagnation point where V is zero. Moving away from the nose along the ф = 0 stream­line, the velocity increases to a maximum at some location. Depending on the fineness ratio, this point of maximum velocity may or may not be at the maximum thickness of the body; that is, x = 0.

Although one could work with ф, knowing the source (and sink) strength the easiest approach is to calculate the и and v components directly by adding the components attributed to each elementary flow function. In this case it will be found that

u_ _ q Г x + 1_______________ x — 1 1

U0 2я-І/о L(x + 1)2 + y2 (x – l)2 + y2J

_v_ = 9 Г У_______________ У 1

U0 2irU0 L(x + l)2 + y2 (jt-l)2+y2J

The pressure coefficient is then calculated from

<2J5)

The pressure distribution along the surfaces of 20 and 50% thick Rankine ovals have been calculated using the preceding equations, and the results are presented in Figure 2.18. It is not too surprising to find that, for the 20% oval, the minimum pressure occurs near the nose, where the curvature is the greatest. For the 50% thick oval the minimum pressure occurs approximately halfway from the center of the body to the nose, but it is nearly flat over the middle 70% of the body’s length.

The Circular Cylinder

The flow field around a circular cylinder and resulting pressure dis­tribution can be determined as a limiting case of the Rankine oval. In Figure 2.16 the source and sink were placed at x = — 1.0 and x= 1.0, respectively. We will now move them instead toward the origin, but increase their strengths in inverse proportion to the distance between them. In the limit as the distance between the source and sink goes to zero, a so-called source-sink doublet is obtained.

Letting 2e equal the distance between the source and sink and m the

The Calculation of Flows for Well-Defined Body Shapes

Figure 2.18 Predicted pressure distributions for 20 and 50% thick Rankine ovals.


The Calculation of Flows for Well-Defined Body Shapes

The Calculation of Flows for Well-Defined Body Shapes

Подпись: :з+ Uym

2ir x2+ y2

For ф = 0, since у is not generally zero, it follows that

Подпись: 2irU2,2 m

X + y =

This is the equation of a circle of radius

R = {m!2-nU)m

Thus ф can be written in polar coordinates as

Ф = Ur sin в [l – (y) J


(2.76)


where r2 = x2+ y2

9 = tan" (l)


The tangential velocity along the surface of the cylinder is found from Equation 2.47 by differentiating ф with respect to r and evaluating the result at r = R. In this way ve is found to be

ve = 2U %тв (2.77)

The pressure coefficient distribution, from Equation 2.75, is thus predic­ted to be

Cp = 1 – 4 sin20 (2.78)

In Chapter Four it will be seen that Equation 2.78 agrees fairly well with experimental results over the front half of the cylinder, but departs from actual measurements over the rear portion as the result of viscosity.

A point vortex of strength у can be placed at the origin without altering the streamline representing the surface of the cylinder. If this is done, Equation 2.77 becomes

ve = 2U sin 0 + 2%r (2.79)

Relative to po the pressure on the surface of the cylinder will be

P-p0 = ^pt/2-|p J21/ sin 0 + 2^jrf| (2.80)

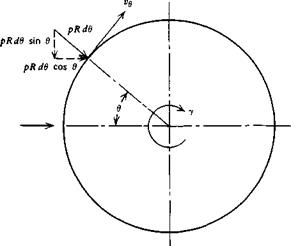
Referring to Figure 2.19, the net vertical force, or lift, on the cylinder resulting from the pressure distribution will be

L = — I pR sin в d6 Jo

The Calculation of Flows for Well-Defined Body Shapes

Figure 2.19 Circular cylinder with circulation.

or, from Equation 2.78, this reduces to

Подпись: (2.81)L = pUy

This is referred to as the Kutta-Joukowski law. Although derived here specifically for a circular cylinder, it can be applied to other shapes where у represents generally the circulation around the shape. This will be amplified further in Chapter Three.

The Calculation of Flows for Well-Defined Body Shapes

The net horizontal force, or drag, on the cylinder is found from

Using Equation 2.80, the drag is found to be zero, a result that is true in general for a closed body in steady potential flow. This result is known as D’Alembert’s paradox, after Jean le Rond D’Alembert, a French mathemati­cian who first reached this conclusion around 1743.

Biot-Savart Law

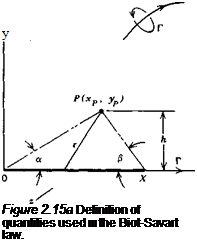
The three-dimensional velocity field associated with a vortex line is considerably more complicated and is given by the Biot-Savart law. The derivation of this law is beyond the scope of this text. Figure 2.15a illustrates

Biot-Savart Law

Figure 2.15b The Biot-Savart law for a straight-line vortex.

Biot-Savart Law Подпись: (2.63)

a portion of a vortex line about which at any point the circulation, Г, is constant. If v, is the velocity vector induced at any point, P, in the field by the vortex line, the Biot-Savart law states

This is the most general form of the Biot-Savart law. dR is the derivative of the radius vector from the origin to the vortex line and is thus the directed differential distance along the line, r is the radius vector from the point P to the line element dR. The positive direction of the circulatory strength, Г, is defined according to the right-hand rule. The x, y, z orthogonal coordinate system is also right-handed.

A special form of the Biot-Savart law for a straight-line vortex segment found in many texts can be obtained by integrating Equation 2.63. Referring
to Figure 2.15b, for convenience the line vortex is placed on the x-axis and lies between 0 and x. The z-axis will project out of the paper according to the right-hand rule. The circulation Г is taken to be positive in the x direction which means it will be clockwise when viewed in that direction. For this figure,

R = ix
OP + r = R

OP = і xp + j yp

Подпись: Thus
r = i(x-xP)-jyP dR = idx

so that

‘ j

к

rx dR =

(х-Xp) – yp

0

dx 0

0

= к yP dx

|r| = [_(x – Xp)2 + yp2]112

Equation 2.63 then becomes dx

V‘ ~ 4tt Jo [(x – Xp)2 + yP2]312

Подпись: This reduces toПодпись: ViПодпись:Biot-Savart Law(2.64)

a, /3, and h are defined in Figure 2.15b. Notice that the velocity has only a z component. As the line becomes infinite in length, the angles a and j3 approach zero, and Equation 2.64 reduces to the expression for the velocity around a two-dimensional point vortex given by Equation 2.56.

Elementary Flow Functions

If ф і and Ф2 are functions satisfying Equation 2.46 then, because this equation is linear, their sum will also satisfy Equation 2.46. In general, both the velocity potential and stream function can be constructed by summing less complicated functions.

Ф(х, у) = ‘2,фі(х, у) (2.53 a)

1-1

Ф(х, у) = фі(х, у) (2.53b)

І-l

Equation 2.53 represents the real benefit to be gained in describing a flow in terms of ф and ф. This statement will become obvious as the developments proceed.

The simple flows from which more complicated patterns can be

developed are referred to as elementary flow functions. There are three of them: uniform rectilinear flow, vortex, and source. The first of these has already been covered with ф and ф given by Equations 2.52 and 2.51, respectively.

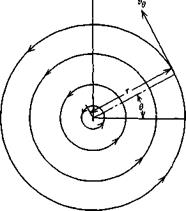
Vortex

A vortex is pictured in Figure 2.13. This flow in two dimensions is purely circular around a point with no radial velocity component. Denoting the tangential velocity component by ve, the problem is to find ve as a function of r that will satisfy the set of Equations 2.43a and 2.43b. ve is to be independent of в.

In polar coordinates,

Elementary Flow Functions

(2.54 a)


(2.54b)

where r and в are the polar coordinates, with vr being the radial component of velocity and ve the tangential component.

Since vr is zero in Figure 2.13 and ve is independent of в, Equation 2.54b is satisfied identically and, from Equation 2.54a

Elementary Flow Functions

or, after integrating,

rve = constant

У

Elementary Flow Functions


Figure 2.13 Flow field around a vortex.

Thus, for potential flow, the tangential velocity around a vortex must vary inversely with the radial distance from the center of the vortex.

The strength of a vortex, denoted by y, is measured by integrating the tangential velocity completely around the vortex. The value of this integral is independent of the path providing it encloses the singular point at the center of the vortex.

y = <fcv-dR (2.55)

Elementary Flow Functions Подпись: (2.56)

This closed-line integral of the velocity is known as the circulation. Evaluating Equation 2.55 on a constant radius leads to the relationship between the tangential velocity around a vortex, the radius, and the vortex strength.

Equation 2.55 is a well-known relationship and can be easily remembered from the definition of y.

ф and ф for a vortex follow immediately from Equations 2.50, 2.48, and

2.56.

If 6 is measured relative to zero and 6(B) is taken to be any value of 0,

Подпись: ф~2ъ(2.57)

The stream function for a vortex is found from

Подпись: r(B)гв

= -^ln – 2 7T r(A)

Letting ф(А) be zero and r(A) be an arbitrary radius, a, leads to

Подпись:* = – f

2 it a

The minus sign results from the choice of positive coordinate directions.

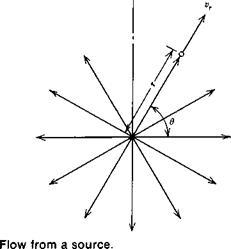
Source

The source is the counterpart of a vortex. Here the flow, pictured in Figure 2.14, is again symmetrical about the center, but it is entirely radial with no tangential velocity component.

Elementary Flow Functions

Подпись: Figure 2.14
Elementary Flow Functions

The strength of a source, q, is measured by the total flux emanating from the center. From Figure 2.14, q is obviously given by

q = 2tTtvr

Подпись: vr Подпись: _2_ 2-77T Подпись: (2.59)

or

In a manner similar to that followed for the vortex, one may verify that for the source

ф=^-1пг (2.60)

Elementary Flow Functions Подпись: (2.61)

2 tt

Equations 2.56 and 2.59, which define the velocities around vortices and sources, can be extended to three dimensions. If Q is the strength of a three-dimensional source, this flux will equal the product of the radial velocity and the surface area through which the velocity is passing. Thus, one can write vr immediately as

Подпись: (2.62)Подпись: Vr =Q

4ттг2

POTENTIAL FLOW

For a steady, inviscid, incompressible flow, Euler’s equations of fluid motion reduce to two relatively simple relationships that govern the velocity vector.

div V = V • V = 0 (2.43a)

curl V = V x V = 0 (2.43b)

The first equation satisfies conservation of mass; the second one assures that the dynamics of the flow is treated correctly.

In addition to satisfying Equation 2.43 one must assure that any mathe­matical description of the flow field around a given body shape satisfies the boundary condition that there be no velocity normal to the body at all points

on its surface. If n is the unit vector normal to the surface, the following must hold.

V • n = 0 (2.44)

Velocity Potential and Stream Function

To assist in the solution of Equation 2.43, two functions are introduced. The first of these is known as the velocity potential, ф, and is defined such that

(2.45)

Equation 2.45 satisfies identically Equation 2.43b. However, in order to satisfy Equation 2.43a, it follows that ф must be a harmonic function; that is,

V2d> = 0 (2.46)

POTENTIAL FLOW

The operator, V2, known as the Laplacian, is defined as

A flow for which Equation 2.45 is satisfied, and hence ф can be defined, is known as a potential flow. The resulting fluid motion is described as being irrotational. This follows since, in the limit at a point, the curl of the velocity vector, which is zero, is equal to twice the rotational or angular velocity.

The stream function, ф, is related to the velocity components by

дф и = —– ду

Подпись: (2.47)дф

v = – ~ дх

ф can only be defined for two-dimensional, or axisymmetric, flow. To obtain a particular component, the partial derivative of ф is taken in the direction normal to the velocity and to the left as one looks in the direction of the velocity.

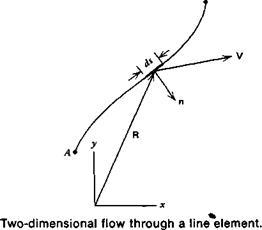
A line element is pictured in Figure 2.11 with flow passing through it. This element is a segment of an arbitrary line connecting two points A and B. The

в


Figure 2.11


POTENTIAL FLOW

iQ = f-dx+¥,ly

dx dy


or

Thus


dQ = di]/


ф(В) – ф(А) = Tv-ads Ja


(2.48)


That is, the change in the stream function between two points is equal to the flux between the points. It follows that ф is a constant along a streamline. This can be shown by noting that along a streamline


POTENTIAL FLOW

dф = 0


POTENTIAL FLOW

or

ф = constant (along a streamline)

The stream function, as a measure of the flux, satisfies identically Equation 2.43a. For an irrotational flow, however, in order to meet Equation 2.43b it follows that ф must also be harmonic.

V V = 0 (2.49)

In a manner similar to the derivation of Equation 2.48, the change in ф between two points can also be easily obtained. If

ф = ф(х, у)

then

йф = dx + ijL dy dx dy

= и dx + v dy

or, using vector notation,

ф(В) – ф(А) = Г V • dR (2.50)

JA

where R is the radius vector to the curve along which the integration is being performed, as shown in Figure 2.11. dR is then the differential vector along the curve, directed positively, with a magnitude of ds.

As an example in the use of ф and ф, consider the uniform flow pictured in Figure 2.12. For this flow,

и = U = constant v =0

ф will be taken to be zero along the x-axis. This choice is arbitrary, since the values of both ф and ф can be changed by a constant amount without affecting the velocity field obtained from their derivatives. Equation 2.48 will be zero if the integral is performed along a line for which у is a constant.

Figure 2.12 Uniform flow in the x direction.

Thus ф changes only in the у direction. Integrating Equation 2.48 in this direction gives

ФІУ) ~ <K0) = f (iU)idy Jo

от

Ф= Uy

If the uniform flow contains, in addition to U, a constant velocity component V in the у direction, ф becomes

ф = Uy — Vx (2.51)

The minus sign in Equation 2.51 is in accordance with the positive direction of n, as shown in figure 2.11. n is directed to the right as one looks in the direction of point В from point A. In this^case the integration for the second term is in the positive x direction, so n equals – j.

In a more formal manner, ф will be derived for this same flow using Equation 2.50.

V = і 17 + j V

R = ix + j у

Hence

dR = і dx + j dy

so that, taking ф = 0 at x, у = 0,

ф(х, y)= f Udx + Vdy Jo

= Ux + Vy (2.52)