Category Aerodynamics of V/STOL Flight

Aerodynamics of the wing

The theory of finite wings is well known. Developments based on lifting line theory can be found in many texts [1, 2] and several treatments of lifting surface theory may be considered classic [3, 4, 5]. A basic assumption in all of these presentations is that the trailing vortex system is aligned with the free-stream velocity. For the usual lift coefficients such an assumption is valid. However, for V/STOL aircraft that employ extreme methods of developing high lift the assumption must be re-examined. This chapter, therefore, treats the finite wing, with the deflection of the vortex system being considered. Such a consideration leads to several important differences between the linearized theory and the more exact treatment.

Two-Dimensional Airfoil Theory

Before we examine the general treatment of finite wings, the theory of thin, two-dimensional airfoils will be developed. An understanding of two – dimensional airfoil theory is necessary to the study of finite wings. Consider the two-dimensional thin airfoil shown in Fig. 3-1. The problem in predict­ing the potential flow about this airfoil is that of finding the functions ф and ф, which, in addition to being harmonic, will satisfy the boundary condition that the velocity normal to the airfoil be zero. In the solution of this problem one method consists of distributing point vortices along the mean camber line and adjusting their strengths to induce velocities which, when added vectorially to the free-stream velocity, produce velocities tangential to the mean camber line. These vortices are distributed in a continuous manner by defining a strength у per unit length such that the strength of a differential point vortex is у dx. Because the maximum camber is usually small in com­parison with the chord (less than 4%), the problem can be linearized by placing the distribution of у along the chord line and calculating the induced velocities there also.

Подпись: dv Подпись: у dx 2 n(x — x0) Подпись: (3-1)

A vortex of strength у dx placed at x will induce an upward velocity at A’o given by

To find the total velocity induced at x0 (3-1) is integrated over the chord.

Подпись:y(x) dx x — x0

The angle formed by this velocity and the free-stream velocity defines the local direction of the mean camber line of the airfoil at x0.
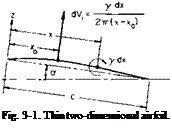
Подпись: Fig. 3-1. Thin two-dimensional airfoil.

If z is the upward displacement of the airfoil from a reference chord line

Aerodynamics of the wing Подпись: a. Подпись: (3-3)

at an angle of attack a to the velocity V, then to a small angle approximation

Thus we should be able to specify a y(x (-distribution and find by (3-2) and (3-3) the shape of the mean camber line and a to produce such a distribution.

There is one restriction on the choice of а у-distribution. It can be shown that if у does not vanish at the trailing edge of the airfoil r,(c) will be infinite. In order to ensure that r;(c) will be finite so that the flow can leave smoothly and tangentially from the trailing edge, the restriction is placed on у that

y(c) = 0. (3-4)

Equation (3-4) is known as the Kutta condition and is imposed as the result of experimental observations that in a real viscous flow the streamlines are tangent to the mean camber line at the trailing edge.

Подпись: x Подпись: I (1 - cos в). Подпись: (3-5)

It is convenient to transform Eq. (3-2) as follows: Let

Without any justification at this point, let us assume that y, now as a function of 0, can be expanded in the form

Подпись: у = 2VПодпись: (3-7)" (1 + cos 0) ” ‘

A°—– ;—a— + Z An Sln пв

sin 0 і

If we use the relationships

Aerodynamics of the wing

Подпись: (3-6)

Aerodynamics of the wing Подпись: (3-8)

j[cos(« — 1)0 — cos(n + 1)0] = sin пв sin 0

Aerodynamics of the wing Подпись: (3-9)

Eq. (3-6) becomes

Aerodynamics of the wing Подпись: (3-Ю)

From (3-9) and (3-3) it follows that

Thus from the above it is possible to determine the у-distribution pro­duced by a given airfoil geometry.

Aerodynamics of the wing

Consider now a portion of the vortex distribution shown in Fig. 3-2. If

Av is the velocity induced tangentially just above and below the vortex sheet, then by evaluating the circulation around the differential element we obtain

2Av dx = у dx

or

Ar = (3-11)

If sub и refers to the upper surface and / to the lower surface, then Bernoulli’s equation gives

Po + iPV2 = Pu + ЫУ + Ad)2,

Po + У V2 = pi + – Ad)2,

or

AP = Pi~ pu = pV(2Av) = pVy. (3-12)

The equation relating Дp and у could have been obtained immediately from the Kutta-Joukowski theorem, which states

F = pX x Г. (3-13)

For two-dimensional flow this becomes

L = pVY. (3-14)

Here L is the lift per unit span normal to V which is produced by the

circulation Г. The Kutta-Joukowski theorem can be proved by the applica­tion of the momentum theorem and Bernoulli’s equation to a control surface containing one or more vortices with a combined strength of Г.

Подпись: and can be obtained from Aerodynamics of the wing Подпись: (3-15)

The lift coefficient of the airfoil is defined as

Aerodynamics of the wing Подпись: dx Подпись: (3-16)

If у is given, C, can be found immediately. If the camber and angle of attack are given, then C, can be obtained from

A0 and Ax are determined from (3-10).

The moment, positive nose-up, on the airfoil about its leading edge can be determined from

The moment coefficient CmLE is defined by

p ^LE

mLE “ $pV2c2‘

In terms of the expansion for y, CmLE becomes

CmLE = (Л + A, – (3-17)

The moment about any other point on the airfoil is given by

M – MLE + xL

or in coefficient form

Г = Г + – С,

m vmLE 1 ^ /

= —— M0 + Ax————- — J + — (2nA0 + nAt).

The aerodynamic center of an airfoil is defined as the point on the airfoil at which the moment coefficient remains constant, independent of the angle of attack. Such a point can be found by differentiating the above with respect to a and equating it to zero:

dCm = 0 = (n 2яхас dA0 da. I 2 c J da

or from (3-10)

Thus the aerodynamic center, according to thin airfoil theory, is located at the quarter-chord point and is not a function of camber. The moment coefficient about this point is given by

Стао= ~^(Аг – A2). (3-19)

The Circular Arc Airfoil

As an example in the use of thin airfoil theory, consider first the case in which it is desired to produce lift with an airfoil of prescribed pressure distribution. Since Ap is proportional to y, let

У = Ушах sin в. (3-20)

Such a distribution is desirable, for example, from the standpoint of avoiding
compressibility effects in air or cavitation in hydrodynamic applications, for the low-pressure peak associated with the first term in the brackets of Eq. (3-7) is not present.

From (3-2)

V = Ушах p sin2 в dO

! 2n Jo cos в — cos в0

or

/max л

vt = —cos в.

which when substituted into (3-3) leads to

Подпись: Z = X. /max / 4

“+ 2V11-"

When x = c, z = coc, which means that the trailing edge and leading edge are aligned with the velocity V. Hence a is equal to zero and z will be given by

Подпись: 2c Vx(c — x)

Подпись: z Подпись: 2max Подпись: !■
Aerodynamics of the wing

or

where

Подпись:Ута»С 8F ‘

It can easily be verified, to the approximation that c « R, this is the equation of a circular arc with a radius of curvature given by

Подпись: 8z„R =

or

Подпись: Ушах (3-21)

ymax can be obtained from C,. From (3-15)

2FC,

n

Finally, the radius of curvature and the maximum camber are related to the chord and C, by

n c

2 c;

(3-22)

cC,

i

An

(3-23)

Thus to construct an airfoil with an elliptic chordwise pressure distribu­tion and producing a desired C, it is necessary only to construct a circular arc of radius R and chord c according to (3-22).

In the preceding discussion we have found the airfoil shape required to produce a desired pressure distribution. Now consider the calculation of the pressure or у-distribution produced by a given shape. Let us take as an example the same circular arc airfoil but at an angle of attack a different in general from zero. Again,

X / X

Подпись:

Aerodynamics of the wing

4- 1 —

Подпись:– cos в.

Thus from (3-10)

A0 = a,

Л __ ^max

Л1 — 5

Подпись: = 0,Aj — А-ш

Aerodynamics of the wing Подпись: V sin в Подпись: (3-24)

so that

Aerodynamics of the wing Подпись: (3-25)

and

Several important points may be noted from these results. First, the C, is directly proportional to a and to the ratio zmai/c. Second, the effects of the angle of attack and camber, both on C, and y, can be determined separately
and then simply added together. Also, notice that, for other than a = 0, у becomes infinite at the leading edge. The result is high local velocities in that region.

The Finite Wing
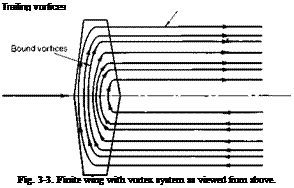
Подпись: Trailing vortices Fig. 3-3. Finite wing with vortex system as viewed from above.

A finite wing is shown in Fig. 3-3. The vortex system of this wing is made up of two sets of vortices; bound vortices, which run spanwise and are “bound” to the wing, and trailing vortices, which are shed from the wing and trail downstream. The trailing vortices are a consequence of Helmholtz’s theorem of vortex continuity. Since the lift distribution along the wing must diminish to zero at the wing tips, it follows from the Kutta-Joukowski theorem that the strength of the bound circulation must vary in the span-

wise direction. Hence from vortex continuity this change in the bound circulation must be shed downstream extending to infinity.

The direction of the vortices that constitute the vortex system of the wing are determined according to the right-hand rule. It can be argued from a physical viewpoint that in the vicinity of the tips the air tends to flow from the high-pressure region under the wing outward around the tips and in toward the center of the wing on the upper surface, where the pressure is reduced. Thus the trailing vortices are directed forward on the left side of the wing (looking forward) and aft on the right side. To form a closed system the bound vortices must then be directed from the left side to the right side.

The direction of the bound vortices can also be determined from the Kutta-Joukowski law. To produce a positive lift the circulation around a wing section, when viewed toward the right, must be in the clockwise direction.

As in the two-dimensional airfoil, the strength of the vortex system of the
wing, both bound and trailing vortices, must be adjusted so that the resulting velocities are everywhere tangent to the wing surface.

Consider the velocities induced along the chord of a section of the wing by the trailing and bound vortices, shown schematically in Fig. 3-4. Pro­vided the chord of the section is small in comparison with the span of the wing, the velocities induced along the chord by the trailing vortices are nearly constant and directed downward. Thus, the principal effect of the trailing vortices is to redirect the incoming flow downward through some angle to decrease effectively the angle of attack of each section of the wing. The angle through which the flow is directed downward is called the induced angle of attack a,. The velocities induced by the bound vortices, again provided that the chord of the section is small in comparison with

Подпись: Free-streom velocity

Aerodynamics of the wing

•Velocity due to trailing vortices

the span of the wing, are assumed to be related to the section camber and effective angle of attack in the same manner as the two-dimensional airfoil. Thus, the problem of the finite wing is reduced essentially to that of finding the velocities induced by the trailing vortex system.

The usual model assumed in calculating w, the downwash induced at the wing by the trailing vortex system, consists of a single bound vortex of vary­ing strength Г in the spanwise direction from which is shed the continuous trailing vortex sheet. The downwash is then calculated along the bound vortex line. Such a model is shown in Fig. 3-5.

In determining w, we must be careful of sign convention. The problem is one of integrating differential quantities; hence, in setting up the integration, all differential quantities must be shown generally in a positive sense. If, in going from у to у + dy, the strength of the bound vortex increases from Г to Г + dT, then, from vortex continuity, a trailing vortex of strength dT must be feeding into the bound vortex between у and у + dy. Hence by the use of (2-39), where cos a = 0 and cos /1=1, the differential downwash induced at some other location у must be given by

Aerodynamics of the wing(3-26)

In a general sense (3-26) is not the downwash but rather the velocity induced normal to the plane in which the trailing vortex sheet lies. If this plane is assumed to be horizontal or, more specifically, parallel to the direction of V, then dw will be the downwash.

The trailing vortex sheet must lie along streamlines; hence, because it induces a velocity approximately normal to itself over its entire surface, the trailing vortex sheet does not trail horizontally from the wing but is deflected downward. Because the induced velocities increase with greater distance behind the wing the deflection of the sheet increases as we move downstream toward an asymptotic value.

Подпись: у Г + СІГ

Consider for the present the velocity induced according to (3-26) by a flat

Fig. 3-5. Lifting line model of wing vortex system.

Aerodynamics of the wing Подпись: 1 - Подпись: (3-27)
Aerodynamics of the wing

vortex sheet whose strength is governed by a bound vortex with an elliptical distribution of Г over the span given by

If a coordinate transformation from у to 0 is made, namely,

Aerodynamics of the wing(3-28)

(3-27) becomes

Г = Г0 sin в.

The above в should not be confused with the в used in thin, two-dimensional airfoil theory. Equation (3-26) for this case becomes

Подпись: wГ0 f* cos в dO 2nb)0 cos в — cos 0o

Aerodynamics of the wing Подпись: (3-29)

With the aid of (3-8), we find that for the elliptic distribution w is a constant given by

Because w is a constant, the induced angles of attack are constant, so that for an untwisted wing the effective angles of attack of every section are the same.
Aerodynamics of the wing

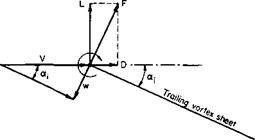
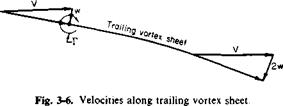
Consider now Fig. 3-6, which is the velocity diagram for a section of the wing. In accordance with the lifting line model, the chordwise distribution of у has been collapsed to a point vortex of strength Г. The vortex sheet is shed at some initial angle and curves downward asymptotically toward the angle sin-1(2h,/F). This asymptotic angle results from the fact that in the ultimate wake, in which the trailing vortex sheet extends from — oo to oo, the induced velocity will be twice that given by (3-29).

Because the shape of the vortex sheet and the variation of w in the x-direction are mutually dependent, the exact force system of the wing is most readily obtained by applying the momentum theorem to control sur­faces far removed from the wing. This procedure is carried out later. At present, it is instructive to consider an approximate possible limiting case.

We might argue that the induced velocity at the wing is determined mainly by the portions of the vortex filament close behind the wing, for after a time the action of viscosity will dissipate the vortices. Thus one limiting case that might be considered at the wing is shown in Fig. 3-7.

If the section lift is defined as the vertical component of the resultant force on the section, then

L = p(V — w sin <Хі)Г;

but

Подпись: w V sin a, =

so that the section Ct becomes

Подпись: '±o_ 2 bV 4b c0 Г / Г0

О с Г0 2bvj_

where c0 is the midspan value of the chord.

If the wing that is producing the elliptic Г-distribution is untwisted, the velocity diagram for each section must be the same. Thus, the dimensionless coefficients Ch Cd, and Cm must be the same, for they depend only on the angle of the flow relative to the section. It follows that if the section lift

Aerodynamics of the wing

Aerodynamics of the wing

Fig. 3-7. Approximate model of deflected vortex sheet.


coefficient is constant the chord distribution must vary in an elliptical manner in order to produce an elliptical Г-distribution.

Hence

c = c0 sin в

so that

Aerodynamics of the wing

Because C, is constant, the wing lift coefficient CL will have the same value. Thus

For an elliptic planform with a span of b and a midspan chord of c0 the wing area will be S = nbcj4. A parameter often used to characterize wing planforms is the aspect ratio. This parameter is the ratio of the length of the span to the length of a mean chord and is defined by

Aerodynamics of the wing(3-30)

Подпись: CL = Подпись: (3-31)
Aerodynamics of the wing Aerodynamics of the wing

For an elliptic planform the aspect ratio is AR = 4b/nc0, so that the expression for the wing lift coefficient finally becomes

This equation has a maximum value for Г0/2bV = or

C^, =71

or

CL = 1.21AR. (3-32)
Aerodynamics of the wing

The above represents a radical departure from ordinary lifting line theory. It has been shown that when account is taken of the deflection of the trailing

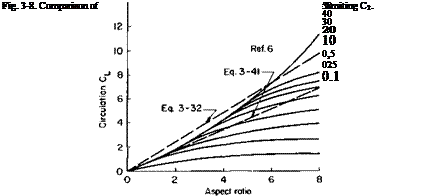
vortex system a limiting value is obtained for the lift of a finite wing due to circulation. Thus any device that attempts to increase the lift by increasing the circulation of a finite wing can never produce a lift coefficient greater than that given by (3-32). A comparison of (3-32) with experimental data obtained with jet-flapped wings [6] is presented in Fig. 3-8. As predicted, the experimental CL increases approximately linearly with the aspect ratio.

An implicit relationship can be derived between the induced drag of the wing and its lift. According to the approximation of Fig. 3-7, the drag of the wing is given by

D = pw cos ctjT.

In a manner similar to that used for CL the induced drag coefficient becomes

Подпись: = 0.855AR for C, (3-33)

Aerodynamics of the wing

Recall that TJlbV = w/V. If w is assumed to be small in comparison with V, then (3-31) and (3-33)-become

or

Aerodynamics of the wingC°M ttAR

The sub 0 refers to the fact that these relationships are all according to conventional wing theory.

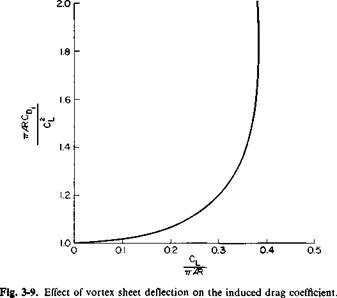
This is the usual result obtained from ordinary lifting line theory that provides us with an insight into the analysis of (3-33). Using (3-31) and (3-33) and dividing CD. by Cl/nAR, we obtain

Aerodynamics of the wing(3-35)

This relationship is presented graphically in Fig. 3-9 as a function of CJnAR. The departure of (71AR CD)jC from unity is a measure of the error involved in conventional wing theory. Observe that for CJnAR = 0.384, corresponding to the maximum value that this parameter can ever attain, the induced drag coefficient is nearly double that predictable on the basis of (3-34).

In order to gain an appreciation of these higher-order effects on the lift curve of a wing, consider the hypothetical case of an elliptic wing that generates circulation by angle of attack only. Further, unlike exact two – dimensional airfoil theory, which predicts that C, will vary as the sin a, some means is present to ensure that C, will vary linearly with a. Thus any departure from ordinary wing theory will be the result of accounting for the deflection of the vortex sheet and not the use of different two-dimensional characteristics.

In terms of the section slope of the lift curve, the force F in Fig. 3-7 would be given by

F = p{V2 – w2)ca0{<x – a,).

By resolving this in the lift direction, we have

L = p(V2— w2)ca0(a — a,) cos at

or

Подпись: CLAerodynamics of the wing(3-36)

Aerodynamics of the wing

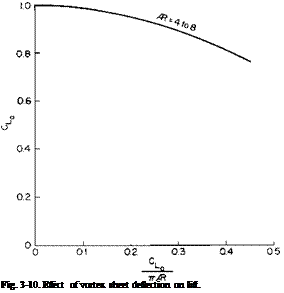
But CL was given before by (3-31) as a function of Г0/2bV. In view of the implicit relationship between CL, Г0, AR, and a, these results are presented

Aerodynamics of the wing

graphically in Fig. 3-10. Here, again, the value of CL is given as a proportion of the value that would have been calculated by using conventional wing theory. The relationship between CL, AR, and a, according to usual practice, can be readily obtained from (3-36) and (3-31) by assuming T0/2bV « 1 so that

, = a0«

Подпись:

Подпись: or

Lo 1 + aJnPR.

Подпись: Fig. 3-10. Effect of vortex sheet deflection on lift.

From this figure it can be seen that there is no dependence of the ratio CJCLo on the aspect ratio for the range considered when plotted versus CLo/7tAR. With regard to the errors that might be incurred if we applied ordinary wing theory to high-lift wings, consider a wing with an aspect ratio of 6. Suppose that, on the basis of two-dimensional airfoil data and con­ventional wing theory, the wing was predicted to develop a CLo of 4 [from (3-32) the maximum it could develop would be 7.25]. From Fig. 3-10, for CLJnAR of 0.212, a value of CJCIo of 0.936 is read. Thus the lift coefficient the wing would actually produce under the conditions in which it was expected to produce 4 would be only 3.75.

Although this development was limited to an elliptic Г-distribution, it might be expected that the results presented in Figs. 3-9 and 3-10 and Eq. (3-32) would hold equally well for other wings. The distributions of most wings approximate the elliptic. The results of conventional wing theory for elliptic wings, as expressed by (3-34) and (3-37) can be applied to most wings with small correction factors. Also, it should be kept in mind that the developments assume that the trailing vortex sheet is shed from the wing as a plane surface deflected downward at an angle determined by the velocity
induced at the start of the sheet. In view of the agreement between theory and experiment shown in Fig. 3-8, it would seem that the predictions of Figs. 3-9 and 3-10 are also valid.

Exact Solution of Elliptic Wing

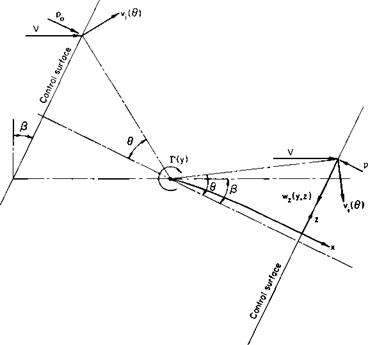
As stated earlier, it is possible to determine the exact forces on a wing with an elliptic Г-distribution. This is accomplished by applying the momen­tum theorem to control surfaces far ahead of and behind the wing. Consider

Aerodynamics of the wing

Fig. 3-11. Momentum through control surfaces ahead of and behind a wing section.

Fig. 3-11 which shows a section of the wing with a circulation Г(у) about it. The control surfaces are taken normal to the ultimate direction of the trail­ing vortex sheet. If z is the direction along the control surfaces in the plane of the section, у is in the direction of the span and x is perpendicular to у and z, then from the momentum theorem

J*J* ^cos ^ v‘ s’n cos ^ + ^z’

JJ (Po – P) dy dz

в is the angle shown in the figure, vt is the velocity induced by Г, wz is the z-component induced by the trailing vortex sheet. The velocity vt contributes nothing to the change in the momentum flux in the x-direction. Because of the choice in the direction of the control surfaces, the vortex sheet con­tributes nothing to the momentum flux in the x direction; p0 is the static pressure that exists on the forward control surface, whereas p is the static pressure that exists on the after control surface. The integration is performed over the after control surface from z = — oo to oo and у equal to the width of the section.

Aerodynamics of the wing

The expression for Fz can be expanded to give

From the symmetry of the problem

w,(z) = wz(-z),

Ф) = Vi(-Z),

0(z) = – d(-z),

so that the second and third integrals vanish when evaluated over z from – со to oo. From the definition of circulation the first integral is obviously equal to Г(у). Hence

тг

Подпись:pV Г(у) cos P dy.

J-b/2

The pressure p can be determined by applying Bernoulli’s equation.

Po + ip[(F cos P + vt sin в)2 + (V sin P + v, cos 0)2]

= P + ip[(F cos p + vt sin в)2 + (V sin P — vt cos в — wz)2 + w2];

wz and wy are the velocity components induced by the trailing vortex sheet on the after control surface.

Aerodynamics of the wing

From the above the force F, becomes

In the limit, as z -► oo, i-> 0 so that the second integral vanishes. As stated previously, the first integral is equal to Г, whereas the last integral is seen

Aerodynamics of the wing

to be equal to the kinetic energy per unit length of the flow associated with the trailing vortex system. Thus

Подпись: KE Подпись: dy dz.
Aerodynamics of the wing Aerodynamics of the wing Aerodynamics of the wing

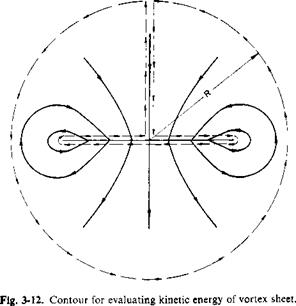
To evaluate the integral in the expression for Fx consider the flow in a plane transverse to the trailing vortex system, as shown in Fig. 3-12. In terms of a stream function, the kinetic energy (KE) per unit length, can be written

Aerodynamics of the wing Подпись: 8{^wy) dz Подпись: dy dz,

This can be rewritten as:

since

Подпись:/dwz dw

dy dz

The surface integral in the expression for the kinetic energy can be trans­formed to a contour integral by Stoke’s theorem. Thus

KE = У ф (фчі) • dR.

The above can be evaluated as the limit of the integral around the dashed contour in Fig. 3-12 as R -» oo. In the limit the contribution to the integral around the outer circle of radius R can be shown to vanish. In addition, ф = 0 along the vertical path so that KE reduces to

ГЬ/2

KE = p іj/wy dy,

J-bl 2

Aerodynamics of the wing Подпись: m dT pTl T Подпись: cos2 в d9 Подпись: рГ% n 8

where ф and wy are evaluated along the upper surface of the vortex sheet. Along this path ф = wzy, where wz is the downwash in the ultimate wake; wy is equal to one half the running strength of the vortex sheet. Thus for the elliptic distribution,

If the remainder of the expression for Fx and Fz is integrated from — bjl to b/2, the total Fx and Fz acting on the wing becomes

Fz = рУГ^ ~ cos P,

г т/г nb ■ а. рГол

– Fx = — рУГ0 — sin ^ H -—

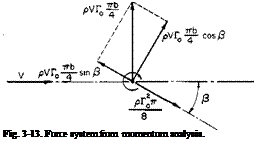
These forces result in the force system shown in Fig. 3-13. Thus the lift and drag become
Aerodynamics of the wing

D-^cosS.

Use of the fact that sin /5 = TJbV results finally in the following ex­pressions for CL and CD.

Подпись: G = C- =Aerodynamics of the wing(3-39)

(3-40)

Подпись: = 0.855AR.

The differences between the exact solution and the approximation already developed can be seen by comparing the above with (3-31) and (3-33). According to (3-39), the maximum value of CL is

(3-41)
Подпись: Fig. 3-13. Force system from momentum analysis.

Equation (3-41) is lower than (3-32) and, as seen in Fig. 3-8, it agrees closely with experimental data for small aspect ratios but does not agree so

well as (3-32) for the higher aspect ratios. The reasons might be attributed to viscous effects, as mentioned before, or possibly to the fact that the vortex sheet is unstable and rolls up into two discrete vortices.

Linearized Lifting Line Theory

In the usual linearized lifting line theory the deflection of the trailing vortex sheet is neglected. It is assumed that the local angles of attack of each section of the wing are reduced by an induced angle of attack, a„ given by

Aerodynamics of the wing(3-42)

Thus the section C, is given by C, = a0(a – a,);

Подпись: 2Г cV Aerodynamics of the wing

but C, is related to Г by Г = jcC, V so that

Again, using (3-28)

Aerodynamics of the wing(3-43)

Aerodynamics of the wing
The circulation distribution is now represented by a Fourier series in 0. Because of the symmetry, only sin пв terms are needed.

Aerodynamics of the wing
By selecting к values of 0O, knowing the corresponding values of a and c, we obtain к simultaneous equations for the unknowns Au A2, A3, Ak. The total lift of the wing can be obtained from

Compressibility Effects

The Mach number M is defined as the ratio of the free-stream velocity to the speed of sound in the undisturbed flow. When an airfoil is operated at M = 1 or higher, the pressure disturbances caused by the airfoil cannot
propagate forward and shock waves form ahead of the airfoil which radically change the pressure distribution around it. Even before an M of 1 is reached, however, weak oblique shock waves can form on the upper surface of the airfoil, for locally at that point the velocity is higher than the free-stream velocity. Just how high depends, of course, on the angle of attack. Hence the M at which the oblique shock waves are first generated also depends on a. The free-stream Mach number at which a local M of 1 is reached on the airfoil is referred to as the critical Mach number, Mcril. Generally, below the critical Mach number, the airfoil section characteristics are not affected appreciably; the possible exception is the slope of the lift curve which increases approximately as l/^/l — M2. Above Mcrit, however, the performance of the airfoil rapidly degenerates. C, max decreases sharply as the drag coefficient increases markedly. Both effects are attributable to

Compressibility Effects

M

Fig. 2-25. Effect of Mach number on

the phenomenon referred to as “shock stall,” which is a separation of the boundary layer on the upper surface resulting from the presence of the oblique shocks.

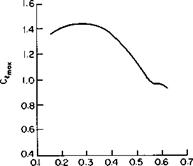
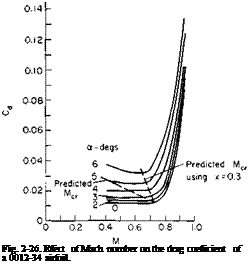
The severity of the “shock stall” effects is shown in Figs. 2-25 and 2-26, taken from Ref. 8. In Fig. 2-25, for the particular wing tested, it can be seen that C, max decreases from about 1.45 at low M values to 0.68 at an M of

0. 675. From Fig. 2-26 the section Cd for the 0012-34 airfoil is seen to rise rapidly for M values above approximately 0.7, depending on a. In addition, shock stall also shifts the center of pressure, the point of action of the lift force, rearward, thereby causing a significant decrease in the pitching moment.

Generally speaking, we try to avoid exceeding the critical Mach number in rotor and propeller applications for obvious reasons. Hence it becomes important to be able to estimate Mcrit. It is beyond the scope of this book to

Compressibility Effects Подпись: P ~ P о hpV1 Подпись: (2-41)

delve to any extent into the subject of compressible aerodynamics. For this the reader is referred to the many texts on the subject, such as Ref. 9. Briefly, however, the local velocity, by Bernoulli’s equation, determines the local pressure at each point on the airfoil’s surface. This pressure can be expressed in a dimensionless form as a pressure coefficient Cp.

Подпись: Fig. 2-26. Effect of Mach number on the drag coefficient of a 0012-34 airfoil.

where p is the local static pressure and p0 is the free-stream static pressure.

Compressibility Effects

At low Mach numbers, again using the incompressible Bernoulli equation, Cp is related to the local velocity v by

The highest v occurs where Cp is a minimum.

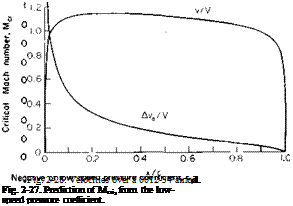
Now, with the isentropic flow relationship of gas dynamics and with some similarity considerations it is possible to relate the minimum value of Cp, Cpmln, obtained at a low Mach number, to the critical Mach number. This relationship is shown in Fig. 2-27. Hence, if we obtain CPm. n, either from subsonic wind-tunnel tests or by potential flow methods, an estimate of Mcrit can be obtained.

Tabulated functions for obtaining airfoil pressure distributions can be found in Refs. 8 and 10, These data are reproduced here for the 0012-34 airfoil in Fig. 2-28. In this figure v/V is the velocity distribution due to

thickness, whereas AvJV is that due to angle of attack. If the section were cambered, still another component, Av/V, would have to be considered, depending on the mean line shape. As tabulated, A vJV is for a C, of 1.0 and for any other C, must be multiplied by C(. Hence Cp is given by

Cp = 1 – (f ± ctI (2’43)

Подпись: In (2-43) the +

Compressibility Effects

sign refers to the upper surface.

For an example consider this airfoil at a = 3°. For this angle C, is about 0.3. Using this value of C, and Fig. 2-28, we find with (2-42) that Cpmin occurs at an x of 1.25% and has a value of —0.7. From Fig. 2-27 this value of CPmin results in a predicted critical Mach number of 0.64. In like manner Mcril has been predicted for angles up to 6° and the results superimposed on

Fig. 2-26. At low angles the predicted critical Mach is seen to be slightly less than the “drag divergence” Mach. However, at the higher angles of attack the predicted added effect of a is much greater than the experiment would indicate and is probably attributable to the extremely high values of AvJV predicted near the leading edge. More reasonable agreement is obtained if we calculate Cp at the 30% chord location for each a, which is the location for CPmin for a = 0. These calculations are also shown in Fig. 2-26.

Summary

The material presented in this chapter will find repeated application in the chapters that follow. The continuity, momentum, and energy theorems are all used to analyze the performance of a propeller and of propeller-wing combinations. The characteristics of two – and three-dimensional wings are determined by constructing systems of vortices. The action of the jet flap is explained by combining vortices and sources in a uniform flow to satisfy certain boundary conditions. Even the lift augmentation of the ground – effect machine can be explained by the use of the momentum theory. The analysis of thrust augmentation and cascade systems also depends on the application of the momentum theorem.

Problems

1. A straight-line vortex of strength у extends from the origin to infinity and lies along the x-axis. Find the velocity induced at the point (3, 4, 0).

2. A semiclosed body is formed by placing a source in a uniform flow. What is the relationship between the source strength Q, the uniform velocity V, and the asymptotic width W of the body? Assume two – dimensional flow.

3. By applying the momentum theorem to a circular control surface with a large radius (R -> – зо) enclosing any singular point in the (low (vortices or sources) necessary to construct a closed body with circulation, derive the Kutta-Joukowski law L = pVT and prove D’Alembert’s paradox.

4. A landing-gear strut is circular, with a 2-in. diameter, and 3 ft long. What is its drag at standard sea level (SSL)-conditions at 100 mph? How much drag would be saved by streamlining? How much horsepower does this represent?

5. How thick could a streamline strut be, yet have no more drag than a |-in. circular rod at 100 mph at SSL conditions?

6. An aircraft wing has a 100-ft span and a 16-ft chord. If we assume that the flow, for all intents and purposes, is entirely turbulent over its surface, what would its skin-friction drag be at 200 mph at SSL conditions? What would the drag be if laminar flow could be maintained over the entire surface?

7. Using the pressure coefficient 30% of the chord from the leading edge, predict Mcrit for the 0012-34 airfoil for an angle of attack of 5° and com­pare with Fig. 2-26.

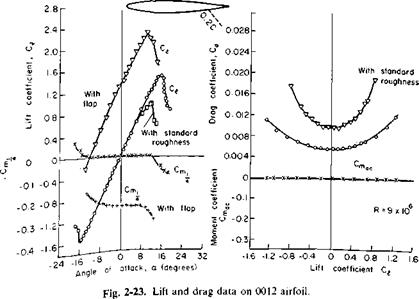
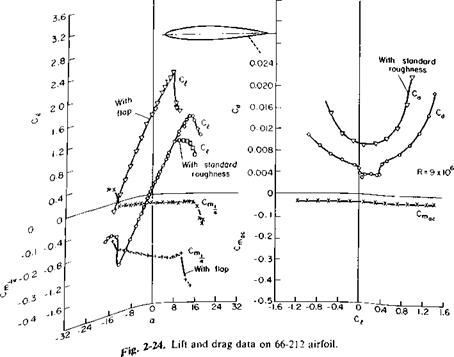
8. The center of pressure of an airfoil is defined as the point at which the lift is acting to produce the aerodynamic moment on the airfoil. Using Figs. 2-23 and 2-24, determine the Cp location for the 0012 and 66-212 airfoils at a C, of 1.0 (without flaps).

9. Given a fluid motion that rotates like a solid body, that is, the velocity is purely tangential and proportional to the radius

V = cor,

calculate ф and ф. Check your solutions by using them to calculate v.

Compressibility Effects

Scale Effects

The Reynolds number Re for flow about any body is defined as

Подпись: VlpRe =

Scale Effects

or

V is a reference velocity, usually the free-stream velocity and / is a character­istic length of the body. For an airfoil / is usually taken to be the chord, p, the fluid mass density, p, the dynamic viscosity, and v, the kinematic viscosity. By writing R as

p-

P(V/1)

it can be seen that, in a sense, R is the ratio of dynamic forces to viscous forces. Hence geometrically similar flows will have the same ratio or “scale” of these forces if R is the same for both flows.

Scale effects on airfoil characteristics are limited mainly to those dimensionless coefficients dependent on viscous action. Thus the slope of the lift curve, dC,/dot and Cmac are not affected appreciably by changes in R below the stalling angle of attack; C/max, on the other hand, is the result of the boundary layer separation off the upper surface. Because the boundary layer growth depends significantly on Re, C, max varies noticeably with Re. In general, C/max decreases with decreasing Re. A decrease in Re by a factor of 4, for example, can produce a decrease in CJmax of 20 or 30%, depending on the airfoil section.

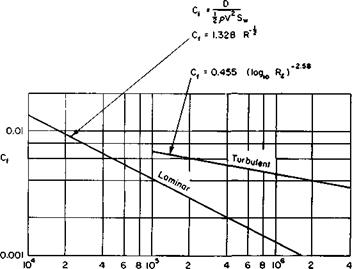
The drag coefficient also varies with Re, primarily because of the effect of changes in the boundary layer on the skin-friction drag. Normally the form drag does not vary too much with Re, and we can correct drag measurements for changes in R by calculating the changes in the skin – friction drag according to Fig. 2-20.

Drag Estimation

It has been said that the most valuable wind-tunnel test engineer is one who can predict the results before the tests are performed. This is sometimes true, because the configurations under test have already been designed and half completed. Irrespective of this point, it is important that the V/STOL aerodynamicist or the designer have an appreciation of the factors that influence the parasite drag and be capable of making reliable drag estimates.

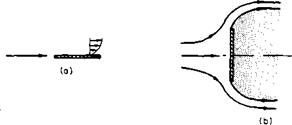
In order to estimate the drag of a body or to design a body for minimum drag, it is necessary to understand the origin and mechanism of the aero­dynamic drag produced by a body. D’Alembert’s paradox states that in an inviscid fluid a body can experience no drag. This can be proved relatively easily by use of the momentum theorem. Why then does a body experience drag in a real fluid? If we exclude the induced drag associated with the lift produced by a body, the parasite drag is composed of two parts, the skin friction drag and the form drag. These parts may be of equal magnitude or the one may completely overshadow the other, depending on the shape of the body. The skin friction drag is the result of the shearing stresses in the fluid as it passes over the surface of the body. The form drag results from the unbalance in normal pressure forces around the body due to the separa­tion of the flow. Perhaps, these statements can be clarified by referring to the drag of a flat plate at first aligned with the flow and then positioned normal to the flow, as in Fig. 2-13.

In Fig. 2-13a the drag is entirely the result of skin friction, whereas in Fig. 2-136 it is entirely form drag. If some means could be used to prevent

separation of the flow at the edges of the plate in Fig. 2-136, the drag could be reduced to zero.

The flat plate is rather an extreme with regard to both types of drag. To reflect further on the drag make-up, consider the typical body in Fig. 2-14.

Consider the fluid adjacent to the body as it flows aft from the nose. At the nose a laminar boundary layer starts to grow. The pressure is lower at

Drag Estimation

Fig. 2-13. Types of drag: (a) friction drag; (b) form drag.

2 than at 1, which is favorable to the flow, and the laminar boundary layer is maintained. Somewhere around 2 the flow passes through a minimum pressure peak. Thereafter the pressure gradient is an adverse one and the boundary layer thickens rapidly. At some point near 2, depending on the pressure distribution, body roughness, and Reynolds number, the boundary layer transists from a laminar to a turbulent boundary layer, called the transition point. The turbulent boundary layer continues to thicken until the flow is no longer able to remain attached to the body and separates.

Drag Estimation

Fig. 2-14. Boundary layer growth and separation on a body shape.

This is called the separation point. From there on, around the rear of the body, a turbulent wake exists in which the pressure acting on the surface is nearly constant and of a lower value than would have existed had the flow remained unseparated. This low pressure acting over the after portion of the body results in the form drag.

If the Reynolds number of the flow is sufficiently low, a laminar boundary layer will be maintained over a greater portion of the body and, in fact, can separate from the body before ever transisting to a turbulent layer. If this

Подпись: c
Подпись: D
Drag Estimation Drag Estimation

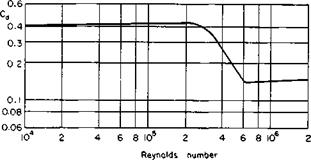
separation occurs, the separation point will be farther forward on the body, and the form drag will be correspondingly higher. The ability of the turbulent boundary layer to remain attached longer than a laminar layer is attributed to the turbulent eddies that bring into the boundary layer the higher-energy flow of the outer stream. There is a particular Reynolds number, referred to as the critical Reynolds number, for which the point of transition and point of laminar separation are coincident. Any increase in Reynolds number beyond this value will result in the transition of the laminar layer to a turbulent one before separating. The separation point will then shift farther back on the body and there will be an attendant decrease in the drag. For a rather blunt body, but with a definite degree of roundness, this effect is pronounced. The drag coefficient for this type of body as a

Fig. 2-15. Comparison between variation of drag coefficient with Reynolds number for rounded

and blunt bodies.

function of Reynolds number is given qualitatively in Fig. 2-15a. For a body with very sharp edges, which fix the point of separation regardless of the Reynolds number, the drag coefficient is nearly constant and independent of Reynolds number, as shown in Fig. 2-5b. A streamlined shape exhibits only a slight critical Reynolds effect or none at all if suitably streamlined. Since most of its drag will be caused by skin friction, the CD of a streamlined body will show a gradual decrease with increasing Reynolds number.

Attempts to predict quantitatively the drag of a given shape are, in general, not too successful. However, a qualitative understanding of the origin and nature of the drag is helpful to the aerodynamicist and designer.

Most airplane manufacturers, both helicopter and fixed-wing, have their own tests from which drag estimates for future designs can be made. In addition, considerable data have been compiled and published about the drag of aerodynamic shapes, including complete airplanes and the drag components. Reference 3 is an excellent source of information on drag and
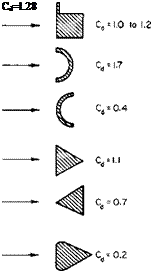
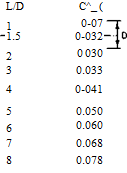
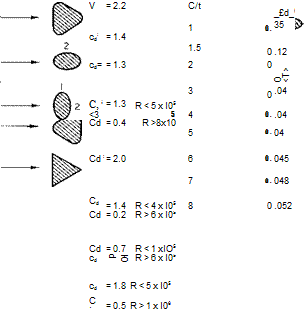
its estimation. In addition, Refs. 4 through 7 are recommended as sources of drag data for various shapes. No extensive presentation of drag data is given here. However, Figs. 2-16 through 2-20 present a limited amount of data taken from various sources with which preliminary drag estimates can be made.

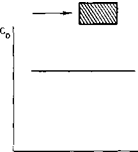
Drag Estimation Drag Estimation

For making preliminary estimates of the drag of an aircraft it is some­times convenient to base the drag on that of another aircraft with about the same degree of streamlining. The drag of the reference aircraft is then scaled

Fig. 2-16. Drag of various three-dimensional shapes (Cd based on projected frontal area).

according to its wetted area, in terms of which drag can be expressed as an average skin friction drag coefficient Cf :

D = jpV2SwCf.

Often the drag of an aircraft is also expressed in terms of so many square feet of equivalent flat plate area/ with a CD of 1.0:

D = pV2f

Hence

Drag Estimation Drag Estimation

Cd= 1.98

Fig. 2-17. Drag of various two-dimensional shapes (Cd based on projected frontal area).

Подпись:Подпись:Подпись: 6 8 10Подпись: 6 8 102.0

1.0

0.8

0.6

0.4

0.3

0.2

0.1

Reynolds number

Fig. 2-18. Drag of circular cylinders and Strouhal number.

For a typical light aircraft with fixed gear Cf is approximately 0.013. A well-streamlined World War II propeller-driven fighter had a Cf of about 0.004, whereas current turbojet aircraft have Cf values of approximately 0.003.

Drag Estimation

Fig. 2-19. Drag of sphere.

Drag Estimation

Fig. 2-20. Laminar and turbulent skin-friction drag of flat plates (based on wetted area).

Drag Estimation

Airfoil Families and Characteristics

The predecessor of the National Aeronautics and Space Administration (NASA) was the National Advisory Committee for Aeronautics. NACA, over a period of about 15 years in the 1930’s and 1940’s, developed and
tested families of airfoils beginning with the four – and five-digit series on through laminar flow and high-speed sections. To discuss completely all of these airfoil families would fill a book in itself, which indeed it has in Ref. 8. In this one source can be found a description of the geometry and experi­mental data on most of the NACA airfoils.

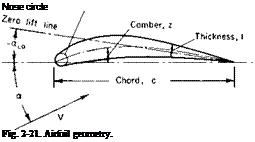
Подпись: Nose circle Fig. 2-21. Airfoil geometry.

Briefly, this section characterizes an airfoil and describes how the aero­dynamic forces and moments can be expected to vary with airfoil geometry and Reynolds and Mach numbers. A typical airfoil is shown in Fig. 2-21. Its thickness is the distance between the upper and lower surfaces, and the camber line is defined as lying halfway between them. The chord line is the straight line joining the end points of the camber line. The angle of attack of the airfoil is the angle between the free-stream velocity and the chord line. The zero lift line is an imaginary line passing through the trailing edge; if the airfoil is at an angle of attack a^, so that the zero lift line is parallel to the velocity vector, the lift of the airfoil is zero. This line can be approxi­

mated as passing through the trailing edge and the camber line at midchord. The nose circle is centered on the tangent to the camber line at the leading edge. Its radius depends on maximum thickness and airfoil family. Within a given family, airfoils are generated by combining different amounts of maximum thickness and camber. Different families are distinguished by different distributions of thickness and camber with distance along the chord. Earlier families of airfoils had their maximum thickness and camber points about one quarter or one third of the way back from the nose, whereas in later families these points are at about the midchord point.

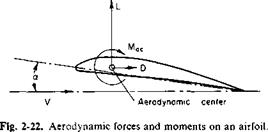
The aerodynamic forces and moment on an airfoil are shown in Fig. 2-22. It is convenient to consider that the lift and drag are acting at a point on the airfoil called the aerodynamic center with an aerodynamic moment Mac about this point. Observe that L and D are defined as perpendicular and parallel to V and that Mac is defined positively nose-upward. The aero­dynamic center is a point on the airfoil at which the moment remains constant, independent of a. In Chapter 3 this point is predicted to be at a

Drag Estimation Drag Estimation Подпись: (2-40)

quarter of the chord from the leading edge. Experimentally, the aero­dynamic center usually lies within 1 or 2% of this location; L, D, and Mac are normally presented in dimensionless forms as lift, drag, and moment coefficients.

Drag Estimation

C( increases linearly with a up to a maximum value, C, mai; Cd increases

approximately with the square of a up to C, max; Cm>c by definition of the aerodynamic center, remains constant.

Experimental data on a 0012 airfoil section with and without a split flap is presented in Fig. 2-23. The 0012 airfoil is a 12% thick, symmetrical airfoil (no camber) commonly used on helicopter rotors. Notice that the aero­dynamic center of this section is exactly at the quarter-chord point and that the Cmac is zero. Notice also the significant effect that surface roughness has on both C, and Cd , , the minimum value of Cd. The slope of the lift curve has a value of about 0.1 C,/deg, which is representative of most airfoils and a convenient number to remember.

For comparison purposes data on one of the “laminar flow” airfoils, 66-212, are presented in Fig. 2-24. Here the aerodynamic center is slightly behind the quarter-chord point. Because the airfoil is cambered, Cmac is not zero but has a negative value, which means that the nose tends to pitch downward. Also, because of the camber, the angle of zero lift is about —1.5°.

Notice the odd behavior of the drag curve for lift coefficient values be­tween 0 and 0.4. In this region, called the “drag bucket,” the drag is very low, because the chordwise pressure distribution over this limited range is conducive to maintaining a laminar boundary layer that results in reduced

Drag Estimation

Подпись: Moment coefficient

Drag EstimationDrag Estimation

skin-friction drag. Unfortunately, in practice the slightest roughness that might be caused by bugs or imperfections in the contour is enough to trip the boundary layer and produce the usual turbulent skin-friction drag.

Vortex Filaments and the Biot-Savart Law

In the preceding section on vortices the velocity distribution was obtained in two-dimensions by imposing the condition of irrotationality on purely tangential flow. This led to the concept of the point vortex in which the flow is irrotational everywhere except at a singular point that defines the center of the vortex. The closed line integral (f> V-гЖ is zero for any contour not enclosing the singularity. If the singularity is enclosed by the contour, the integral has a value Г different from zero defined as the strength of the vortex.

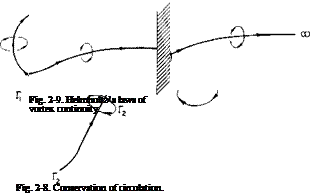
This concept can be extended to three-dimensions by imagining a line that is the locus of singular points of constant strength such that the closed line integral cfV’t/R evaluated around any contour enclosing the line is equal to the strength Г and vanishes for any closed contour not enclosing the line. Such a line, referred to as a vortex filament, is illustrated in Fig. 2-8, in which two vortex filaments of strengths Г, and Г2 are shown. This figure also illustrates the fact that if the contour encloses two or more vortex filaments the value of the closed-line integral of the velocity will equal the sum of the strengths of the vortex filaments interior to the contour.

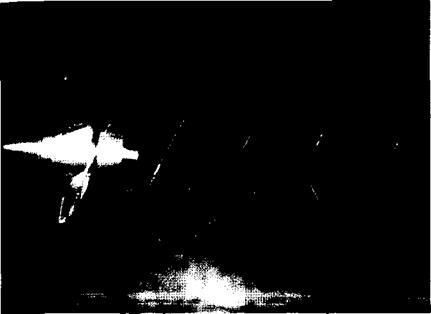
An important theorem of vortex behavior, attributed to Helmholtz and illustrated in Fig. 2-9, states that a vortex cannot terminate in a fluid but must either close on itself, extend to infinity, or terminate at a solid boundary. The first possibility is aptly illustrated by the familiar smoke ring. Figure 2-10 illustrates vortex filaments trailing from the blade tips of a marine propeller and extending for a considerable distance downstream. In this example the center of the vortex filaments is made visible by the occurrence of cavitation in the region of reduced static pressure.

Another important behavior to keep in mind with regard to vortex filaments is the fact that they must lie along streamlines. This follows from Eq. (2-13) which shows that in the absence of nonconservative forces the rotation of fluid particles (which travel along streamlines) remains constant. Hence fluid particles that compose the rotational motion at the singular
points along the vortex filament remain in rotation as they travel through the flow field.

Vortex Filaments and the Biot-Savart Law

Associated with a vortex filament is a velocity field, commonly referred

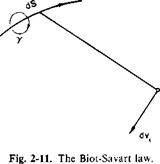
to as the induced velocity, which can be calculated by means of the Biot – Savart law. The derivation of this law [1] is beyond the scope of this book but is stated in vector differential form as

Подпись:^ _ У r X

Vortex Filaments and the Biot-Savart Law

Fig. 2-10. Tip-vortex cavitation produced by a marine propeller. (Garfield Thomas Water Tunnel, The Pennsylvania State University)

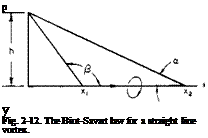
Refer now to Fig. 2-11: <7v, is the differential velocity induced at point P by the directed differential length of vortex dS, у is the circulation around the element dS and is directed in accordance with the right-hand rule of rotation; r is the vector from P to the elemental length dS. This is felt to be the most useful form of the Biot-Savart law, special cases of which can be found in the literature. Consider, for example, Fig. 2-12. Here a straight-line vortex filament lies along the x-axis and extends from x1 to x2. (At these points the vortex may take a 90° turn or it may be that we are interested only in the contribution made by the part lying between xt and x2 of an infinitely long vortex. At any rate the vortex cannot terminate at xi or x2.) Consider the velocity induced by this vortex line at the point 0, y. For this situation the equation of the vortex line is R = ix, so that

dS = c/R = і dx

and

ІУ + r = R

a, /і, and h are shown in Fig. 2-12.

Observe that if a and /? = 0, as they do when the line extends from — go to + oo, Eq. (2-39) reduces to (2-30), the velocity induced by a point vortex in two-dimensional flow.

Vortex Filaments and the Biot-Savart Law

Sometimes it is extremely difficult to evaluate Eq. (2-39) for a given vortex system. In this case we can resort to numerical integration on a digital

computer or to the use of a direct analog computer described in Ref. 2. Here use is made of the fact that the magnetic field around a current – carrying wire is determined by an equation of exactly the same form as (2-39).

Although the methods of potential flow are very useful and powerful, often we cannot apply them because of what is termed “real fluid effects.” On some of these occasions compressibility or viscous effects can be ac­counted for by properly modifying Euler’s equation to include viscous shearing forces and the variation of the density with pressure. However, to

Подпись: p у Fig. 2-12. The Biot-Savart law for a straight line vortex.

solve the more exact nonlinear differential equations for all but the simplest of boundary conditions is extremely difficult. Hence much of aerodynamics is, of necessity, based on experimental data.

Construction of Flow Fields by the Superposition of Elementary Flow Functions

The sum of harmonic functions is itself a harmonic function. Thus, if we construct a flow field defined by a velocity potential ф^х, у, z) and another defined by ф2(х, у, z), these functions can be added to produce still another field. In general, if фи ф2,…,фп satisfy Laplace’s equation, then

V2c/> = 0,

where

Ф = І. Фг

1

The velocity of the new field thus constructed is given by

V = grad ф = grad £ ф„ (2-24)

1

Hence the velocities of the fields defined by фи ф2,…,фк add vectorially to produce the velocity defined by ф.

There are three elementary flow functions commonly used as “building blocks” for more complicated patterns. These functions are associated with purely rectilinear flow, purely tangential flow, and purely radial flow.

Rectilinear Flow

Consider the case in which the velocity vector is a constant given by V. If ф is taken to be zero at the origin, then

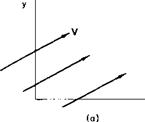
Подпись: (2-25)ф(х, у) = I V-fifR = их + vy;

и and v, of course, are the constant x – and у-components of V.

Similarly, the stream function is defined as zero at the origin. Since it was shown earlier that <Ц/ = —vdx + udy and и and v are constant, it follows immediately that

ф = uy — vx. (2-26)

Vortex

Construction of Flow Fields by the Superposition of Elementary Flow Functions Подпись: 1 dur ~r ~дв' Подпись: (2-27)

In polar coordinates r and в the curl of the velocity vector can be written as

щ and ur are the tangential and radial velocity components, respectively. For irrotational motion Eq. (2-27) must be equal to zero. If, in addition, the radial component of velocity ur is zero and ue is not a function of в, (2-27) becomes

dut _ dr r

Integrated, this equation becomes

uer = constant. (2-28)

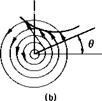
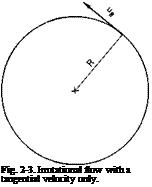
Подпись: Fig. 2-3. Irrotational flow with a tangential velocity only.

Because the curl V is zero, the closed line integral of V*</R vanishes around every contour in the field with the exception of any contour enclosing the origin. At this singularity the velocity is infinite. Consider the evaluation of this line integral on a circle of constant radius R centered at the origin,

as shown in Fig. 2-3. If the value of this closed line integral is denoted by Г, then obviously

Подпись: (2-29)Г = 2nRue.

Подпись: u. Подпись: Г 2nr Подпись: (2-30)

This equation is of the same form as (2-28) and, by comparison, the constant in (2-28) is taken to be T/2n. Hence for irrotational flow, with only a tangential component independent of angular position, the velocity is given as a function of the radius:

This type of flow is referred to as a point vortex; Г is the strength of the vortex and equal to the closed-line integral of the velocity about any contour enclosing the center of the vortex.

Подпись: Fig. 2-4. Sign convention for velocity components.

Although ф and ф for a vortex can be obtained by application of vector

analysis, possibly it is clearer to think of the change in ф and ф between two points A and В as being obtained from the line integrals
Подпись: -Lв

Подпись: ф(В) - ф(А)Подпись: (2-31) (2-32) vs dS,

I

ф(В) – ф(А) =j„dS;

vs and v„, in Fig. 2-4, are the velocity components directed along and normal to dS, respectively; v„ is shown in the positive sense, as previously discussed.

Подпись: № - ф(А) Construction of Flow Fields by the Superposition of Elementary Flow Functions

Consider (2-31) as applied to a vortex. This integral evaluated along a radial line from the origin is zero because и,, the velocity along the path of integration, is zero. Hence ф for a vortex is a function only of 6. If r is held constant, then (2-31) becomes

= — [0(B) – в(А)].

If 6(A) is taken to be zero and 6(B) is any general angular position, the velocity potential for a vortex can be written

Thus the equipotential lines are rays emanating from the center of the vortex.

Подпись: № - ф(А) = Construction of Flow Fields by the Superposition of Elementary Flow Functions

In a similar manner it can be seen that when evaluated along a constant radius the integral of (2-32) is zero because the velocity normal to the arc is zero. Hence іjj can be obtained immediately by integrating along a radius. If A and В lie on the same radius, then

= _л, пш

In R{A)

Подпись: Ф Подпись: (2-34)
Construction of Flow Fields by the Superposition of Elementary Flow Functions

If ф(А) is arbitrarily taken to be zero and R(A) is denoted by a, then for any general radius r

The signs of (2-33) and (2-34) are dictated by the choice of positive coordinate directions.

Source

A source flow is the counterpart of a vortex. The flow is irrotational but has only a radial component of velocity. This component is assumed to be independent of 0 so that, from (2-27), the curl V is obviously zero.

Подпись: div V Подпись: 1 due 8ur ur r 80 dr r Подпись: (2-35)

In polar coordinates the divergence of the velocity vector can be written

For the source, since щ = 0, (2-34), in order to satisfy continuity, becomes

dur ur

dr r

or

urr = constant.

Thus in the case of the source the radial velocity is of the same form as the tangential velocity for the vortex. The strength of the source Q is defined as the line integral (2-32) enclosed around the origin. For a source it therefore follows that

Подпись: (2-36)” 2nr

The source strength Q is equal to the flux of fluid passing through any
circle of radius r enclosing the origin, hence can be regarded as the flux emanating from the singularity at the origin.

Application of (2-31) and (2-32) results in the following stream function and velocity potential for the source.

Construction of Flow Fields by the Superposition of Elementary Flow Functions(2-37)

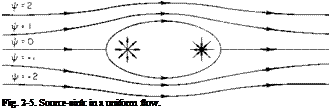
Подпись: Fig. 2-5. Source-sink in a uniform flow.

It is possible, by combining the uniform rectilinear flow with sources and vortices, to produce flows of varying geometries; for example, by placing a

Construction of Flow Fields by the Superposition of Elementary Flow Functions

source and a sink (a source of negative strength) in line with a uniform flow we obtain the streamline pattern shown in Fig. 2-5. Because the conditions that define a streamline are the same as the boundary conditions that must be satisfied at a solid boundary, it follows that any streamline can be

Fig. 2-6. Formulation of closed body or flow over a mound.

replaced by a solid boundary without altering the streamline pattern outside the boundary. Thus the flow of Fig. 2-5 can be made to represent the flow around the two-dimensional body defined by the ф = 0 line, or it might represent flow over a gentle mound represented by the ф = 1.0 line. These conditions are illustrated in Fig. 2-6.

The three elementary flow functions are summarized in Fig. 2-7.

Construction of Flow Fields by the Superposition of Elementary Flow Functions

Fig. 2-7. Elementary flow functions: (a) uniform rectilinear flow: v = constant, ф = их + try,
ф =uy — vx; (b) vortex; ue = T/2nr, itr = (),ф = Гв/2п, ф = — (Г/2гг) In г; (с) source: щ = О,
ur = Q 2nr, ф = (Q/2n) In г, ф = Q0/2n.

Energy Theorem

The energy theorem relates work and heat transfer to the flux of energy, both kinetic and thermal, through a control volume in a manner similar to the relation between the force and flux of momentum expressed in the momentum theorem. It is an adaptation of the first law of thermodynamics to fluid mechanics and follows directly from the first law.

Подпись: kn-VTdS + Подпись: v V dS + Подпись: pe dz + V * s Подпись: pe(V-n) dS. Подпись: (2-7)
Energy Theorem

If a system is defined as the fluid contained within a fixed control surface S, the rate at which heat is transferred into the system plus the rate at which work is performed on the system must equal the sum of the net flux of energy out of the system and the instantaneous rate of change of energy of the fluid particles contained within S.

In the first integral of Eq. (2-7), which represents the rate at which heat is transferred into the system, к is the coefficient of thermal conductivity. The second integral represents the rate at which surface stresses т work on the system; W is the power added to the system.

Energy Theorem

For the particular case in which viscous shearing stresses can be neglected the pressure forces are normal to the control surface so that the second integral on the left side of (2-7) becomes

jj [pe + /?)(V*n) — kn-VT] dS.

Energy Theorem Подпись: (2-8)

In addition, if the flow is steady, the first integral on the right side of (2-7) vanishes and (2-7) reduces to

The specific energy e is given as the sum of the intrinsic thermal energy and the kinetic energy

Energy Theorem(2-9)

Подпись: W Energy Theorem Подпись: (2-Ю)

Cv is the specific heat at constant volume. By substituting (2-9) and the equation of state p = pRT into (2-8) and recalling that Cp = R + Cv, we find that Eq. (2-9) becomes

The universal gas constant is R and Cp is the specific heat at constant pressure. Equation (2-8) is the energy theorem for the steady flow of an inviscid fluid that obeys the perfect gas laws. In words, it can be stated that the power added to a system must equal the net rate of flow of enthalpy (pCpT), kinetic energy (p|V|2/2), and heat out of the system.

The application of the momentum and energy theorems to the aero­dynamics of V/STOL aircraft will become apparent as the material in later chapters is developed.

Euler’s Equations of Motion

Подпись: pn dS = Energy Theorem Подпись: pY dx.

In the absence of body forces the momentum theorem for an inviscid fluid assumes the form

Energy Theorem Energy Theorem Подпись: pY dx.

Application of Gauss’s theorem to this equation leads to

Because the volume is arbitrary, it follows that the integrand must satisfy the equation identically. By using the condition for conservation of mass expressed by Eq. (2-1) we obtain

(£ + v’,p)v -(2‘U)

The differential operator in parentheses is referred to as the substantial derivative with respect to time; it represents the rate of change as a particle moves along a streamline.

s. „ a>

To prove that this is so, consider the x-component of velocity u. In general, и is a function of x, y, z, and t so that

, , du, du, du,

du = — dt + — «X + — dy + – г – dz

dt dx dy dz

du <3m (3 m dx du dy du dz

dt dt dx dt dy dt dz dt

Because m = dx/dt, v = dy/dt, and и’ = dz/dt, it follows that

Подпись:Подпись: иПодпись: + VVПодпись: M.du

dt

‘d_

Jt

The first term in parentheses is referred to as the local acceleration. It is the rate of change of the м-velocity because of a temporal change in the flow field. The second term (V-V)m is the convective acceleration of the fluid particle caused by its changing position in the flow field.

In rectangular coordinates Eq. (2-11) is written

Подпись:du du du du

— – 1-М — h » ,– h VT — =

dt dx dy dz

dv dv dv dv

—– b M— h c-—b VI’ — =

dt dx dy dz

dw dw dw dw ~dt+Ute+V^+WTz =

Equation (2-11) is the partial differential equation governing the flow of

an inviscid flow.

The vorticity vector eo is equal to the curl of the velocity vector:

Подпись: (2-12)to = V x v.

The behaviour of this vector quantity in an inviscid, incompressible flow can be found by taking the curl of both sides of Eq. (2-11);

dto 1

— + (V-V)© = —V X Vp.

dt p

The curl of the gradient of a scalar is identically zero. Thus

Energy Theorem(2-13)

Energy Theorem

The substantial derivative of the vorticity vector со is equal to zero. Hence, as a function of (x, y, z, t), со must be a constant. For the specific case of a steady flow, uniform at some location in the field (usually infinitely far removed from the body), this constant must be zero. Hence everywhere in the flow field
со = 0. (2-14)

It must be remembered that the above holds only for a steady, inviscid, incompressible flow.

Velocity Potential

From the foregoing we have two conditions on the velocity vector of an incompressible inviscid flow:

curl V = 0, (2-15)

div V = 0. (2-16)

Now, by expressing the velocity vector as the gradient of a scalar function ф we find that (2-15) is identically satisfied. The scalar function ф is referred to as the velocity potential. Equation (2-16) leads to the condition that ф must be harmonic.

Thus, if

V = V</>, (2-17)

then from continuity considerations it must hold that

V20 = 0. (2-18)

A flow for which a velocity potential ф can be defined is known as a potential flow.

Stream Function

The stream function ф is defined only for two-dimensional or axi – symmetric flow. For two-dimensional, incompressible flow ф is defined as

dф = ^ndS; (2-19)

n is the unit vector normal to the differential arc length dS and is directed to the right as one faces in the direction of increasing dS. To investigate the ^-function further consider Eq. (2-19) in rectangular coordinates.

dS = |<Ж|,

. dy. dx

Подпись: Hence

V = in + jn, dip — — vdx + udy.

In addition, because ф is a function of x and y,

дф дф

dф = – т— dx + dy. Y dx dy y

Energy Theorem Подпись: (2-20)

A comparison of these two expressions for dф produces the following relationships between ф and the velocity components:

It can be seen that to obtain the velocity component in a given direction the partial derivative of ф is taken in the direction normal to that of the velocity component and to the left as one looks in the direction of the velocity.

If we express the velocity in terms of ф, we find that the continuity con­dition (2-16) is identically satisfied. In order for curl V to equal 0, the following must hold:

Подпись: (2-21)VV = o.

Thus, to summarize, the velocity potential ф can be defined only if the flow is irrotational, that is, curl V = 0, and must be harmonic to satisfy continuity. The stream function satisfies continuity considerations and must be harmonic if the flow is to be irrotational.

A streamline is an imaginary line that defines the direction of flow so that at any point along the line the velocity is tangent to the line. Thus, if dy/dx is the slope of the line, it follows that

Подпись:v _ dy и dx ’

dф was given earlier as dp = —vdx + u dy.

When the kinematic relationship along the streamline is substituted in the above, dф = 0 is the result. Thus lines of constant ф define the streamline pattern for a given flow field.

Equipotential lines are lines of constant ф. If ф is constant, it follows that

Подпись: дф dx Подпись:Подпись: (2-23)дф

dx + — dy dy

or

dy и

dx v

In a comparison of the slope of equipotential lines, as given by (2-23), with the slope of the streamlines defined by (2-23), it is apparent that the equi­potential lines are everywhere normal to the streamlines or lines of constant ф.

Theoretical and applied aerodynamics

The purpose of this chapter is to provide the basic aerodynamics necessary to an understanding of the material developed in the following chapters. To begin, three fundamental relationships of fluid mechanics are considered: the equation for conservation of mass and the momentum and energy theorems.

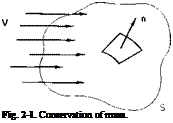
Conservation of Mass

Подпись: Fig. 2-1. Conservation of mass.

Consider a fixed control surface S shown in Fig. 2-1 through which fluid is passing. The rate at which mass accumulates within the volume contained

Theoretical and applied aerodynamics

within S is equal to the rate at which mass flows into the volume minus the rate at which it flows out. To put it another way, the net mass rate of flow out of S must equal the negative of the rate at which mass accumulates within the volume. Hence, if n is the unit normal directed outward from S, then
V is the volume enclosed by S and dx is a differential element of volume. If we use Gauss’s divergence theorem and the fact that V is fixed, we obtain

dx = 0.

Because the volume V is arbitrary, the integrand must equal zero; hence the differential equation which the mass density and velocity vector must obey in order to conserve mass at every point in a flow becomes

Подпись: (2-1)V-(p V) + ^ = o.

For steady incompressible flow this result leads to the condition that the divergence of the velocity vector must equal zero

V-V = 0. (2-2)

In rectangular coordinates this is expressed as

du 8v dw dx + dy + 8z

u, v, and w are the components of the velocity vector in the x-, y-, and z-directions, respectively.

Momentum Theorem

Theoretical and applied aerodynamics

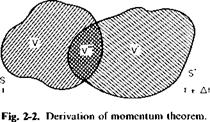
Consider the aggregate of fluid particles contained within a control surface S at time t, as shown in Fig. 2-2. At time / + At these particles have

J p (t + At) dx — J* p V(t) Jtj;

Подпись: lim — At
Подпись: Ar-»0
Подпись: (2-3)

moved to a new position and are now enclosed by the surface S’; V is the volume enclosed by S, V, by S’, and V" is the volume common to both V and V. The rate of change of momentum of the fluid particles under con­sideration is obviously

im0 h {J*+ Лг) ~ V(^dx

V"

Theoretical and applied aerodynamics

The first term in the first limit represents the momentum that has passed out of the volume V in time At; the second term represents the amount that has entered V during the interval Аг. Hence the difference between the two in the limit, as Аг -*■ 0, is the time rate at which momentum passes out of the surface S, sometimes stated as the net flux of momentum out of the surface. If n is the unit normal directed positively out from the surface S, the first limit can be written
|| pV(-n)dS.

s

The second limit represents the rate of change of momentum of the fluid particles contained in the volume V (or V" in the limit). In the limit, as Аг -* 0, this term becomes (5/51) JJJ pV dx.

v

Theoretical and applied aerodynamics Подпись: (2-4)

Thus, if F is the total vector sum of all the forces acting on the fluid particles in V, it follows from Newton’s second law of motion that
Of most concern to the material in this book is the problem of the steady flow of an inviscid fluid—in particular, air. Thus for the particular case in which gravity forces, viscous shearing forces, and unsteady effects can be neglected Eq. (2-4) takes the form

-|| pn dS + В = || pV(V-n) dS. (2-5)

s s

In Eq. (2-5) p is the normal pressure acting on the control surface and В represents any body forces that are present within the control surface.

Подпись: Q = Подпись: p(V x r)(V-n) dS + I Подпись: p(V x r) dx. Подпись: (2-6)

An equation can also be formulated for the angular momentum in a manner similar to that used for the linear momentum. The result, similar to (2-2), states

Here Q is the vector sum of any torques acting on the fluid particles within the control surface.

The results expressed by Eqs. (2-4) and (2-6) can be stated simply: The sum of external forces (or moments) acting on a control surface and internal forces (or moments) acting on the fluid within the control surface produces a change in the flux of (angular) momentum through the surface and an instantaneous rate of change of (angular) momentum of the fluid particles within the control surface.

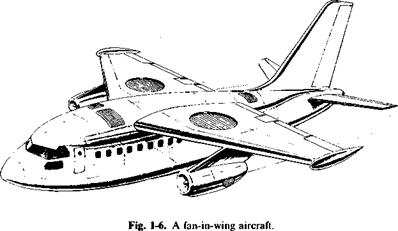
Submerged Fans. Fan-in-Wing

In this configuration a large fan is submerged horizontally in the wing. In hovering the wing acts as a duct around the fan to improve its static thrust performance. In forward flight at low speeds the action of the fan is beneficial to the wing. An example of an aircraft incorporating this method of obtaining VTOL performances is illustrated in Fig. 1-6.

Submerged Fans. Fan-in-Wing

Direct Thrust

In this scheme separate jet engines are nested in the wing or fuselage to provide vertical thrust. Although the flow over the wing is affected to some extent by the engines, the effect is limited so that the characteristics of this type of VTOL or STOL aircraft can be approximated by determining the behavior of the wing and engines separately.

Aerodynes, Ducted Fans, and Highly Loaded Rotors without Fixed Lifting Surfaces

These types of STOL or VTOL aircraft employ highly loaded rotors to provide the lift and thrust for forward flight. Control is accomplished either by tilting the axis of the rotor or by deflecting its slipstream with a system of vanes submerged in the rotor slipstream. Vehicles of this type include the “flying jeep” and the “aerodyne” [6].

Thrust Augmentation

Somewhat similar to the jet pump, this configuration uses the primary flow from jets to induce a secondary flow. The static thrust available from a jet engine is therefore increased significantly by the entrained flow.
Tо summarize, many schemes have been proposed and are being studied for accomplishing STOL and VTOL aircraft.

1. Compound aircraft

2. Tail-sitters

3. Tilt-wing

4. Tilting-jets, ducted propellers or rotors

5. Deflected slipstream

6. Deflected jet

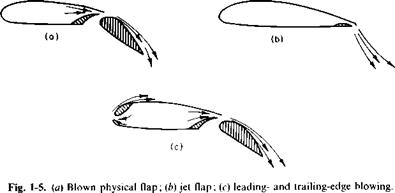
7. External flow, jet-augmented flaps

8. Boundary layer control

9. Circulation control

10. Submerged fans

11. Direct thrust

12. Aerodynes, ducted fans, and highly loaded rotors without fixed lifting surfaces

13. Thrust augmentation

These categories tend to overlap somewhat in their definitions. It is also possible that a V/STOL aircraft might incorporate several of these schemes to develop lift at low forward speed. For a more detailed description of many of these types of V/STOL aircraft, the reader is referred to Ref. 12.

Problems

1. An aircraft has a wing loading of 60 psf. If the approach speed is to be at least 20% higher than its stalling speed, what must the maximum lift coefficient be in order to land in 500 ft over a 50-ft obstacle as a matter of routine? Assume standard sea-level conditions.

2. An aircraft has propellers that can rotate to tilt the thrust vector upward. If we assume a constant thrust T and neglect the aircraft drag and ground-roll friction, would the shortest ground-roll distance to accelerate the aircraft to the stalling speed be obtained by keeping the thrust vector down so that the acceleration is a maximum or to tilt the thrust up through some angle в so that the required wing lift is diminished by the vertical component of the thrust?

Deflected Jet

The deflected jet principle is similar to the deflected slipstream, except that the turning is done internally. In hovering flight the exhaust from the turbojet engine, normally expelled in the aft direction, is diverted by a system of vanes to produce a vertical component of thrust.

External Flow, Jet-Augmented Flaps

The question might be asked, “When does a deflected slipstream or jet become an external flow, jet-augmented flap?” This is a little difficult to answer. However, in a deflected slipstream most of the lift is derived from redirecting the jet momentum, whereas in the externally augmented flaps increased lift is produced by the wing by means of circulation and boundary layer controls afforded by blowing over the flap.

Boundary Layer Control (blc)

There are several methods of boundary layer control, each of which has the same purpose of preventing boundary layer separation. One method controls the boundary layer by sucking off the slower-moving air either by a relatively uniform distribution of holes [3] or in a series of slots running spanwise along the airfoil [4].

Another method [5] feeds higher-energy air into the boundary layer by blowing air tangentially to the upper surface of a deflected flap. This scheme is sometimes referred to as a blown flap. It is also possible to accomplish BLC by means of a jet flap, which is simply a sheet of air blown downward from the trailing edge of an airfoil. Its effect on the airfoil is similar to that of the usual flap. In addition to blowing on trailing edge flaps, it is also possible to blow on leading edge flaps to prevent leading edge separation. These schemes are shown in Fig. 1-5.

Deflected Jet

Circulation Control

If the amount of air of a blown or jet flap is increased beyond the value required to prevent boundary layer separation, additional circulation is produced around the airfoil. This increased circulation will produce a lift in excess of that predicted from potential flow or jet reaction.