Category AN INTRODUCTION TO FLAPPING WING AERODYNAMICS

A Scaling Parameter for Force Generation for Flexible Wings

The maximum propulsive force, such as thrust in forward flight or lift in hovering motion, was generated at a frequency that was slightly lower than the natural fre­quency of the system [222, 367, 453, 454, 494, 508] as shown in Section 4.4.2. Zhang, Liu, and Lu [222] using the lattice Boltzmann method, numerically studied a flexible flat plate modeled as a rigid plate with a torsional spring at the pivot point on the leading edge of the wing. They concluded that the flat plate would move forward and hence generate thrust when the leading edge plunges at a motion frequency that is lower than the natural frequency of the system; the flat plate would move backward if the frequency ratio, the ratio between the motion frequency and the natural frequency, is greater than one. Similarly, Masoud and Alexeev [508] used the lattice Boltzmann method to show that the maximal propulsive force is obtained at the frequency ratio of 0.95. The magnitude of the maximal force would increase when the inertial effects became more important than the fluid inertia. Michelin and Llewellyn Smith [494] used potential flow theory to describe the flow over a plunging flexible wing. They showed that the trailing-edge flapping amplitude and the propul­sive force are maximal at resonance conditions. In a series of experiments using a self-propelled simplified insect model, Thiria and Godoy-Diana [453] and Ramana – narivo, Godoy-Diana, and Thiria [454] also showed that the maximum thrust force os around a frequency ratio of 0.7. More recently, Gogulapati and Friedmann [367] coupled an approximate aerodynamic model, which was extended to forward flight including the effects of fluid viscosity, to a non-linear structural dynamic model. For various setups of composite anisotropic Zimmerman wings [507], they investigated the propulsive force generation in forward flight. They found that the maximum propulsive force is also obtained at a frequency ratio slightly lower than one. These observations are consistent with the general perception of the resonance phenom­ena, in which even small external forces can induce large-amplitude deformations and potentially be efficient as well.

However, it has been reported for insects that the flapping frequency is below the natural frequencies of the wing and is only a fraction of the resonance frequency [509, 510] . Sunada, Zeng, and Kawachi [509] measured the natural frequencies of vibration in air and the wing-beat frequencies for four different dragonflies. The wing-beat frequency ratios were in the range of 0.30-0.46. Chen, Chen, and Chou [510] also measured the wing-beat frequencies and natural frequencies of dragonfly wings. In their measurements the average flapping frequency was 27 Hz, whereas the natural frequency, calculated using a spectrum analyzer, was 170 Hz when clamped at the wing base, resulting in a frequency ratio of about 0.16.

The propulsive efficiency was also investigated numerically [492,508] and exper­imentally using a self-propelled model [453] [455]. Vanella et al. [492] conducted numerical investigations on a two-link model and found that the optimal perfor­mance is realized when the wing is excited at a frequency ratio of 0.33. For all Reynolds numbers considered in the range of 7.5 x 101-1 x 10³, the wake-capture mechanism is enhanced due to a stronger flow around the wing at stroke reversal, resulting from a stronger vortex at the trailing edge. Using the experimental setup described earlier, Thiria and Godoy-Diana [453] and Ramananarivo, Godoy-Diana, and Thiria [454] also showed that the maximum efficiency is obtained at a frequency ratio of 0.7, lower than that of the maximum propulsion. They concluded that the performance optimization is obtained not by looking at the resonance but by adjust­ing the temporal evolution of the wing shape. In contrast, Masoud and Alexeev [508] showed that the optimal efficiency for a hovering flat plate at Re = 100 occurs when the motion is excited at a frequency ratio of 1.25. In their setup a flexible flat plate had a geometric AoA of 40° in contrast to the previously mentioned studies where the plunging motion was symmetric.

Isotropic Wing

When the properties of a material are the same in all directions, the material is called isotropic. Aono et al. [506] reported on a combined computational and experimental study of a well-characterized flapping wing structure. An aluminum wing was pre­scribed with single degree-of-freedom flapping at 10 Hz and ±21° amplitude. Flow velocities and deformation were measured using digital image correlation and digital PIV techniques, respectively. In the most flexible flapping wing case, the elastic twist­ing of the wing produces substantially larger mean and instantaneous thrust due to shape-deformation-induced changes in effective AoA. Relevant fluid physics were documented including the counter-rotating vortices at the leading and the trailing edge, which interact with the tip vortex during the wing motion.

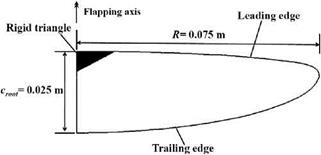
In this section we focus on a 3D hovering flapping isotropic wing in air. The wing is a flat plate wing of cm = 0.0196 m and AR = 3.825, with a thickness ratio of h* = 2.0 x 10⁻² having a Zimmerman planform (see Fig. 4.37, hovering in air at

Figure 4.37. Geometry of the Zimmerman planform.


Re = 1.5 x 10³. A sinusoidal flapping motion is introduced at the rigid triangle at the leading edge at the wing root following Eq. (3-15) with St = 0.25 and к = 0.56. The flapping axis is parallel to the wing root. Note that in the axes definition by Wu et al. [507] the wing flaps up and down to generate thrust due to wing flexibility; however, in the study considered here, the flapping wing axis has been rotated so that the flapping axis is parallel to the lift direction, such that any flexibility in the wing leads to lift generation. The triangular rigid region near the root at the leading edge undergoes prescribed motion and is constrained in all degrees of freedom in the structural solver, since the flapping mechanism in the experiment [506] is actuated at this region on the wing.

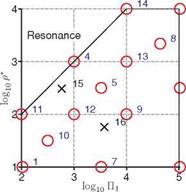
To assess the effects of wing properties – the effective stiffness П and the density ratio p* – on the resulting lift and wing deformations, surrogate models are constructed to qualitatively explore their implications. The range for these variables in the design space is chosen to cover a wide range of applications, as shown in Figure 4.38. To effectively assess the order of magnitude of the design variables, a logarithmic scaled design space is populated.

The objective functions are (i) the lift coefficient averaged over one motion cycle between the second and the third cycle and (ii) the twist angle в given as

в = max{acos(c3 ■ el)}, (4-28)

where c3 is the unit vector in the direction from the leading edge to the trailing edge at near the mid-span of the wing and et is the unit vector in the lift direction.

Подпись: 3Подпись:Figure 4.38. Design of experiment in logarithmic scale for the design variables П1 and p*. The training points are indicated by circles and the training points by crosses.

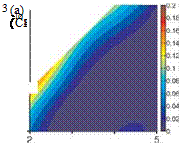
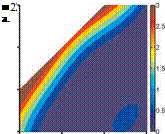
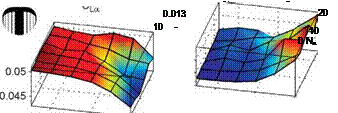
Figure 4.39. Surrogate model responses for (a) lift, (b) twist, and (c) bending angles for a flapping isotropic Zimmerman wing, hovering at Re = 1.5 x 10³ and k = 0.56.

So в gives the degree of the lift-favorable projectional area of the wing due to the deformation, and (iii) the bending angle f that is defined as

Подпись: f = max tan 1 RПодпись:

Подпись: 1

– ф

which measures the wing deformation in the spanwise direction x as the maximum tip displacement angle relative to the imposed flap angle ф. For simplicity we refer to lift as the time-averaged lift coefficient in this section.

The experiments use a face-centered cubic design (FCCD). Then the remainder of the design space is filled evenly in the design space, with the cases 8 and 10 together with the testing points generated by the latin hypercube algorithm. In total 14 training points are selected. The design space with a logarithmic bias toward the softer П1 and lighter p* structures is shown in Figure 4.38. The region where log10 p* > log10 П1 + 2 is out of the scope of the current study as this region showed largely unstable behavior of the wing motion because the imposed frequency of 10 Hz is close to the natural frequencies [351].

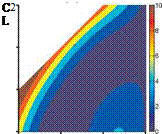
The resulting surrogate models are shown in Figure 4.39 for the lift, twist, and bending angle. Notice that the time-averaged lift for the rigid wing would be zero due to the symmetry in the hovering kinematics without pitching motion. The lift, twist, and bending are at the maximum at case 4 (shown in Fig. 4.38). However, these three objective functions follow qualitatively similar trends in the design space, sug­gesting that there exists a correlation between the resulting time-averaged lift force and the maximum deformations. Furthermore, it is not only the effective stiffness П1 or the density ratio p* but also the balance between these two parameters that determine the resulting deformation and the lift generation. The region of increased objective functions between log10 П1 = 4 and 5 and log10 p* = 1 to 2 is caused by the error in the surrogate model due to the high gradient near the resonance region, yet there is a wide region of almost zero values at the stiffer and lighter portion of the design space.

As the sinusoidal rigid-body motion is imposed at the triangular rigid part near the wing root (see Fig. 4.37), the wing inertia and the resulting aerodynamic load are balanced out by the elastic force. Since the wing is made of isotropic material the structure responds with both spanwise bending and twisting.

For the chordwise flexible airfoil in Section 4.4.2.1 and the spanwise flexible wing in Section 4.4.2.2, the thrust generation in forward flight was shown to be mostly dependent on the resulting tip motion relative to the imposed kinematics at the wing root. For the flapping Zimmerman wing in hover in air, maximum horizontal tip displacement w, normalized by the prescribed amplitude ha = R sin фa, is plotted against the phase lag with respect to the top of the stroke of the rigid body motion. The higher tip amplitude corresponds with the larger phase lag compared to the imposed kinematics, while the tip motion is in phase. The cases with the lowest П1/р* ratio have larger deformation consistent with the surrogate model responses shown in Figure 4.39.

Spanwise Flexible Wing

Flexibility in spanwise direction of the wing affects the resulting flapping velocity along the spanwise direction. Liu and Bose [503] considered a 3D pitching and plunging wing in forward flight. Their results showed that the phase of the flexing motion of the wing relative to the prescribed heave motion plays a key role in determining thrust and efficiency characteristics of the fin.

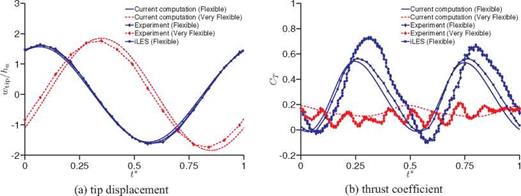
Figure 4.33. Time history of (a) tip displacements and (b) thrust coefficient of a plunging spanwise flexible wing at Re = 3.0 x 10⁴ for different wing stiffness, wing density, and motion frequencies. The experimental data are extracted from Heathcote, Wang, and Gursul [502] and the implicit LES from Gordnier et al. [504]. From Kang et al. [351].

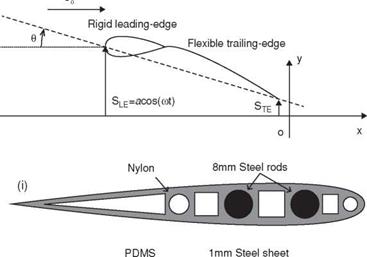
Heathcote et al. [502] conducted water-tunnel studies to study the effect of span – wise flexibility on the thrust, lift, and propulsive efficiency of a plunging flexible-wing configuration in forward flight. The leading edge at the wing root was actuated with a prescribed sinusoidal plunge displacement profile. Wing shape was recorded with a 50-frames-per-second, high-shutter-speed, digital video camera. They measured the overall wing thrust coefficient and tip displacement response. Whereas the “inflex­ible” wing cross-section was built up from nylon and reinforced by steel rods, the “flexible” and “highly flexible” cross-sections were built up from PDMS (rubber) and stiffened with a thin metallic sheet made out of steel and aluminum, respectively (see Fig. 4.28i-iii). Subsequently, computations were conducted on these wing con­figurations by Chimakurthi et al. [420], Gordnier et al. [504], and Aono et al. [505] at the chord-based Reynolds number of 3×10⁴ using an aeroelastic framework. Recently, Kang et al. [351] examined the effect of spanwise flexibility on the thrust generation for same cases.

In the following discussion we highlight the thrust enhancement mechanism associated with spanwise flexible plunging wings in forward flight for two combi­nations of density ratios and effective stiffnesses and several motion frequencies at Re = 3.0 x 10⁴ based on the results reported by Kang et al. [351] and Shyy et al. [450]. The vertical displacements of the wingtip from the computations and the experiments for the flexible and very flexible wings are shown in Figure 4.33a. The displacement is normalized with respect to the amplitude of prescribed wing root movement (see Eq. (3-12)). For the flexible wing, in comparison to the tip response presented in previous studies (experiment [502]; implicit LES (iLES) computation [504]), the tip response of the current computation shows good correlation. For the very flexible wing, however, the tip response of the current computation exhibits slight larger amplitude and phase advance compared to the measurements [502].

Time histories of thrust coefficient for the flexible and very flexible wings are shown in Figure 4.33b. For the flexible wing the thrust in the current computa­tion is under-predicted and shows a phase advance compared to the measurements [502]. However, the magnitude and the timing of thrust peaks compare well with

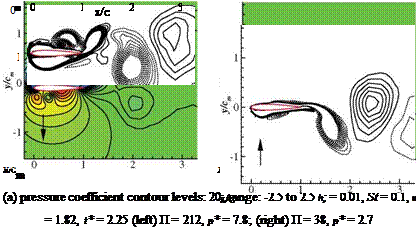
(b) vorticity contour levels: 20; range: -3 to 3
h*s = 0.01, St = 0.1, к = 1.82, t* = 2.25
(left) П = 212, p* = 7.8; (right) П = 38, p* = 2.7

Figure 4.34. Pressure coefficient (p — )/(1pU. r2ef) and vorticity contours at 75 percent span

location for flexible and very flexible wing configurations. The arrow indicates the direction of the airfoil motion. From Kang et al. [351].

the thrust prediction using the iLES [504] coupled with a geometrically non-linear beam solver. Furthermore, the measured thrust is asymmetric in the down – and upstroke, whereas in both computations the thrust has symmetric behavior. For the very flexible wing, the computed thrust history is in a reasonable agreement with the experimental measurements in terms of the amplitude and the trend of thrust. It is worth pointing out that the measurements include higher frequency components, whereas the waveforms of the computed thrust are smooth for all cases [351] [504]. As shown in Figure 4.34, there is no evidence of high-frequency behavior in the tip response. The experimental flow field measurements [502], however, show that the vortex fragments into a collection of weak vortices, and Heathcote et al. [502] suggested that this fragmentation is likely to be responsible for the multiple peaks

observed in the thrust coefficient time histories. Figure 4.34 shows vorticity and pressure contours for the flexible and the very flexible wing configurations at the mid-span section at time instant t* = 0.25, when the wing is at the center of the downstroke. The dominance of leading-edge suction in the flexible case and the reduction of it in the very flexible case are visible in Figure 4.34. The phase lag between the prescribed motion and the deformation of the wing could be used to explain the thrust generation in flexible flapping wings [450]. For the very flexible case the cross-sectional motion is in the opposite direction to the imposed kinematics at the wing root. The phase lags at the wingtip with respect to the prescribed motion for the flexible and very flexible cases are 126°, and -26°, respectively. As a result of the substantial phase lag in the very flexible case, the wingtip and root move in opposite directions during most of the stroke, resulting in lower effective AoAs and consequently lesser aerodynamic force generation; in the contour plots, see also the direction of the arrow denoting the direction of the wing movement.

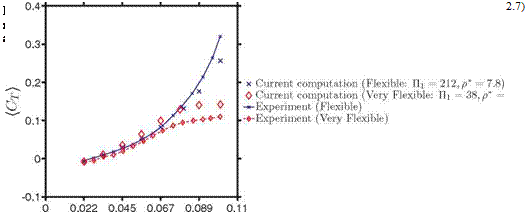
Figure 4.35 shows the time-averaged thrust coefficients for the two different materials for various frequencies of к from 0.4 to 1.82. At higher motion frequen­cies the time-averaged thrust of the flexible wing is under-predicted by the current computational results, whereas the thrust of the very flexible wing is over-predicted, which again may be ascribed to the uncertainties in the computational modeling or experimental setup. However, the qualitative trend of the thrust response to the variation of the motion frequency is well captured. When the plunging motion is slow (i. e., к < 1.2), the thrust generation is similar for both materials. For higher motion frequencies, the flexible wing benefits more from the flexibility than does the very flexible wing: the thrust saturates for the very flexible wing with increasing St. Fur­thermore, similar trends are observed: increasing motion frequency enhances thrust, and decreasing the effective stiffness does not necessarily lead to higher thrust.

The structural response is depicted in Figure 4.36. For the flexible wing, the phase lag between the prescribed motion and the tip response for к > 1.4 is from

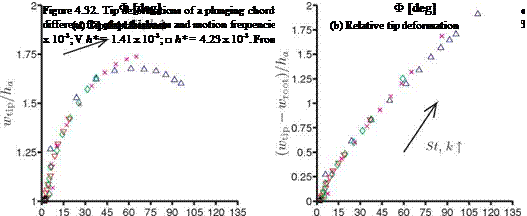
Подпись: Ф [deg] Ф [deg] (a) Tip displacement (b) Relative tip deformation Figure 4.36. Tip deformations of a plunging spanwise flexible wing at Re = 3.0 x 10⁴ for different wing stiffness, wing density, and motion frequencies. x П1 = 121, p* = 7.8; ♦П1 = 38, p* = 2.7. From Kang et al. [351].
17.6°-23.8°, whereas for the very flexible wing, Ф varies from 108.8° to 125.9°. The wingtip of the very flexible wing moves in the opposite direction from the root for most of the stroke for higher motion frequencies, whereas for the flexible wing, the wing root and the tip are in phase. This is confirmed in Figure 4.36, where all flexible wing cases show a phase lag of the wingtip relative to the wing root, Ф, less than 90°, and for к = 1.6 and к = 1.82, Ф > 90° for the very flexible wing. Again, the correlations of the dynamics from the root to tip play a key role in the tip displacement, as shown in Figure 4.36, where the relative tip displacement is shown to be monotonic to Ф. The results discussed so far focused on a single Reynolds number 3 x 10⁴. In a parametric study Heathcote et al. [502] found that the mean thrust coefficient is a function of the Strouhal number and is only very weakly dependent on the Reynolds number.

Chordwise Flexible Wing

Katz and Weihs [483] analyzed the generation of hydrodynamic forces by the motion of a uniform and massless flexible foil in a large-amplitude curved motion in an inviscid incompressible flow. They found that the chordwise flexibility increases the propulsive efficiency by up to 20 percent while causing small decreases in the overall thrust, compared with similar motion with rigid foils.

Pederzani and Haj-Hariri [484] performed computational analyses on a rigid wing from which a portion was cut out and covered with a very thin and flexible material (latex). They showed that due to a snapping motion (i. e., non-zero velocity in the direction opposite to that of the following stroke of the latex at the beginning of each stroke), the strength of the vortices that are shed is higher in lighter wing structures, leading to the generation of more thrust. Furthermore, snapping such structures requires less input power than snapping heavier ones. Using inviscid flow theory and beam equations, Chaithanya and Venkatraman [485] investigated the influence of inertial effects due to prescribed motion on the thrust coefficient and propulsive efficiency of a plunging/pitching thin plate. Their results demonstrated that flexible airfoils with inertial effects yield more thrust than those without inertial effects. This is due to the increase in the fluid loading in the former that subsequently leads to an increase in the deformation. Due to their shape, deformed airfoils produce a force component along the forward velocity direction [485].

Gopalakrishnan [486] analyzed the effects of elastic cambering of a rectangu­lar membrane flapping wing on aerodynamics in forward flight using a linear elastic membrane solver coupled with an unsteady LES method. They investigated different membrane prestresses to give a desired camber in response to the aerodynamic load­ing. The results showed that the camber introduced by the wing flexibility increases the thrust and lift production considerably. Analysis of flow structures revealed that the LEV stays attached on the top surface of the wing, follows the camber, and covers a major part of the wing, which results in high force production. Attar et al.

[487] examined the effect of Strouhal number, reduced frequency, and static AoAs on the structural and fluid response of the plunging membrane airfoil. They showed that, at a low AoA and a low Strouhal number, increasing reduced frequency results in a decrease in the mean sectional lift and an increase in the drag coefficients; increasing the Strouhal number significantly affects the lift generation at a low AoA and an intermediate value of reduced frequency. They also observed that, when the effective AoA is studied for fixed values of the Strouhal number and reduced frequency, the act of plunging gives improved mean sectional lift when compared with the case of a fixed flexible airfoil (see Section 4.4.1). In contrast, for rigid wings, which they also considered, the LEV lifts off from the surface, resulting in low force production.

To evaluate the role played by the LEV for a flexibly cambered airfoil, Gulcat

[488] investigated (i) a thin rigid plate in a plunging motion, (ii) a flexibly cambered airfoil whose camber was changed periodically, and (iii) the plunging motion of a flexibly cambered airfoil. The leading-edge suction force for all cases was predicted by means of the Blasius theorem, and the time-dependent surface velocity distribu­tion of the airfoil was determined by unsteady aerodynamic considerations. Gulcat [488] reported that the viscous effects obtained by the unsteady boundary-layer solution produce very little alteration to the oscillatory behavior of the net propul­sive force. These forces only reduce the amplitude of the leading-edge suction force obtained by the unsteady aerodynamic theory. Heaving plunging makes the major contribution to the thrust; therefore, it is possible to get high propulsion efficiency with limited camber flexibility.

Miao and Ho [489] prescribed a time-dependent flexible deformation profile for an airfoil in pure plunge and investigated the effect of flexure amplitude on the unsteady aerodynamic characteristics for various combinations of Reynolds num­bers and reduced frequency. For the specific combination of Reynolds number, reduced frequency, and plunge amplitude, the results showed that thrust-indicative wake structures are observed behind the trailing edge of those airfoils with flexure amplitudes of 0.0-0.5 of the chord length. This wake structure evolves into a drag- indicative form as the flexure amplitude of the airfoil is increased to 0.6 and 0.7 of the chord length. Studies conducted under various combinations of Reynolds numbers and reduced frequency showed that the propulsive efficiency of a chordwise flexible airfoil in pure plunge is influenced primarily by the value of the reduced frequency rather than by the Reynolds number.

Toomey and Eldredge [490] performed numerical and experimental investi­gations to understand the role of flexibility in flapping wing flight using two rigid elliptical sections connected by a hinge with a torsion spring. The section at the lead­ing edge was prescribed with fruit-fly-like hovering wing kinematics [201], whereas the trailing-edge section responded passively due to the fluid dynamic and iner – tial/elastic forces. It was found that the lift force and wing deflection are primarily controlled by the nature of the wing rotation. Faster wing rotation, for example, leads to larger peak deflection and lift generation. Advanced rotation also leads to a shift in the instant of peak wing deflection, which increases the mean lift. In contrast to the rotational kinematics, the translational kinematics has very little impact on spring deflection or force. And although the rotational kinematics is nearly indepen­dent of the Reynolds number, the translational kinematics increases with increasing Reynolds number.

Poirel et al. [491] conducted a wind-tunnel experimental investigation of self­sustained oscillations of an aeroelastic NACA 0012 airfoil occurring in the tran­sitional Re regime; in particular, aeroelastic limit cycle oscillations for the airfoil constrained to rotate in pure pitch. The structural stiffness and the position of the elastic axis were varied. Their investigation suggested that laminar separation plays a role in the oscillations, either in the form of trailing-edge separation or due to the presence of a laminar separation bubble.

Vanella et al. [492] conducted numerical investigations on a similar structure and found that the best performance (up to approximately 30 percent increase in lift) is realized when the wing is excited by a non-linear resonance at one third of its natural frequency. For all Reynolds numbers considered, the wake-capture mechanism is enhanced by a stronger flow around the wing at stroke reversal, resulting from a stronger vortex at the trailing edge.

Heathcote et al. [493] investigated the effect of chordwise flexibility on aerody­namic performance of an airfoil in pure plunge under hovering conditions. Because the trailing edge is a major source of shedding of vorticity at zero free-stream veloc­ity, they showed that the amplitude and phase angle of the motion of the trailing edge affect the strength and spacing of the vortices, as well as the time-averaged velocity of the induced jet. Direct force measurements confirmed that, at high plunge fre­quencies, the thrust coefficient of the airfoil with intermediate stiffness is highest, although the least stiff airfoil could generate larger thrust at low frequencies. It was suggested that there is an optimum airfoil stiffness for a given plunge frequency and amplitude. Similar conclusions were made in another study [494] that analyzed the influence of resonance on the performance of a chordwise flexible airfoil prescribed with pure plunge motion at its leading edge. It was shown that although the mean thrust could increase with an increase in flexibility, below a certain threshold the wing is too flexible to communicate momentum to the flow. Yet, too much flexibility leads to a net drag, and hence, only a suitable amount of flexibility is desirable for thrust generation.

Although most of the recent computational and experimental studies have explored the role of wing flexibility in augmenting aerodynamic performance while focusing on single wings at relatively higher Reynolds numbers, Miller and Peskin [495] numerically investigated the effect of wing flexibility on the forces produced during clap-and-fling/peel motion [68] of a small insect (Re & 10) focusing on wing­wing interactions. They prescribed both clap-and-fling kinematics separately to a rigid and a chordwise flexible wing and showed that, although lift coefficients pro­duced during the rigid and flexible clap strokes are comparable, the peak lift forces are higher in the flexible cases than in the corresponding rigid cases. This is due to the peel motion that delays the formation of the TEVs, thereby maintaining vortical asymmetry and augmenting lift for longer periods [496].

Zhao et al. [497] investigated the chordwise flexibility effects on the LEVs and aerodynamic force generation using 16 different dynamically scaled mechani­cal flexible model wings in quiescent fluid at a Reynolds number of 2 x 10³ [498]. Findings from their experiments are that the magnitude of the LEV correlates with the aerodynamic forces generated by the flapping wing, and the camber influences instantaneous aerodynamic forces through the modulation of the LEV. Du and Sun [499] numerically investigated the effect of prescribed time-varying twist and chord – wise deformation on the aerodynamic force production of a fruit-fly-like model wing in hover. They showed that aerodynamic forces on the flapping wing are not affected much by the twist, but by the camber deformation. The effect of combined camber and twist deformation is similar to that of camber deformation alone. With a defor­mation of 6 percent camber and 20° twist (typical values observed for wings of many insects), the lift increases by 10-20 percent compared to the case of a rigid flat plate wing. They therefore showed that chordwise deformation could increase the maxi­mum lift coefficient of a fruit fly model wing and reduce its power requirement for flight.

Lee et al. [500] numerically investigated a tadpole-type wing that consists of a rigid leading edge and a flexible plate at Re of 2.5 x 10³. They considered two elastic property distributions: homogeneous and linear. Their findings showed that the structural deformation changes the effective AoA, the vortex intensity, and the direction of the net force vector, resulting in a 13 percent increase in lift for the homogeneous type and a 33 percent increase in propulsive efficiency and force for the linear type distribution. Mountcastle and Daniel [501] numerically studied how aerodynamic force production and control potential are affected by pitch/elevation phase and variations in wing flexural stiffness. They showed that lift and thrust forces are highly sensitive to flexural stiffness distributions with performance optima that lie in different phase regions.

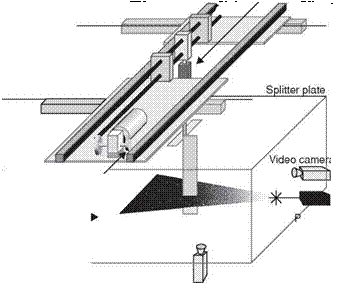
In another study, Heathcote and Gursul [336] performed water-tunnel studies to examine the thrust and efficiency of a flexible 2D airfoil plunging in forward flight. Their experimental setup is shown in Figure 4.28. Their airfoil was made up of a rigid teardrop 30 percent chord and a flexible flat plate 70 percent chord (see Fig. 4.28b). They changed the chordwise flexibility of the airfoil by changing the thickness of the flat plate. Following the experiment of Heathcote and Gursul [336], Kang et al. [351] explored the thrust enhancement induced by chordwise flexibility; they computed the thrust of a purely plunging chordwise flexible airfoil for different thickness ratios (h* = 4.23 x 10-3,1.41 x 10-3,1.13 x 10-3, 0.85 x 10⁻³, and 0.56 x 10⁻³) and motion frequencies that produce Strouhal numbers between St = 0.085 and 0.3 with 0.025 increments, with the plunge amplitude kept fixed to ha/cm = 0.194. The reduced frequency к then varies between 1.4 and 4.86. The airfoil consisted of a rigid teardrop leading edge and an elastic plate that plunged sinusoidally in the free-stream. As shown in Figure 4.29 variation in the thickness changes П1, whereas the motion frequency affects both к and St. Detailed experimental setup and discussion of fluid physics are in Heathcote and Gursul [336].

Shyy et al. [450] obtained a numerical solution for St = 0.17 for different thick­ness ratios. They used an Euler-Bernoulli beam solver to solve Eq. (4-1) for the

(b)

(ii)

V’

(iii)

PDMS

1mm Aluminium sheet

Figure 4.28. (a) Water-tunnel experimental setup for force measurements, wing deforma­tion measurements, and PIV measurements; (b) chordwise flexible airfoil configuration; (c) cross-sections of spanwise flexible wing configuration. From Heathcote and Gursul [336] and Heathcote, Wang, and Gursul [502].

deformation of the elastic flat plate, while the rigid teardrop moved with the imposed kinematics. Furthermore, the Reynolds number Re = 9.0 x 10³ and the density ratio p* = 7.8 were held constant in all cases. One of the mechanisms found by Shyy et al. [450] is that the chordwise deformation of the rear flexible plate in both flexible and very flexible cases results in an effective projected area for the thrust forces to develop. For St = 0.17, the thrust coefficient as a function of normalized time for the rigid, flexible, and very flexible wings is shown in Shyy et al. [450] and in Figure 4.29. To estimate the individual contribution of the teardrop and the flexible plate to force generation, the time histories of the thrust coefficient are shown separately for each element. The thrust response to variation in flexibility is different for each element: with increasing chordwise flexibility of the plate, the instantaneous thrust contributed by the flexible plate increases.

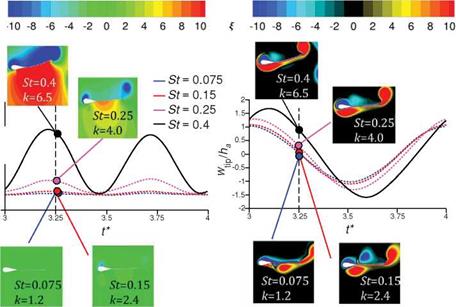
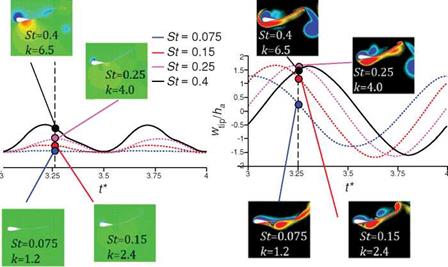
The interplay between the motion frequency indicated by St and the resulting thrust and wingtip displacement is further illustrated in Figure 4.30. For the flexible airfoil the resulting thrust generation increases with the increased motion frequency (к and St); the maximum wingtip displacement also shows monotonic increase with the motion frequency. A striking observation is that the vorticity field looks similar for all Strouhal numbers shown, but the pressure contours and the resulting thrust time histories differ in value. This could be related to the scaling proposed in Section

4.5 that the force acting on a moving body is largely dominated by the motion of the airfoil and less by the vorticity in the flow field at high reduced frequencies. A similar trend is shown for the very flexible airfoil, whose thickness ratio is about 2.5 times smaller than for the flexible airfoils. The thrust increases with higher к and St, but the maximum tip amplitude saturates for St = 0.15,0.25, and 0.4. Instead of resulting in a larger tip amplitude motion, higher motion frequency leads to a larger phase lag of the wingtip relative to the wing root. Increasing motion frequency leads to higher acceleration of the wing, and hence greater force generation. However, eventually the fluid dynamics time scale and reponse become limiting factors, as discussed in Section 4.5.

Figure 4.31 shows the time-averaged thrust coefficient for a range of motion fre­quencies from the numerical computation [351] and the experimental measurements [336]. For the thickest flat plate (h* = 4.23 x 10⁻³) the computed thrust compares well with the experimental measurements. At higher motion frequencies, St = 0.28 and

25

20

15

^ 10 5­0


-5


(a) Flexible (h* = 1.41 * 10 )


30

25

20

15

^ 10 5 0 -5


(b) Very Flexible (h* = 0.56 x 10’J)


Figure 4.30. Time histories of thrust and wingtip displacement normalized by the plunge amplitude as a function of non-dimensional time. Pressure coefficient and vorticity contours at t* = 0.25 for each Strouhal number are shown as well (Re = 9.0 x 10³ and p* = 7.8). From Kang et al. [351].


-2…………………………………………………….

Подпись: k 0.00 0.81 1.62 2.43 3.24 4.05 4.86 5.67 Подпись: 6 4 Подпись: 0

Подпись: Current computat ion, h* = 0.56 x 10 -3 (Пі = = 0.300) Current computat ion, h* = 0.85 x 10 -3 (Пі = = 1.04) Current computat ion, h* = 4.23 x 10 -3 (Пі 129) _-£-Experiment, h* = 0.56 x 10 -3 (Пі = 0.300) -«-Experiment, h* = 0.85 x 10 -3 (Пі = 1.04) -в-Experiment, h* = 4.23 x 10 -3 (Пі = 129)

0 0.05 0.1 0.15 0.2 0.25 0.3 0.35

St

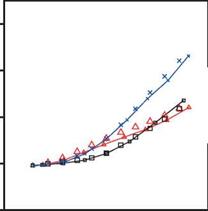
Figure 4.31. Time-averaged thrust coefficient for a plunging chordwise flexible airfoil at Re = 9.0 x 10³ and p* = 7.8 for different flat plate thickness and motion frequencies. The experi­mental data are extracted from Heathcote and Gursul [336]. From Kang et al. [351].

0.3, the computed thrust starts to deviate. A similar trend is observed for the other thicknesses: at h* = 0.85 x 10⁻³ the correlation between the numerical result and the experimental measurement is good until St = 0.23, and at h* = 0.56 x 10⁻³ it is good only at the lowest frequencies. Modeling uncertainties, such as laminar-to – turbulent transitions, non-linearities in the structural modeling, or non-negligible twist or spanwise bending in the experimental setup, which are not accounted for in the numerical computations, may be attributed to the observed differences. The thrust for the thickest airfoil (h* = 4.23 x 10⁻³) can be enhanced by increasing the motion frequency, which results in higher St and к. Increased St leads to greater fluid-dynamic force, and as shown in Section 3.6.4 increasing St and к further results in a greater acceleration-reaction force. Figure 4.31 also shows that the thrust gener­ation depends on the thickness of the wing: At St = 0.125, [CT) for h* = 0.56 x 10⁻³ is the maximum, but for higher Strouhal numbers the thrust generated by the thinnest airfoil is the lowest. At St = 0.3, h* = 0.85 x 10⁻³ generates the highest thrust, while the thinnest wing, h* = 0.56 x 10⁻³ deteriorates in thrust.

To characterize the structural response, the tip displacement normalized to the plunge amplitude, wtip/ha, is plotted in Figure 4.32 as a function of the phase lag relative to the leading edge for the thicknesses and frequencies considered. The phase lag Ф is calculated by determining the time instant at which the trailing – edge displacement is a maximum. For the thickest airfoil, h* = 4.23 x 10⁻³, both the deformations and the phase lag are small. As we decrease the airfoil thickness, both wtip/ha and Ф increase with increasing frequency. Eventually, wtip/ha saturates when Ф approaches 90°: when Ф > 90° the motion of the deformed trailing edge is out of phase with the imposed leading edge. Relative to the leading-edge displacement, (wtip – Wroot)/ha shows that, by decreasing the stiffness and increasing the motion frequency, not only does the tip deformation increase monotonically but also the phase lag does, so that the resulting wingtip displacement reduces in magnitude


when the motion is out of phase (Fig. 4.31). The phase lag is known to be a critical parameter for flight efficiency [223] [454]. Due to the monotonic relation observed between (wtip – wroot)/ha and Ф, for the cases considered in this study, the role of the phase lag may be related to the relative maximum deformation, which is shown later to be the main parameter that describes the force and the propulsive efficiency scalings (Section 4.5.2). In Section 4.5 a relationship between the mean thrust and the structural response is established. Furtheremore, Spagnolie et al. [223] showed that when Ф < 180° the freely moving wing moves forward, and when Ф > 180° it moves backward. The phase differences observed in this study are smaller than 180°, producing thrust consistent with their observation. It is also remarkable to observe that the critical phase lag of 180° pointed out by Spagnolie et al. [223] corresponds to the maximum obtainable relative tip deformation, which occurs when the tip motion and the root motion are 180° apart.

In summary, considering the outcome from the studies conducted on chordwise flexible plunging/pitching structures discussed so far, three factors may play a vital role in aerodynamic force generation in hover/forward flight: (i) airfoil plunge motion modifies the effective AoA and aerodynamic forces; (ii) the relative motion of the leading edge and trailing edge creates the pitch angle that dictates the direction of the net force; and (iii) airfoil shape deformation modifies effective geometry such as camber.

Flapping Flexible Wings

Research into aeroelasticity of flapping wings has recently increased though a full picture of the basic aeroelastic phenomena has not yet been obtained [451]. One important question that needs to be answered to understand the key fundamen­tals of flapping flexible wings is, Are aerodynamic loads essential to determine the wing deformation during the flights of biological flyers? Daniel and Combes [470] analytically addressed this question and suggested that aerodynamic loads are rel­atively unimportant in determining the bending patterns in oscillating wings, when the ratio between the wing structure and the surrounding air is high. Subsequently, experimental investigations by Combes [471] and Combes and Daniel [472] found that the overall bending patterns of a Hawkmoth wing when flapped (single degree – of-freedom flap rotation) in air and helium are quite similar, despite a 85 percent reduction in fluid density in the latter, suggesting that the contribution of aerody­namic forces is relatively small compared to that of inertial-elastic forces during flapping motion. However, they also mentioned that realistic wing kinematics may include rapid rotation at the stroke reversals that may lead to increased aerodynamic forces due to unsteady aerodynamic mechanisms (see also Section 3.3). Furthermore, static bending tests done by Combes and Daniel [402] showed anisotropy of wing structures in a variety of insect species. Mountcastle and Daniel [473] investigated the influence of wing compliance on the mean advective flows (indicative of induced flow velocity) using PIV measurement. Their results demonstrate that flexible wings yield mean advective flows with substantially greater magnitudes and orientations that are more beneficial to lift than do stiff wings.

For simpler flapping wing configurations, Zhu [474] numerically investigated the unsteady oscillation of a flexible wing and found that, when the wing is immersed in air, the chordwise flexibility reduces both the thrust and the propulsion effi­ciency, whereas spanwise flexibility (through equivalent plunge and pitch flexibility) increases the thrust without efficiency reduction within a small range of structural parameters. However, when the wing is immersed in water, the chordwise flexibil­ity increases the efficiency and the spanwise flexibility reduces both the thrust and the efficiency. Shkarayev et al. [475] investigated the aerodynamics of cambered membrane flapping wings. Specifically, they introduced a cambered airfoil into the wing by shaping metal ribs attached to the membrane skin of the 25 cm wingspan model. They found that the thrust force generated by a 9 percent camber wing is 30 percent higher than that of a flat wing of the same size. Adding a dihedral angle to the wings and keeping the flapping amplitude constant improves the cambered wing’s performance even further. The aerodynamic coefficients are defined using a reference velocity as a sum of two components: a free-stream velocity and a stroke – averaged wingtip flapping velocity. The lift, drag, and pitching moment coefficients obtained using this procedure collapse well for studied advance ratios, especially at lower AoAs.

Hui et al. [476] examined various flexible wing structures to evaluate their impli­cations on flapping wing aerodynamics. They showed that the flexible membrane wings have better overall aerodynamic performance (i. e., lift-to-drag ratio) over the rigid wing for soaring flight, especially for high-speed soaring flight or at a relatively high AoA. The rigid wing has better lift production performance for flapping flight in general. The latex wing, which is the most flexible among the three tested wings, has the best thrust generation performance for flapping flight. The less flexible nylon wing, which has the best overall aerodynamic performance for soaring flight, is the worst for flapping flight applications.

Kim et al. [477] developed a bio-mimetic flexible flapping wing using micro-fiber composite actuators and experimentally investigated the aerodynamic performance of the wing under flapping and non-flapping motion in a wind tunnel. Results showed that the camber due to wing flexibility could produce positive effects (i. e. stall delay, drag reduction, and stabilization of the LEV) on flapping wing aerodynamics in quasi-steady and unsteady regions. Mueller et al. [478] presented a versatile experi­mental test for measuring the thrust and lift of a flapping wing MAV. They showed an increase in average thrust due to increased wing compliance and the detrimental influence of excessive compliance on drag forces during high-frequency operation. Also they observed the useful effect of compliance on the generation of extra thrust at the beginning and end of flapping motions.

Watman and Furukawa [479] investigated the effects of passive pitching motions of flapping wings on aerodynamic performance using robotic wing models. They considered two types of passive flapping wing models. The first model used a rigid connection between all parts of the structure. This design was utilized in several

MAVs [480] and served as a common design used for the analysis of flapping wings. The second model was designed to allow the free rotation of ribs and membrane over a limited angle. This design was used recently in a small MAV prototype [481]. They showed that the former passive flapping wing (constrained) has better performance compared to the latter design because of favorable variation in the passive pitching angle of the wing.

Wu et al. [482] conducted a multidisciplinary exercise correlating flapping wing MAVs’ aeroelasticity and thrust production by quantifying and comparing the elas­ticity, dynamic responses, and air flow patterns of six different pairs of MAV wings (in each one, the membrane skin was reinforced with different leading-edge and batten configurations) of the Zimmerman planform (two ellipses meeting at the quarter chord) with varying elastic properties. In their experiments, single degree – of-freedom flapping motion was prescribed to the wings in both air and vacuum. Among many conclusions, they found that, within the range of flexibility consid­ered, more flexible wings are more thrust-effective at lower frequencies, whereas stiffer wings are more effective at higher frequencies. They hypothesized that flexi­ble wings may have a certain actuation frequency for peak thrust production and that the performance would degrade once that frequency is passed. A rapidly growing number of studies on flexible flapping wings have been reported recently [351] [ 451]. Because the complicated problems arise from the anisotropy of the wing structure and the interaction among aerodynamic loadings, inertia, and elastic forces, it is worth understanding the aerodynamics and wing deformation of the simplified flex­ible wing model before tackling the anisotropic wing structure. This approach helps us to make the link between MAVs and biological flyers. In the following section, we highlight the studies focusing on simplified flexible wing models. namely chordwise and spanwise flexibility and isotropy.

Interactions between Elastic Structural Dynamics and Aerodynamics

1.3.1 Fixed Membrane Wing

Much of the earlier efforts in membrane wing studies focused on fixed-wing-based vehicles [207]. Of particular importance to the membrane wing MAVs is the passive ability of the wing skin to change shape to reflect flight conditions. Shyy et al. [408] provided a comprehensive review of MAV performance characteristics, with partic­ular emphasis on the effects of low AR and AoA on TiVs, laminar boundary-layer separation, stall characteristics, and vibrations in MAVs. Ifju et al. [17] presented methods for design and construction of a variety of flexible wing MAVs and demon­strated that the adaptive nature of the flexible wing design greatly improved stability and reduced drag.

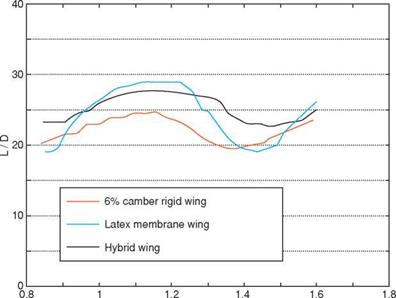
Shyy et al. [456] compared the performance between a low Reynolds number membrane and rigid airfoil in terms of the lift-to-drag ratio. They investigated three airfoils – one rigid, one membrane based, and the third a hybrid of both – of the same nominal camber at 6 percent in a fluctuating free-stream. To mimic the effect of wind gust the fluctuations in the free-stream were modulated for 25 percent or more, and the sinusoidal modulation frequency of the free-stream was 1.7 Hz. The linear membrane model was used to account for the airfoil’s flexibility. The hybrid airfoil was built with a curved wire screen beneath the membrane, so that it could achieve a camber deformation greater than 6 percent, but not less because the wire construction prevented a decrease in the camber. The size of the wing chords and the average wind tunnel speed gave a Reynolds number of 7.5 x 10⁴. The experiments for all three airfoils were conducted at an AoA of 7° and the results are shown in Figure 4.14. Detailed numerical simulations based on the Navier-Stokes equations and two-equation turbulence closure, along with a moving grid technique to track the shape variations of the membrane and hybrid airfoils, were conducted for various configurations.

Shyy et al. [456] found that, at modest AoA, the flow over the rigid airfoil is attached to the surface at all time and the lift-to-drag ratio follows the free-stream fluctuations. When the AoA is increased to 7° substantial flow separations occur, causing a modification to the effective shape of the rigid airfoil. As the AoA is

Time (seconds)

Figure 4.14. Experimental L/D results for rigid, flexible, and hybrid wings at Re = 7.5 x 10⁴ and AoA = 7°. The latex membrane wing exhibits about 6% camber at 35.4 fps. The hybrid wing has a curved-wire screen camber stop. From Shyy et al. [456].

increased, CL tends to increase as well, but the lift-to-drag ratio decreases due to flow separation. When the flow is separated at higher AoAs, the airfoil is less sensitive to an unsteady free-stream. At both AoAs, the lift coefficients between rigid and flexible airfoils are comparable, but the lift-to-drag ratio is higher for the flexible airfoil. For the membrane airfoil, at AoA=7° the flow separation is confined to the leading edge, resulting in a better aerodynamic performance. However, some negative effects occur with the flexible membrane. When the free-stream velocity reached its lower values during a fluctuating cycle, the camber of the flexible membrane tends to collapse, and a massive separation over the whole surface occurs. This phenomenon is due to the smaller pressure differences between the upper and lower surface of the membrane, and hence a degraded performance is obvious.

The hybrid airfoil, which has a curved wire screen stop to prevent the camber from becoming too low, shows interesting results. For a lower AoA the aerodynamic characteristics associated with a hybrid wing are essentially the same as for those with a flexible airfoil because the flow field near the wing is non-separating. However, when the AoA is increased, the characteristics are considerably better for the hybrid airfoil compared to the flexible profile. The separation zone is smaller, compared to the rigid airfoil, and the sensitivity to fluctuations in the free-stream is reduced when compared to the flexible configuration.

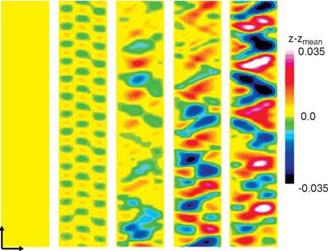
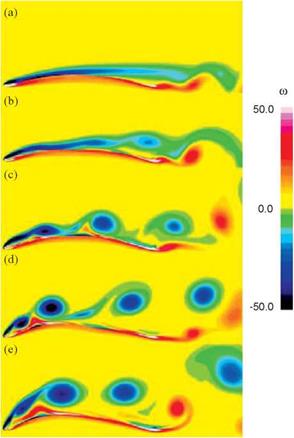
A computational study [469] of unsteady structural response of the membrane airfoil is shown in Figure 4.15i. This figure displays the membrane oscillations by means of x-t diagrams showing the difference between the instantaneous and mean membrane deflection. The membrane is nominally stationary at AoA = 4° because the flow is steady over the major portion of the airfoil (see Fig. 4.15ii). At

(a) (b) (c) (d) (e)


(ii)


Figure 4.15. (i): x-t diagram for perturbation from the mean membrane deflection and (ii) instantaneous vorticity for various AoAs: (a) AoA = 4°, (b) AoA = 8°, (c) AoA = 12°, (d) AoA = 16°, and (e) AoA = 20°. From Gordnier [469].


(c)


(d)


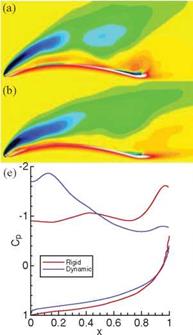
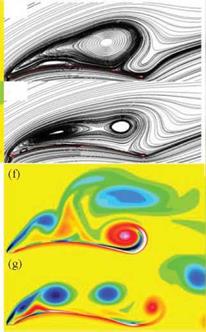
Figure 4.16. Comparison of the rigid (a, c,f) and dynamic (b, d,g) membrane airfoil solutions for AoA = 20°: a, b) mean vorticity, c, d) mean streamlines, e) surface pressure coefficient, f, g) instantaneous vorticity. From Gordnier [469].

AoA = 8°, a third mode standing wave response develops. At the higher AoAs (12°~20°), the membrane structural response exhibits a less regular behavior result­ing from a combination of structural modes. The maximum peak-to-peak amplitude of the deflection grows with increasing AoA values of an order 0.07 times the chord.

To understand the effects of the motion of the membrane on the flow field, a computational investigation [470] was conducted for a rigid membrane at AoA = 20°. Figure 4.16 compares the mean and unsteady solutions for these two cases. The mean solutions for the rigid (Fig. 4.16a and c) and dynamic (Fig. 4.16b and d) cases show that the flow field around the rigid membrane exhibits a larger and stronger stall vortex and also a larger secondary separation bubble located farther downstream on the airfoil between x = 0.171 to x = 0.44. There is also a region of strong vorticity of the opposite sign near the trailing edge associated with the roll-up of a vortex. This notable difference between the rigid and dynamic mean flow results from a distinct change in the unsteady flow field as illustrated in Figure 4.16f and g. The dynamic motion of the membrane excites the separating shear layer at the lead­ing edge, causing it to roll up sooner and to form a series of smaller vortices (Fig. 4.16g). The TEV in the dynamic case is also reduced in strength and tends to form downstream and away from the trailing edge, which reduces its influence on the airfoil. These changes between the rigid and dynamic flow fields lead to a different mean pressure distribution around the airfoil. This difference is greater on the upper surface where the rigid case exhibits a flat pressure distribution characteristic of a fully stalled flow, except near the trailing edge where the influence of the TEV is observed. In contrast, the dynamic case shows a strong suction region over the front
portion of the wing but higher values of pressure downstream. The overall impact of the dynamic motion therefore appears to be a delay in the airfoil stall with an 8 percent increase in lift and a 15 percent reduction in drag compared to the rigid wing. Further investigation of the impact of the dynamic structural response on the overall aerodynamics is warranted, because it may provide a means for pas­sively controlling the flow to provide improved airfoil performance through judicious aeroelastic tailoring.

Termed adaptive washout by Albertani et al. [457], this effect has been shown to reduce drag, give improved stall behavior, and allow for passive gust rejection. Several factors dictate the in-flight performance of a membrane wing MAV, includ­ing skeletal layout, stiffness, and membrane prestrain. The effect of batten thickness and spacing on MAVs during flight was investigated by Abudaram et al. [458], who showed that thin (less stiff) battens led to reduced wing bending and adaptive washout. Rojratsirikul et al. [459] investigated experimentally the effect of mem­brane prestrain and excess length on the fluid-structure interaction of 2D membrane airfoils. They tested the airfoils with prestrains of 0, 2.5, and 5 percent at AoAs varying from 9-30° and flow velocities of 5,10, and 15 m/s (Re = 5 x 10⁴ ~ 1.5 x 10⁵). Time-averaged membrane tension was dominated by membrane pretension for low – flow velocities, gradually increasing to a uniform value for all cases of pretension. This study also indicated that models with pretension exhibited large flow-separation regions.

Hui et al. [460] studied the effect of structural stiffness on the aerodynamic response of MAVs (Re = 7 x 10⁴). They constructed five MAVs using identical air­foils; the first was made entirely of unidirectional carbon fiber to serve as a rigid basis, whereas the remaining four were constructed to be batten-reinforced mem­brane MAVs. The number of battens varied between the models: 1,2,3, and 10. They analyzed the aerodynamic performance of the various structures in conjunction with PIV measurements. The results showed that batten-reinforced membrane MAVs of extremely low stiffness, such as the one-batten model, are too flexible to maintain the airfoil shape during flight and provide the lowest L/D of any of the models. The remaining batten-reinforced models provide delayed stall, reduced drag, and higher L/D compared to the rigid airfoil wing models. It was also shown that a sig­nificant increase in battens, and therefore stiffness, as in the case of the 10-batten model, provides very similar aerodynamic performance to the rigid airfoil model. PIV measurements showed that at AoA > 10°, the rigid airfoil undergoes flow sepa­ration, whereas the batten-reinforced models deforms, reducing the effective AoA and allowing flow to stay attached longer. Vibrations of the membrane skins of BR models are noted for low AoA (<10°).

Lian and Shyy [154] compared the aerodynamic performance of a rigid wing to that of a batten-reinforced MAV using computations and showed that they have a comparable prestall performance, whereas the membrane MAV demonstrates delayed stall and increased lift after stall. Stanford et al. [461] characterized the deflection of a membrane wing using a steady-state computation. They compared the computed membrane MAV pressure distributions and static structural deflections to the visual image correlation (VIC) results. They identified Hooke’s law as an accurate means of approximating the prestress of the stretched membrane, despite latex rubber’s hyperelastic material properties.

Galvao et al. [462] measured the lift, drag, and deflection of a compliant rectan­gular membrane wing at a Reynolds number range of 7 x 10⁴ to 2 x 10⁵ and a AoA range from -5° to 60°. The wing was composed of a compliant latex membrane held between two stainless steel posts located at the leading and trailing edges. They tested four wing models in total: a thin non-compliant wing composed of steel shim stock (denoted RW02 in Figs. 4.17 and 4.18), two compliant membrane wings using latex rubber sheets of thickness 0.25 mm and 0.15 mm (denoted EW01 and EW006 in Figs. 4.17 and 4.18, respectively), and a latex membrane wing (0.25 mm thick) in which the membrane is given 6 percent slack (denoted EW01s in Figs. 4.17 and 4.18). Figure 4.17 depicts the lift coefficient for the test. The compliant wings have greater lift slope than the rigid wing, and the thinner compliant wing has greater lift slope than the thick compliant wing. Wing deflection measurements show that this greater lift slope is due to the increased camber for the compliant wing; this is consistent with the numerical results [158]. The thinner compliant wing stretches to a greater degree

than the thicker membrane and therefore has a larger camber at the same AoA, resulting in a larger lift coefficient. Whereas Figure 4.8 shows that membrane wings have a similar lift slope to the rigid wing, Figure 4.17a indicates that flexible wings have a greater lift slope than a rigid wing. The seemingly contradictory conclusion is due to different experimental setups. Figure 4.8 is based on measurement of a MAV with a free trailing edge, which can be tilted up under forces [406]. As pointed out by Lian and Shyy [154], this trailing-edge deflection reduces the effective AoA.

The interplay among the camber, effective AoA, and the lift can be complicated. Before stall, the flexible structure in the experiments by Waszak et al. exhibits smaller effective AoA because the trailing edge is not fixed and the effective camber is reduced accordingly. In contrast, in the experiment of Galvao et al. [462], the trailing edge is fixed, resulting in a higher camber. They reported that a compliant wing can delay stall by 2 to 8 degrees of AoA, which is qualitatively consistent with the observation of Waszak et al. [406]. After stall, the lift coefficients for the compliant wings decrease in a more attenuated manner compared to the rigid wing. Close to the stall, the camber of the wing is observed to decrease. The de-cambering decreases the severity of the separation, thus delaying the sharp drop in lift force. This behavior enables the wing to sustain high lift at high AoAs. Furthermore, the compliant wings generate more lift at AoAs from 5° to 55°. The compliant wings are also found to yield more drag (Fig. 4.17) for two possible reasons. First, the enlarged camber increases the form drag. Second, the high-frequency fluctuation and vibration heighten the drag. This vibration becomes more noticeable when the trailing edge is not fixed, possibly leading to flutter. As we have explained before, during slow – forward flight, bats can only flex their wings slightly to avoid flutter. The compliant wings also demonstrate their superiority in terms of power efficiency (CL3/2/CD) over a wide range of AoAs (Fig. 4.18a) [462]. This becomes more evident at higher AoAs. However, in terms of flight range efficiency (CL/CD), compliant wings have comparable performance to the rigid wing (Fig. 4.18b).

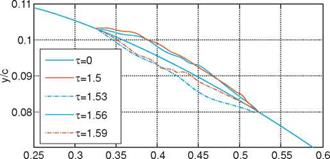
Lian and Shyy [463] numerically investigated the flexible airfoil aerodynamics. In their test, the upper surface of the airfoil is covered with a membrane that extends from 33-52 percent of the chord. No pretension is applied to the membrane. The membrane has a uniform thickness of 0.2 mm with a density of 1200 kg/m3 and is considered as hyperelastic material. A computational test is performed at AoA = 4° and Re = 6 x 10⁴. It is observed that when flow passes the flexible surface, the surface experiences self-excited oscillation and the airfoil displays varied shape over time (Fig. 4.19). Analysis shows that the transverse velocity magnitude can reach as much as 10 percent of the free-stream speed (0.3 m/s). During the vibration, energy is transferred from the wall to the flow, and the separated flow is energized. Compared with corresponding rigid airfoil simulation, the surface vibration causes both the separation and transition positions to exhibit a standard variation of 6 percent of the chord length.

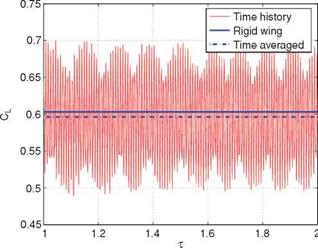
Figure 4.20 presents the time history of the lift coefficient for the membrane wing. Even though the time-averaged lift coefficient 0.60 of a flexible wing is comparable to that of the corresponding rigid wing, the membrane wing lift coefficient displays a time-dependent variation, with a maximum magnitude as much as 10 percent of its mean. The drag coefficient shows a similar pattern, but the time-averaged value closely matches that of the rigid wing. These observations are consistent with

x/c

Figure 4.19. Membrane airfoil shapes in a steady tree-stream at different time instants. The vibration changes the effective wing camber, where т is the non-dimensional time, defined by tc/U [463].

previous efforts in 3D MAV wing simulations, without transitional flow models [154]. Furthermore, the experimental evidence also supports that, until the stall condition is reached, the membrane and rigid wings exhibit comparable aerodynamic performance. The flexible wing, in contrast, can delay the stall margin substantially [406] [462]. Using discrete Fourier transformation analysis the primary frequency of this flexible airfoil is found to be 167 Hz (Fig. 4.21). Given the airfoil chord (0.2 m) and free-stream speed (0.3 m/s), this high vibration frequency is unlikely to affect the vehicle stability. Figure 4.20 indicates that a low-frequency cycle exists in the high – frequency behavior in the lift coefficient history. This cycle, with a frequency of about 14 Hz, seems to be associated with the vortex shedding (Fig. 4.22). In a different simulation with laminar flow over a six-inch membrane wing (i. e., the entire wing surface is flexible), Lian and Shyy observed a self-excited structural vibration with a frequency around 120 Hz [154]; the experimental measurement of similar wings records a primary frequency around 140 Hz [406].

Figure 4.20. Time history of lift coefficient for membrane wing, showing both a high – and a low-frequency oscillation [463].


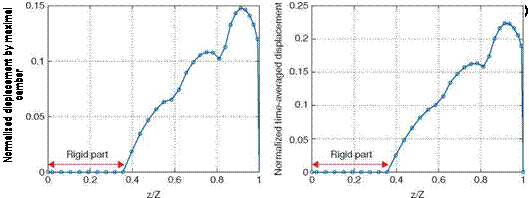
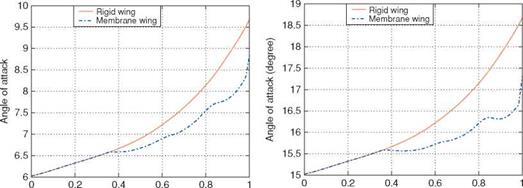
Lian et al. [160] compared the aerodynamics between membrane and rigid wings for MAV applications. The flexible wing exhibits slightly less lift coefficient than the rigid one at AoA = 6°. The difference in CL/CD is also small. At a higher AoA of 15°, the membrane wing generates a lift coefficient about 2 percent less than the rigid wing; however, its CL/CD is slightly larger than that of the rigid wing. This observation is consistent with the findings of Shyy et al. [456]. The membrane wing changes its shape under an external force. This shape change has two effects: it decreases the lift force by reducing the effective AoA of the membrane wing, and it increases the lift force by increasing the camber. Both the numerical findings of Lian and Shyy [158] and the experimental observations of Waszak et al. [406] show that membrane and rigid wings exhibit comparable aerodynamic performance before the stall limit. Figure 4.23 shows the time-averaged vertical displacement of the trailing edge. The displacement is normalized by the maximal camber of the wing. Due to the membrane deformation, the effective AoA of the membrane wing is less than that of the rigid wing. The spanwise AoAs between rigid and membrane wings under the same flow condition and with identical geometric configurations are shown in Figure 4.24. In Figure 4.24a, the rigid wing has an incidence of 6° at the root and monotonically increases to 9.5° at the tip. The membrane wing shares the same AoAs with the rigid wing in the 36 percent of the inner wing; however, the effective AoA toward the tip is less than that of the rigid wing. At the tip, the AoA of the membrane wing lowers by about 0.8°. Figure 4.24b compares the time-averaged spanwise AoA at AoA = 15°, showing that the effective AoA of the membrane wing is more than 1° less than that of the rigid wing at the tip. The reduced effective AoA causes the decrease in the lift force.

In an attempt to understand the aerodynamics/aeroelasticity aspects of mem­brane wings, Shyy et al. [455], Stanford and Ifju [464], and Stanford et al. [407] studied a rigid wing and two flexible fixed wing MAV structures. The first of the flex­ible wing MAV has membrane wings with several chordwise batten structures and a free trailing edge for geometric twist (batten-reinforced [BR] wings). The second has membrane wings whose interior is unconstrained and is sealed along the perimeter to a stiff laminate for aerodynamic twist (perimeter-reinforced [PR] wings). Typical flow structures for all three wings are shown in Figure 4.25 for an AoA = 15° and

Spanwise z/Z Spanwise z/Z

Figure 4.24. Time-averaged spanwise AoA for membrane wing: (a) AoA = 6°; (b) AoA = 15° [463].

UTO = 15 m/s. The two hallmarks of MAV aerodynamics can be seen from the flow over the rigid wing: the low Reynolds number (105) causes the laminar boundary layer to separate against the adverse pressure gradient at the wing root, and the low aspect ratio (AR = 1.2) forces a strong TiV swirling system, leaving a low-pressure region at the wingtip. Flow over the flexible BR wing is characterized by pressure undulations over the surface [465], where the membrane inflation between each bat­ten redirects the flow. The shape adaptation decreases the strength of the adverse pressure gradient and thus the size of the separation bubble. A large pressure spike develops over the PR wing at the leading edge of the membrane skin. The pressure recovery over the wing is shifted aftward, and the flow separates as it travels down the inflated shape, where it is then entrained into the low-pressure core of the TiV. This interaction between the TiVs and the longitudinal flow separation is known to lead to unsteady vortex destabilization at high AoA [167]; no such relationship is obvious for the BR and rigid wings. The low-pressure regions at the wingtips of the two membrane wings are weaker than those observed on the rigid wing, presumably due to energy considerations: strain energy in the membrane may remove energy from the lateral swirling system. Furthermore, the inflated membrane shape may act as a barrier to the tip vortex formation.

Figure 4.25. Streamlines and pressure distributions (Pa) over the top wing surface: AoA = 15°, UOT = 15 m/s [407].

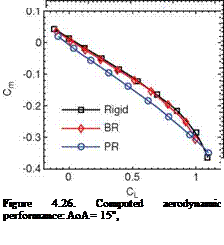
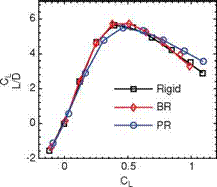
The lift, drag, and pitching moment coefficients for these three wings through an а-sweep are shown in Figure 4.26. The CL-a relationships are mildly non-linear (20-25 percent increase in CL between 0° and 15°) due to growth of the low-pressure cells at the wingtip. Further characteristics of a low AR are given by the high stall angle, computed as being 21° for the rigid case. The aerodynamic twist of the PR wing increases CL (by as much as 8 percent), making the MAV more susceptible to gusty conditions. CL, max is slightly higher as well, subsequently lowering the stall angle to 18°. The adaptive washout of the BR wing decreases CL (by as much as 15 percent over that of the rigid wing), though the change is negligible at lower AoAs. This decrease is thought to be a result of two offsetting factors: the adaptive washout at the trailing edge decreases the lift, while the inflation of the membrane toward the leading edge increases the effective camber, and hence the lift.

Comparing the drag polars of Figure 4.26, it can be seen that both flexible wings incur a drag penalty at small lift values, indicative of the aerodynamically non-optimal shapes assumed by the flexible wings, although the BR wing has less drag at a given AoA [466]. The drag difference between the rigid and the BR wing is very small, while the PR wing displays a larger penalty. This larger penalty is presumably due to two factors: a greater percentage of the wing experiences flow separation, and a large portion of the pressure spike at the leading edge is pointed in the axial direction. Pitching moments (measured about the leading edge) have a negative slope with both CL and AoA, as necessitated by stability requirements. Non-linear trends due to low AR effects are again evident. Both the BR and the PR

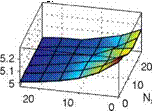
Подпись:Подпись: yПодпись: L/DПодпись: 20Подпись: 10Подпись: 20Подпись: 10Подпись: CПодпись: 0Подпись: 0Подпись: NПодпись: NПодпись: yПодпись: yПодпись: Figure 4.27. Aeroelastic tailoring of chordwise (Nx) and spanwise (Ny) membrane prestress resultants (N/m): contour represents z-axis values [407].Подпись:

20 10

0 Nx

wings have a lower 9Cm/dCL than the rigid wing, though only the PR wing shows a drastic change (by as much as 15 percent) as a result of the membrane inflation, which shifts the pressure recovery toward the trailing edge, adaptively increasing the strength of the restoring pitching moment with increases in lift/AoA [461]. Steeper Cm slopes indicate larger static margins: stability concerns are a primary target of design improvement from one generation of MAVs to the next. The range of flyable center of gravity (CG) locations is generally only a few millimeters long; meeting this requirement represents a strenuous weight management challenge. Furthermore, the PR wing displays a greater range of linear Cm behavior, possibly because the adaptive membrane inflation quells the strength of the low-pressure cells, as discussed earlier. No major differences appear between the L/D characteristics of the three wings for low AoAs. At moderate angles, the large drag penalty of the PR wing decreases the efficiency, while the BR wing slightly outperforms the rigid wing. At higher angles, both the lift and drag characteristics of the PR wing are superior to the other two, resulting in the best L/D ratios.

Aeroelastic tailoring conventionally uses unbalanced laminates for bend/twist coupling, but the pretension within the membrane skin has an enormous impact on the aerodynamics: for the 2D case, higher pretension generally pushes flexible wing performance to that of a rigid wing. For a 3D wing, the response can be considerably more complex, depending on the nature of the membrane reinforcement. Effects of increasing the membrane pretension may include a decrease in drag, decrease in CL, linearized lift behavior, increase in the zero-lift AoA, and more abrupt stalling patterns. Furthermore, aeroelastic instabilities pertaining to shape hysteresis at low AoAs can be avoided with specific ratios of spanwise-to-chordwise pretensions [467].

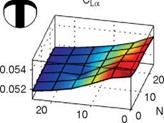
Increasing the prestress within the membrane skin of a BR wing (Fig. 4.27) generally increases CLa, decreases Cma, and decreases L/D. The system is very
sensitive to changes in the prestress normal to the battens and less so to the stress parallel to the battens, due to the zero prestress condition at the free edge. Minimizing CLa (for optimal gust rejection) is found with no prestress in the span direction and a mild amount in the chord direction. The unconstrained trailing edge eliminates the stiffness in this area (allowing for adaptive washout), but retains the stiffness toward the leading edge, removing the inflation seen there (and the corresponding increase in lift). Such a tactic reduces the conflicting sources of aeroelastic lift seen in a BR wing. Maximizing CLa (for effective pull-up maneuvers, for example) is obtained by maximizing Ny and setting Nx to zero. Conversely, maximizing CLa with a constraint on L/D might be obtained by maximizing Nx and setting Ny to zero. Opposite trends are seen for a PR wing. Increasing the prestress within the membrane skin generally decreases CLa, increases Cma, and increases L/D. The chordwise prestress has a negligible effect on the stability derivatives, though both directions contribute equally to an improvement in L/D. As such, optimization of either derivative with a constraint on L/D could easily be provided by a design with maximum chordwise pretension and a slack membrane in the span direction. Overall sensitivity of the aerodynamics to the pretension in the membrane skin of a BR or a PR wing can be large for the derivatives (up to a 20 percent change in the Cma of a BR wing), though less so for the wing efficiency. Variations in L/D are never more than 5 percent.

More recently, membrane wing MAVs have been developed and tested to deter­mine the structural response of BR membrane wings for varying conditions: small AoAs, number of battens, and membrane pretension [468]. A self-excited instability (flutter) was noted for each model with limit cycle oscillations occurring post-flutter flow velocities. These experiments showed that increasing the membrane preten­sion and the number of structural battens for the membrane wing MAVs delays the flutter velocity and reduces the magnitude of limit cycle oscillations at a given flow velocity.

Scaling Parameters for the Flexible Wing Framework

As previously discussed in Section 1.2, scaling parameters resulting from dimen­sional analysis help identify key characteristics of the model, via Buckingham’s П-theorem, and also reduces the number of involved parameters to the sufficient number of combinations [333], [447]-[449]. Under certain circumstances, the result obtained from the dimensional analysis can be reduced to a simpler relationship, with a reduced number of arguments, as a property of the special problem under consideration. The non-dimensional parameters arising from such a scaling analysis can identify similarity variables, which can be of critical value even if a complete mathematical solution is missing [447].

Generally for a flapping rigid wing framework (as discussed in Chapter 3), two non-dimensional parameters, such as Reynolds numbers and reduced frequency or the Strouhal number, are manifest in the governing equations of the fluid. For the field of flexible flapping wing aerodynamics, numerous efforts using scaling argu­ments have increased our knowledge of the complex interplay between flexibility and the resulting aerodynamics. However, depending on the type of model and on the governing equations, the resulting set of scaling parameters may vary. For instance, for flexible flapping wings, Shyy et al. [450] considered the flapping wing aeroelas – tic system based on the Navier-Stokes equation coupled with out-of-plane motion

of an isotropic flat plate. Ishihara et al. [451] [452] introduced the Cauchy num­ber that describes the ratio between the fluid dynamic pressure and elastic reaction force from the scaling argument (the Navier-Stokes equation along with the linear isotropic elasticity equations) and presented the correlation between time-averaged lift and the Cauchy number. Thiria and Godoy-Diana [453] and Ramananarivo, Godoy-Diana, and Thiria [454] introduced the elastoinertial number, using scaling arguments to define the ratio between the inertial forces and the elastic restoring forces, and showed the correlation between time-averaged thrust and the elastoin – ertial number, based on flight velocity measurement using a self-propelled flapping flyer with flexible wings in air. Since the density ratio between the air and the wing is high (~O(103)), the elastic deformation of the wing was mostly balanced by the wing inertia. Furthermore, Ramananarivo et al. [454] linked the cubic non-linear damping term due to the aerodynamics to the effects of flexibility in the aerody­namic performance. However, it is very difficult for any one study to cover all of the parameter-space of the flapping flexible wing system in which we are interested. For example, the effects of density ratios on the force generation of flexible flapping wings have not been adequately addressed. Ideally the parameter-space involving the scaling parameters for the fluid-structure interactions should be mapped out in a systematic fashion to understand the impact of flexibility and the density ratio on the force generation and propulsive efficiency of coupled systems. However, as is shown next, the number of dimensionless (scaling) parameters involved is large, making it practically impossible to examine all combinations. Consequently, insight is needed so that efforts can be directed toward creating a suitable combination of these scaling parameters.

We considered the relevant physical quantities related to the system of flexible flapping wing fluid dynamics proposed in Shyy et al. [450] [455] and Kang et al. [351]. There are 13 variables (see Figure 3.5a): the density, p, and the viscosity, л, of the fluid; the reference velocity, Uref, of the fluid flow field; the half-span, R, the mean chord, cm, and the thickness, hs, of the wing geometry; the density, ps, the Young’s modulus, E, and the Poisson’s ratio, v, of the wing structure; the flapping (plunging) amplitude, фа (ha), the flapping frequency, f, and the geometric AoA, a; and finally the resulting aerodynamic force, F. Three fundamental dimensions lead to 10 non-dimensional parameters. With p, Uref, and cm as the basis variables to independently span the fundamental dimensions, the dimensional analysis leads to the non-dimensional parameters shown in Table 4.2. The resulting set of non­dimensional parameters includes most of the well-known parameters in the flapping wing aerodynamics community; however, there are other sets of non-dimensional parameters. More importantly, some of these dimensionless parameters scale with a flyer’s physical dimensions in different ways. As pointed out in Section 1.2, the different scaling relationships between the various dimensionless parameters and size, speed, and other parameters of flapping wings pose fundamental difficulties in utilizing a laboratory model of different sizes: as the physical dimension and speed of a wing change, the scaling parameters vary differently, making it virtually impossible to conduct experiments capable of maintaining dynamic similarity.

Although Table 4.2 offers a complete set of dimensionless parameters based on the dimensional quantities selected, alternative parameters can be derived by combining these dimensionless parameters. For example, the advance ratio J given

Non-dimensional parameter

Symbol

Definition

Note

Reynolds number

Re

PUref cm/d

Aspect ratio

AR

R/cm

Thickness ratio

h*

hs/cm

Density ratio

p

Ps/P

Poisson’s ratio

v

v

П1

Eh*3/{12(1 – v2)pU2f)

plate

Effective stiffness

Eh* 3/{12pU2f}

beam

Eh*/{pUr2f}

membrane wing

Effective pretension

П1,ртй

S0 h*/(pUif)

membrane wing

Effective rotational inertia

П2

IB / (pUref )

Reduced frequency

к

П fcm/(Uref )

Strouhal number

St

faARk/n

flapping

hak/(cmn)

plunging

Effective angle of attack

ae

a + atan(2n St)

plunging

Force coefficient

CF

p/ (2 pUViUR

Table 4.2. List of Non-dimensional parameters for flexible wing aerodynamics

by Eq. (3-14) results from the Strouhal number. Another example is the effective inertia П0 (Eq. 4-24),

П0 = p *h* (k/n)2, (4-24)

which is used frequently later to discuss the scaling of aerodynamic forces of a flexible wing, is a combination of p*, h*, and k. Two other non-dimensional param­eters that prove to be important are the frequency ratio, f/f1, which is the ratio between the motion frequency and the first natural frequency of the wing, and the non-dimensional tip deformation parameter, у, which scales with the aerody­namic performance. The relation between the non-dimensional parameters shown in Table 4.2 and these two parameters is derived in Section 4.5. Furthermore, additional dimensionless parameters arise as the scope of the mechanical system broadens. As discussed by Shyy et al. [450], if an anisotropic shear deformable plate is considered for the wing, an additional dimensionless parameter appears that describes the ratio between rotational inertia forces and aerodynamic forces. This effective rotational inertia parameter П2 is defined as

П2 = Ib/ (pUf, (4-25)

where IB is the mass moment of inertia. The effects of the twist on the aerodynamic performance have been considered many times in the literature [24].

Подпись: P * h* Подпись: ext’ Подпись: (4-26)

The flexible wing structure can be modeled locally as a beam (see Eq. (4-1)) that oscillates in time due to its flexibility under the aerodynamic loading. Following the same non-dimensionalization process as in Chapter 3, Eq. (4-1) becomes

where special care is given in the direction of the wing bending, because the correct length scale for the spanwise bending is the half-span R and not the chord cm. The
correction factor that arises is expressed as (l/cm), where (l/cm) = 1 for the chordwise flexible airfoil case (Section 4.4.2.1) and (l/cm) = AR for the spanwise flexible wing case (Section 4.4.2.2) or isotropic Zimmerman wing case (Section 4.4.2.3) where AR is the aspect ratio of the wing: for the 3D wings the bending motion is aligned with R, so that a factor of AR is required to renormalize the transverse displacement. All non-dimensional parameters appearing in Eq. (4-26) are consistent with the parameters listed in Table 4.2. The effective stiffness П1 = Eh*3/{12 pUr2ef} [450] gives the ratio between the elastic bending forces and the fluid dynamic forces. The equivalent effective stiffness for the plate and membrane can be found easily; that is, Eh*3/{12(1 – v2)pUr2ef} and Eh*7(12pU2ef), respectively. The coefficient of the inertial term in Eq. (4-26), abbreviated as the effective inertia, is П0. Finally, the force coefficient is then given by a to-be-determined relation

CF = Ф(Re, AR, h*, p, П k, St). (4-27)

Hyperelastic Membrane Model

A rubberlike material can be used to cover the rigid skeleton of a MAV design to obtain flexibility of the wing (see Fig. 4.6). The large deformations observed for this kind of material in the Reynolds number range of operation indicate that the linear

elasticity assumption may not be valid. To address this issue, a hyperelastic model to describe the 3D membrane material behavior is employed [162]. The stress-strain curve of a hyperelastic material is non-linear, but follows the same path in loading and unloading (below the plastic limit, which is significantly higher than in metals). Compared with the previously discussed 2D linear model, a 3D membrane model introduces several complicated factors. First, for three-dimensional membranes, the tension is defined as a biaxial tension along the lines of principal stress [436]. Second, the geometric and material properties may vary along the spanwise direction and need to be described in detail. A third factor is membrane compression, leading to wrinkles when one of the principal tensions vanishes. In addition, it is desirable to account for the membrane mass when solving for the dynamic equations of the membrane movement.

A finite element analysis of the static equilibrium of an inflated membrane undergoing large deformations is presented by Oden and Sato [437]. A review of the earlier work on the dynamic analysis of membranes can be found in Jenkins and Leonard [438]. An update of the state-of-the-art models in membrane dynamics is presented by Jenkins [439]. Verron et al. [440] studied, both numerically and experimentally, the dynamic inflation of a rubberlike membrane. Ding et al. [441] numerically studied partially wrinkled membranes.

In a recent effort, Stanford et al. [442] proposed an accurate linear model for 3D membranes used in MAV design. Their experimental measurements showed that the maximum strain value is quite small; therefore they constructed a linear approx­imation of the stress-strain curve, centered about the membrane wing’s prestrain value. The linear constitutive equation used for membrane modeling is Poisson’s equation:

dW d 2w P(X’У) (4—21)

dx2 + dy2 t, ()

where Wis the out-of-plane membrane displacement, p(x, y) is the applied pressure (wing loading, in this case), and T is the membrane tension per unit length. The aerodynamic loads are computed on a rigid wing and fed into the structural model, assuming that the change in shape of the membrane wing did not overtly redistribute the pressure field. They obtained good agreement between the experimental data and computations.

A 3D membrane model was developed by Lian et al. [163]. The model gives good results for membrane dynamics with large deformations, but has limited capability to handle the wrinkle phenomenon that occurs when the membrane is compressed. The membrane material considered obeys the hyperelastic Mooney-Rivlin model [443]. A brief review of their membrane model is given next.

The Mooney-Rivlin model is one of the most frequently employed hyperelas­tic models because of its mathematical simplicity and relatively good accuracy for reasonably large strains (less than 150 percent) [443]. For an initially isotropic mem­brane, Green and Adkins [444] defined a strain energy function, W, as

where Ib I2, and I3 are the first, second, and third invariants of the Green deformation tensor, respectively. More details about the model, its validation, and its numerical implementation can be found in the literature (e. g., [154] [160] [440]).

4.2.1 Flat Plate and Shell Models

A flat 3D wing can be modeled as a plate that allows for spanwise and chordwise bending and twist. For a thin isotropic plate, the small transverse displacement is governed by the classical plate equation,

(4-23)

where W is transverse displacement, ps the density, hs the thickness, E the modulus of elasticity, v the Poisson’s ratio of the wing, and /ext the distributed external force per unit length acting in the vertical direction.

The most general structural class, which includes the previously introduced model, is the shell model. A thin shell is modeled as a curved 2D structure with the in-plane and out-of-plane displacements coupled via its curvature. A shell finite element (FE) can carry bending and membrane forces. With a thin shell FE model, Nakata and Liu [445] investigated the non-linear dynamic response of anisotropic flexible hawkmoth wings flapping in air, and Chimakurthi, Cesnik, and Stanford [446] simulated flapping plate/shell-like wing structures undergoing small strains and large displacements/rotations.

More research is needed to further refine the structural model for the anisotropic, batten-enforced mechanical properties of the highly flexible structures such as wings and to better understand the dynamics of the resulting fluid-structure interactions.

Linear Membrane Model

As an illustration, consider the membrane wing of Figure 4.12, which is shown operating in a free-stream. The analysis of membrane wings begins with the histor­ical works of Voelz [421], Thwaites [422], and Nielsen [423]. These works consider the steady, 2D, irrotational flow over an inextensible membrane with slack. As a consequence of the inextensible assumption and the additional assumptions of small camber and incidence angle, the membrane wing boundary value problem is linearized and may be expressed compactly in non-dimensional integral equation form as

d2 (y/a)

Подпись: (4-2)

Ct f2 df2 d dy/a

2 0 2n(f – x) dx ’

Подпись: є Подпись: Lo c c Подпись: (4-3)

where y(x) defines the membrane profile as a function of the x coordinate, a is the flow incidence angle, Ct is the tension coefficient, and f is the arc length along the membrane wing surface. Equation (4-2) was referred to as the “Thwaites sail equation” by Chambers [424] and simply as the “sail equation” by Greenhalgh et al. [425] and Newman [426]. This equation, together with a dimensionless geometric parameter є, completely defines the linearized theory of an inextensible membrane wing in a steady, inviscid flow field. Parameter є specifies the excess length of an initially flat and taut membrane and is defined as follows:

where L0 is the unstrained length of the membrane and c is the chord length. The meaning of these symbols can be better understood from Figure 4.13.

Different analytical and numerical procedures have been applied to the basic equation set to determine the membrane shape, aerodynamic properties, and mem­brane tension in terms of the AoA and excess length. In particular, Thwaites [422] obtained the eigensolutions of the sail equation that are associated with the wing at an ideal angle of incidence. Nielsen [423] obtained solutions to the same equation using a Fourier series approach that is valid for wings at angles of incidence other than the ideal angle. Other more recent but similar works are those by Greenhalgh

Figure 4.13. Leading edge constrained elastic membrane.

et al. [425], Sugimoto and Sato [427], and Vanden-Broeck and Keller [428]. Vari­ous extensions of the linear theory have appeared in the literature over the years. Vanden-Broeck [429] and Murai and Maruyama [430] developed non-linear theories valid for large camber and incidence angle. The effect of elasticity has been included in the membrane wing theories of Jackson [431] and Sneyd [432], and Murata and Tanaka [433] investigated the effects of membrane porosity. In a paper by de Matteis and de Socio [434], experimentally determined separation points were used to mod­ify the lifting potential flow problem in an attempt to model flow separation near the trailing edge. A comprehensive review of the work published before 1987 related to membrane wing aerodynamics is given by Newman [426].

The extent of agreement between the various potential flow-based membrane wing theories and experimental data has been reported by several authors, includ­ing Greenhalgh et al. [425], Sugimoto and Sato [427], and Newman and Low [141]. In general, there has been considerable discrepancy between the measurements made by different authors [431], which have all been in the turbulent flow regime at Reynolds numbers between 105 and 106. As a result of the discrepancies in the reported data, primarily due to differences in Reynolds number and exper­imental procedure, the agreement between the potential-based membrane theo­ries and the data has been mixed. In particular, the measured lift is in fair agree­ment with the predicted value when the excess length ratio is less than 0.01 and the AoA is less than 5°. However, even for this restricted range of values, the measured tension is significantly less than that predicted by theory. Furthermore, for larger excess lengths and incidence angles the theory poorly predicts lift and tension.

The main reason for the disagreement is the existence of the viscous effect, which significantly affects the force distribution on the wing and therefore the effec­tive shape of the wing. To illustrate the flexible structural dynamics in response to aerodynamic forces, consider equilibrium equations for a 2D elastic membrane subjected to both normal and shearing stresses. As discussed by Shyy et al. [417], the membrane is considered to be massless, and the equilibrium conditions are stated in terms of the instantaneous spatial Cartesian coordinates and the body – fitted curvilinear coordinates. The basic formulation is essentially identical to many previously published works such as de Matteis and de Socio [434] and Sneyd [432].

Figure 4.13 illustrates an elastic membrane restrained at the leading and trail­ing edges and subjected to both normal and tangential surface tractions p and т,

respectively. Imposing equilibrium in the normal and tangential directions requires that

Подпись: (4-4)fy (dy2 3/2 = _Ap

dx2 dx y

Подпись:(4-5)

where y is the membrane tension. Equation (4-4) is the Young-Laplace equation cast in Cartesian coordinates. The net pressure and shear stress acting on a segment of the membrane are given, respectively, by

^3

II

1

1

+

(4-6)

T = T — T + ■

(4-7)

where the superscripts + and – indicate the values at the upper and lower surfaces of the membrane, as shown in the figure. If the membrane material is assumed to be linearly elastic, the nominal membrane tension Y may be written in terms of the nominal membrane strain S as

Подпись: (4-8)Y = (S0 + ES)hs,

where S0 is the membrane prestress, E is the elastic modulus, and hs is the membrane thickness. The nominal membrane strain is given by

S = L – Lo, (4-9)

Lo

where L0 is the unstrained length of the membrane and L is the length of the mem­brane after deformation, which may be expressed in terms of the spatial Cartesian coordinates as

Подпись: (4-10)L=L 1+{%)dx■

where c is the chord length.

The aeroelastic boundary value problem can be written in non-dimensional form after introducing the following dimensionless variables:

x

x = ■ c

(4-11)

y=c

(4-12)

p _ p

pUref q«>

(4-13)

Y

h, 0r Y = Ehs ■

(4-14)

P =

where Eq. (4-14) is used to non-dimensionalize the membrane tension depending on whether the tension is dominated by pretension or by elastic strain. The resulting
dimensionless equilibrium equation when membrane tension is dominated by elastic strain is

Подпись: (4-15)/ 2 -3/2 d2f Л (df\ = __L AP

dx*2 dx* П1 у * ’

Подпись: П Подпись: Ehs q^c' Подпись: (4-16)

with П1 the effective stiffness parameter, defined to be

When membrane tension is dominated by pretension, Eq. (4-4) leads to the following dimensionless equation:

Подпись:dV 1, (dy*2 -3/2 =_____________ L_ AP

dx*2 dx* n1pret Y *

Подпись: n1’pret Подпись: SOhs q^c Подпись: (4-18)

with the effective pretension, П1 t defined to be

If the two ends of a 2D membrane are fixed, the boundary conditions in dimensionless form are

Подпись: (4-19)y* = 0 at x* = 0 and 1.

Подпись: S0 5 Ehs + c Подпись: sin (в)’ Подпись: (4-20)

Regarding the physical significance of the aeroelastic parameters П1 and n1pret we note that the dimensionless deformation of an initially flat elastic membrane is inversely proportional to П1 in the absence of pretension. The dimensionless deformation of a membrane is inversely proportional to Щ ret in the presence of large initial pretension. Consequently, the steady-state, inviscid aeroelastic response of an initially flat membrane wing at a specified AoA is controlled exclusively by П1 in the limit of vanishing pretension, and exclusively by Щ ret in the limit of vanishing material stiffness. Similarly Song et al. [435] also presented a theoretical model for membrane camber due to aerodynamic loading and showed an expression for non-dimensional aerodynamic loading, expressed as a Weber number, We:

where в is the contact angles at the leading and trailing edges (Fig. 4.13).

This scaling analysis is based on a massless structure. If the airfoil mass is consid­ered, then the inertia scaling needs to be considered. Between the elastic and inertia scaling, one can also deduce the structural natural frequency.

Linear Beam Model

Подпись: (4-1)

Linear beam theory is a well-known simplification of the linear theory of elasticity for the structures that can be regarded as largely one-dimensional whose widths are small compared with their lengths. It relates the deflections of a beam, which are assumed to be small, to the transverse loads. For a dynamic linear beam, the transverse deflection w(x, t) is given by the Euler-Bernoulli beam equation as

where ps is the density of the wing, hs the thickness of the wing, E the modulus of elasticity, and fext the distributed external force per unit length acting in vertical direction. Uniform wing properties are assumed in Eq. (4-1). The linear beam theory has been widely used in the aeroelastic community to model and study the dynamic structural response and stability of the wing of an airplane [333].