Category Dynamics of. Atmospheric Flight

DESCRIBING FUNCTION

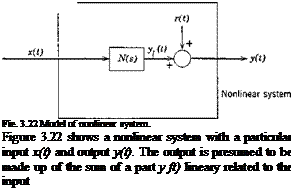
Подпись: Fie. 3.22 Model of nonlinear system. Figure 3.22 shows a nonlinear system with a particular input x(t) and output y(t). The output is presumed to be made up of the sum of a part у ft) lineary related to the input

In the simplest terms, a describing function of a system is a transfer function that linearly connects an input/output pair approximately—i. e. it provides a linear approximation to the actual system that is best in a certain sense.

Подпись: (3.5,1)Vi(s) = N{s)x(s)

and a remnant r(t) that makes up the difference. Clearly, if r(t) is “small” enough compared to y(t), then у ft) provides a useful evaluation of the system performance. When an appropriate measure of r(t) is minimized, N(s) becomes the corresponding describing function. For transient inputs, a suitable measure would be J r2 dt; for steady-state inputs, periodic or sto­chastic (the usual case treated), r2 is the quantity minimized. It is seen that a different describing function is obtained for every input to a given system—i. e. the describing function, unlike the transfer function of a linear system, is a function of the input.

TIME-VARYING AND NONLINEAR SYSTEMS

In the preceding sections we have presented the methods for analysis of linear/invariant systems. These systems are the simplest kind and the methods of analysis are in effect omnipotent, in that in principle they provide complete exact solutions for all such systems. Only sheer size provides limits to practical computation.

On the other hand, linear time-varying systems (linear systems with non­constant coefficients) and nonlinear systems present no such comfortable picture. Their characteristics are not simply classified and there are no general methods comparable in power to those of linear analysis. In the aerospace field, nonlinearities and time variation occur in several ways. The fundamental dynamical equations (see Chapter 6) are nonlinear in the inertia terms and in the kinematical variables. The external forces, especially the aerodynamic ones, may contain inherent nonlinearities. When the flight path is a transient, as in reentry, rocket launch, or a landing flare, the aero­dynamic coefficients are time-varying as well. In the automatic and powered control systems so widely used in aerospace vehicles, there commonly occur nonlinear control elements such as limiters, switches, dead-bands, and others. Finally, the human pilot, actively present in most flight-control situations, is the ultimate in time-varying nonlinear systems (see Chapter 12).

Although completely general methods, apart from machine computation of course, are not available for analyzing the performance and stability of time-varying and nonlinear systems, there are nevertheless many important particular methods suitable for particular classes of problems. This subject is much too large for a comprehensive treatment here. The reader is referred to refs. 3.8-3.10 for treatises devoted to the subject.

It should be pointed out that even when a flight vehicle system is essentially nonlinear, much may be learned about it by first carrying out a linear analysis of small disturbances from a reference steady state or reference transient. This normally provides a good base from which to extend the analysis to
include nonlinear effects, as well as a limiting check “point” for subsequent computation and analysis. Of the particular methods available for studying nonlinear systems, we consider two sufficiently relevant to flight dynamics to present brief introductions to them below.

. RESPONSE TO A SET OF STATIONARY RANDOM INPUTS

Подпись: Xi(t) . RESPONSE TO A SET OF STATIONARY RANDOM INPUTS Подпись: -О Подпись: y(t)

We now consider the case when the system response is a sum of responses to a set of random inputs. An example of this situation is the roll response of an airplane flying through a turbulent atmosphere, when there is a multiple input associated with the three components of the atmospheric motion, each contributing to the output via a different transfer function. Figure 3.21 shows an example in which a number of inputs combine to form a single out­put. More generally, for n inputs and m outputs related by an (m x n)

Fig. 3.21 Response to a set of random inputs.

transfer function matrix G(.s)

f(s) = G(.s)x(s)

By virtue of (3.2,2a) the transfer function matrix likewise connects the Fourier transforms of the inputs and outputs,

Y(m) = G(ico)X((») (a) (3.4,46)

or with reference to truncated functions, see (2.6,19),

Y(со; T) = G(*w)X(ft>; T) (b)

Now the cross-spectral density of two components (yi and yfl of у is given by

Подпись: = lim Подпись: ¥*(а>;Т)¥,(со;Т) Подпись: (3.4,47)

(2.6,22)

The matrix of Ф,, „ is therefore

Уг *з

Фу = lim — Y*(co; T)YT((o; T)

y-oo 4cT

= lim — [G(wo)X(co; T)]*[G(io>)X(o); T)]T т->ж 4:T

= lim — G*(ico)X*(co;T)XT(co; T)GT{iw) У->оо 4:T

Подпись: = G*(*co)

Подпись: or Подпись: Ф» = Подпись: (3.4,48)

lim — X*(«; T)XT(w; T) 1 GT(im) y-oo 4T

From (3.4,48) it follows that the power spectral density of yt (a diagonal element of Фу) is

Ф, ЛМ =22 (3-4,49)

fc=l 1=1

and that if the input cross spectra are zero

ФздМ = І І^МІ*ф^ю) (3.4,60)

к=1

This is a very important result for application to flight dynamics since it provides a way of calculating the output power spectral density from a knowledge of all the input cross spectra and the relevant transfer functions. An important special case is that in which there is only one input, x(t) and one output, y(t). Then (3.4,50) reduces to

Подпись: (3.4,51)Ф„(«) = |£(»<у)12ФетМ

This is the most commonly used input/output relation for random processes. It will be recalled (see Sec. 2.6) that most of the interesting probability properties of y(t) can be deduced from Ф„(«).

A USEFUL THEOREM CONCERNING MEAN-SQUARE RESPONSE

In some calculations, it is not required to have the spectrum of the output, its mean-square value being all the information wanted. In such cases the desired result may be obtained more simply than by first calculating Фуу and then integrating it. The method is given in ref. 3.12 for single and dual inputs. We present below only the theorem for a single input.

Let the system, with transfer function G(s), be subjected to a transient input x(t), with corresponding transient output y(t). The integral square of the output is given by Parseval’s theorem (see ref. 2.4, Sec. 120).

Л 00 1 Л 00

E = y2(t)dt = — Y*(a>)Y(a>) day (3.4,52)

Jo 277 J-oo

where Y(a>) is the Fourier transform of y(t). Now the Fourier transform of the output is given by (3.2,2a) as

Y(o>) = G(iw)X(m)

and hence

E = — f” G(ia))G*(ico)X((o)X*(a>) dco 277 J—oo

1 Л00

= — G(ico)*X(co)2dco (3.4,53)

277 J—oo

Now we also have from (3.4,51) that if the input is a random function, the mean-square output is

__ Л 00

Уг = фет(«>) d°>

J—OO

=J G(ia))2<&xx(co)d<o (3.4,54)

By comparing (3.4,53) and (3.4,54), we see that у2 = E if

2т7фет(ю) = |X(o)|2 (3.4,55)

That is, if one can find a transient x(t) whose Fourier transform is related by (3.4,55) to the power spectrum of the given random function, then y2 can be calculated from the output of the transient. This may prove to be a much easier and more economical computation, whether an analog or digital com­puter is used. In particular, for spectrum functions like those of atmospheric
turbulence (the “Dryden” spectra) the following are suitable transients:

Подпись:Equivalent transient x(t)

Ае~Уг (3.4,66)

Подпись:277 (a2 + <x>2)2

The advantages for analog computation are that no random function generator is needed, and that the computation using a single transient input takes much less time.

SUPERPOSITION THEOREM (CONVOLUTION INTEGRAL, DUHAMEL’S INTEGRAL)

The theorem of this section facilitates the calculation of transient responses of linear systems to complicated forcing functions. The general response appears as the superposition of responses to a sequence of steps or impulses which simulate the actual forcing function.

Let Xj(s) be the transform of xft)

Подпись: andx2(s) be the transform of x2(t)

Then the function x3(t) whose transform is the product x3 = XjX2 is

Подпись: (3.4,38)x3{t) = Г xfr)x2(t — t) dr

Подпись:Jt=0

/*00 /*00 x3 = e~suxflu) du X e~svx2(v) dv Jo Jo where и and v are dummy variables of integration. This is equivalent to the double integral

x3(s) = JJ*e~s(u+v)xl(u)x2(v) du dv s

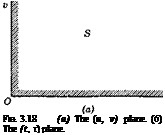
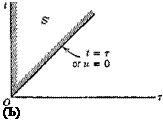
Подпись: FIG. 3.18 (a) The (и, v) plane. (6) The (t, T) plane. Подпись: (Ъ)

where 8 is the area of integration shown in Fig. 3.18a. Now let the region of

integration be transformed into the t, т plane by the substitution

U + V = t V = T

Подпись: Thenx3(s) = Jj’e~sixft — т)ж2(т) dS’

S’

where S’ is the region shown in Fig. 3.186. Integration first with respect to

T §iVeS ЛОО M

x3(s) = e~st dt xflt — t)x2(t) dr Jt=o Jr=о

Therefore, by definition (2.3,7)

Подпись:rt

Q. E.D.

SUPERPOSITION THEOREM (CONVOLUTION INTEGRAL, DUHAMEL’S INTEGRAL) Подпись: (a) (b) SUPERPOSITION THEOREM (CONVOLUTION INTEGRAL, DUHAMEL’S INTEGRAL)

We now apply this result when the system G{s) is subjected to an arbitrary input x(t). The response is given by

The preceding equation applies to a single input/output pair. For a multi­variable system we would obviously have as the extension of (3.4,40a) (and similarly for 3.4,406)

Vi(t) =

f 2 M* — t)xAt) dr

(a)

} t—0 з

(3.4,41)

or

у (<) =

I H(t — t)x(t) dr Jr=0

(b)

where H is the rectangular matrix of impulse response functions.

By considering a slightly modified form of (3.4,39) we can obtain a com­panion result involving srf(t) instead of h(t). We may write (see 3.4,186)

y(s) = ^ • sx(s)
s

= s#(s){£P[x + ж(0)}

= s&(s) Л?[х] + stf{s)x{ 0)

Again applying (3.4,38) we get

Подпись:y(t) = j</(t)x(0) + Г stf(t — t)x(t) dr (a) Jr=о

or y(t) = stf(t)x{0) + Г s/(r)x(t — t) dr (6)

Jr=0

As with the impulse response, the matrix form of (3.4,42a) for example, for a multivariable system, is

У(<) = **Z(t)x(0) + Г — t)x(t) dr (3.4,43)

Jr= о

SOLUTION INCLUDING INITIAL CONDITIONS

The general solution of (3.2,21) for arbitrary y(0) and arbitrary x(t) is obtained by superposition of the complementary function (3.4,17) and the “particular integral” (3.4,41 or 43). Thus in general

Подпись: y(f) = H(«)C-1y(0) +Подпись: T)X(T) drSUPERPOSITION THEOREM (CONVOLUTION INTEGRAL, DUHAMEL’S INTEGRAL)(3.4,44)

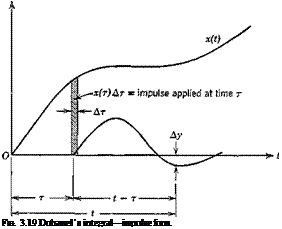
The physical significance of (3.4,40a) and (3.4,42a) for example is brought out by considering them in the one-dimensional case as the limits of the following sums

y(t) = ^h(t~ t)x(t) At (a)

y(t) = stf(t)x{0) — t)x(t) At (b) (3.4,46)

Подпись: FIG. 3.19 Duhamel’s integral—impulse form.

Typical terms of the summations are illustrated on Figs. 3.19 and 3.20. The summation forms are quite convenient for computation, especially when the interval At is kept constant.

FREQUENCY RESPONSE OF FIRST-ORDER SYSTEM

The first-order transfer function, written in terms of the time constant T

FREQUENCY RESPONSE OF FIRST-ORDER SYSTEM

(3.4,28)


100


1.0


Подпись: <p, degrees
Подпись: Phase angle, <p° 20 log 10 M, db

Fig. 3.14 Frequency-response curves—first-order system.


FREQUENCY RESPONSE OF FIRST-ORDER SYSTEM

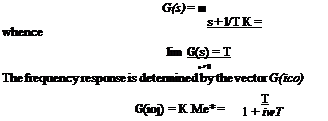
Подпись: Же’'» Подпись: 1 — icoT 1 + (o2T2 Подпись: (3.4,29)

84 Dynamics о/ atmospheric flight whence

From (3.4,29), M and cp are found to be

Подпись: M =Подпись: (3.4,30)1

(1 + a? T*fA

— cp = tan-1 cqT

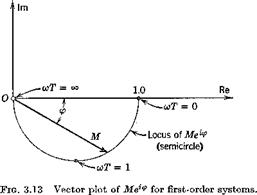
A vector plot of Meiv is shown in Fig. 3.13. This kind of diagram is sometimes called the transfer-function locus. Plots of M and <p are given in Figs. 3.14a and b. The abscissa is fT or log wT where / = <ы/2я-, the input frequency. This is the only parameter of the equations, and so the curves are applicable to all first-order systems. It should be noted that at to = 0, M = 1 and cp = 0. This is always true because of the definitions of К and G(s)—it can be seen from (3.2,4) that G(0) = K.

FREQUENCY RESPONSE OF A SECOND-ORDER SYSTEM

The transfer function of a second-order system is given in (3.4,11). The frequency-response vector is therefore

Подпись:Mei<p — ————- ^————–

(<ми2 — со2) + 2i£conco

FREQUENCY RESPONSE OF FIRST-ORDER SYSTEM Подпись: (3.4,32)

From the modulus and argument of (3.4,31), we find that

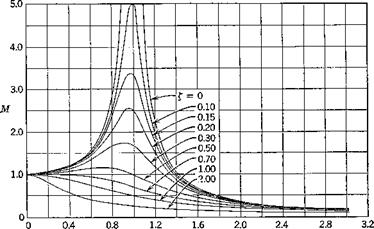
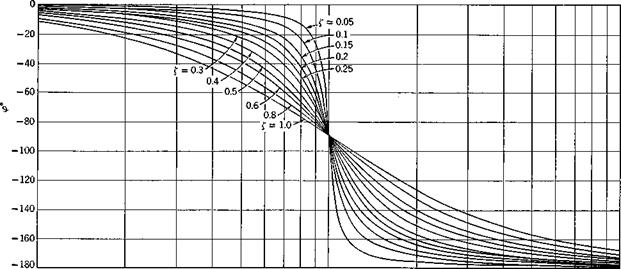
A representative vector plot of Me*9, for damping ratio £ == 0.4, is shown in Fig. 3.15, and families of M and cp are shown in Figs. 3.16 and 3.17. Whereas a single pair of curves serves to define the frequency response of all first – order systems (Fig. 3.14), it takes two families of curves, with the damping ratio as parameter, to display the characteristics of all second-order systems. The importance of the damping as a parameter should be noted. It is especially powerful in controlling the magnitude of the resonance peak which occurs near unity frequency ratio. At this frequency the phase lag is by contrast independent of £, as all the curves pass through cp = —90° there. For all values of £, M -> 1 and cp —> 0 as ojjojn —► 0. This shows that, whenever a system is driven by an oscillatory input whose frequency is low compared to

FREQUENCY RESPONSE OF FIRST-ORDER SYSTEM

Fig. 3.15 Vector plot of Mei(f> for second-order system. Damping ratio £ = 0.4.

FREQUENCY RESPONSE OF FIRST-ORDER SYSTEM

Fig. 3.16 Frequency-response curves—second-order system.

FREQUENCY RESPONSE OF FIRST-ORDER SYSTEM

0.1 0.2 0.3 0.4 0.5 0.6 0.8 1.0 2 3 4 5 6 8 10

0)/0!п

(а)

Подпись: Phase angle,
FREQUENCY RESPONSE OF FIRST-ORDER SYSTEM

FREQUENCY RESPONSE OF FIRST-ORDER SYSTEM

Fig. 3.17 Frequency-response curves—second-order system.

oo

■vl


the undamped natural frequency, the response will he quasistalic. That is, at each instant, the output will be the same as though the instantaneous value of the input were applied statically.

The behavior of the output when £ is near 0.7 is interesting. For this value of £, it is seen that <p is very nearly linear with o)jo>n up to 1.0. Now the phase lag can be interpreted as a time lag, r = (<р/2тт)Т = (p/a> where T is the period. The output wave form will have its peaks retarded by т sec relative to the input. For the value of £ under consideration, q>l(cojwn) == 7t/2 or g>/ei> = 7г/2соп = Tn, where Tn = 27г/соп, the undamped natural period. Hence we find that, for £ = 7, there is a nearly constant time lag т == Tn, independent of the input frequency, for frequencies below resonance.

The “chain” concept of higher-order systems is especially helpful in re­lation to frequency response. It is evident that the phase changes through the individual elements are simply additive, so that higher-order systems tend to be characterized by greater phase lags than low-order ones. Also the individual amplitude ratios of the elements are multiplied to form the overall ratio. More explicitly, let

G(s) == G^s) • G2(s) • • • Gn(s) be the overall transfer function of n elements. Then G(ico) — Gflico) ■ G2(ico) ■ • ■ GJico)

= • KM., ■ • • KnMn)e*9

= KMM

so that KM = XT KrMr (a)

Подпись: (3.4,33)r=1

<p = 2 Vr (b)

r=l

On logarithmic plots (Bode diagrams) we note that

log KM = 2 log KTMr (3.4,34)

r=1

Thus the log of the overall gain is obtained as a sum of the logs of the com­ponent gains, and this fact, together with the companion result for phase angle (3.4,33) greatly facilitates graphical methods of analysis and system design.

RELATION BETWEEN IMPULSE RESPONSE AND FREQUENCY RESPONSE

We saw earlier (3.4,7), that h(t) is the inverse Fourier transform of G(ia>), which we can now identify as the frequency response vector. The reciprocal

Fourier transform relation then gives

G(ico) = {Xh(t)e-i0>tdt (3.4,35)

J—00

i. e. the frequency response and impulsive admittance are a Fourier transform pair.

An alternative to (3.4,7) that involves the integration of a real variable over only positive со can be derived from the properties of h(t) and G(im). Since со is always preceded by the factor і in G(im), it follows that G*(im) — G(—im) where ( )* denotes the complex conjugate. Hence

1 Г® If00

h(t) = — eiatG(im) dm = — I [eiatG(im) + e-iatG*(ko)] dm 277 f—oo 277 Jo

= f^M{m)e^ + е~ішіЖ(о7)е-^<и)| dm

= — Г М{еіШ+ч>) + e"<(m<+*>} dm 277 Jo

К f°°

— — M cos (mt + cp) dm 77 Jo

If” К f00 . .

= — M cos mt cos cp dm———- M sin mt sin cp dm (3.4,36)

77 Jo 77 Jo

Since h(t) = 0 for t < 0, then the second term on the r. h.s. of (3.4,36) is equal to the first term for t < 0. But the second term is an odd function of t whereas the first is even. Hence the two terms are equal and opposite for t < 0 and equal for t > 0. Thus

2 C00

h(t) = — К l M(m) cos q>(m) • cos mt dm (3.4,37)

77 Jo

which is the desired result.
EFFECT OF POLES AND ZEROS ON FREQUENCY RESPONSE

We have seen (3.4,2) that the transfer function of a linear/invariant system is a ratio of two polynomials in s, the denominator being the char­acteristic polynomial. The roots of the characteristic equation are the poles of the transfer function, and the roots of the numerator polynomial are its zeros. Whenever a pair of complex poles or zeros lies close to the imaginary axis, a characteristic peak or valley occurs in the amplitude of the frequency – response curve together with a rapid change of phase angle at the corre­sponding value of со. Several examples of this phenomenon are to be seen in the frequency response curves in Figs. 10.3, 10.11, and 10.12. The reason for
this behavior is readily appreciated by putting (3.4,2) in the following form:

G(s) = (д ~ gi) • (a – г2) ~ • • (s – g J (s — Яі) • (« — Я2) • • • (« — Яв)

where the Яг are the characteristic roots (poles) and the zt are the zeros of G(s). Let

(s – Zj.) = рке**

(s – Я*) = гке*^

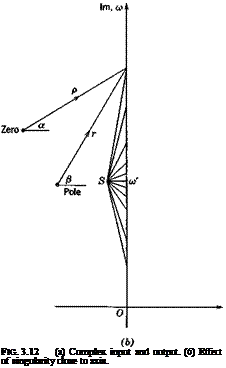
where p, r, а, (і are the distances and angles shown in Fig. 3.126 for a point s = io) on the imaginary axis. Then

|^| — IT Pfc/П rk

k=1 / fc=l

m n

9 = 2 a* – 2 ft

і i

When the singularity is close to the axis, with imaginary coordinate ш as illustrated for point S on Fig. 3.126, we see that as w passes through a>’, a sharp minimum occurs in p or r, as the case may be, and the angle a or /3 increases rapidly through approximately 180°. Thus we have the following cases:

1. For a pole, in the left half-plane, there results a peak in G and a re­duction in <p of about 180°.

2. For a zero in the left half-plane, there is a valley in |Cr| and an increase in <p of about 180°.

3. For a zero in the right half-plane, there is a valley in |Cr[ and a decrease in cp of about 180°.

FREQUENCY RESPONSE

When a stable linear/invariant system has a sinusoidal input, then after some time the transients associated with the starting conditions die out, and there remains only a steady-state sinusoidal response at the same frequency as that of the input. Its amplitude and phase are generally different from those of the input, however, and the expression of these differences is embodied in the frequency-response function.

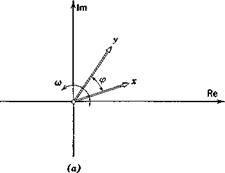
Consider a single input/output pair, and let the input be the sinusoid cos cot. We find it convenient to replace this by the complex expression x = Aof which ar cos cot is the real part. A2 is known as the complex amplitude of the wave. The output sinusoid can be respresented by a similar expression, у = A2e’mt, the real part of which is the physical output. As usual, x and у are interpreted as rotating vectors whose projections on the real axis give the relevant physical variables (see Fig. 3.12a).

FREQUENCY RESPONSE

Подпись: FIG. 3.12 (a) Complex input and output. (6) Effect of singularity close to axis.

From Table 2.3, item 8, the transform of x is

_ Ал


FREQUENCY RESPONSE
FREQUENCY RESPONSE

(3,4.23)


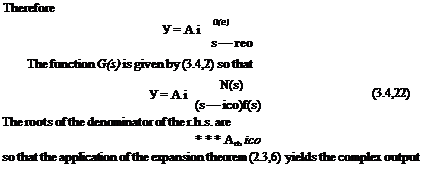
Since we have stipulated that the system is stable, all the roots Xx • • • Xn of the characteristic equation have negative real parts. Therefore el, t —> 0 as t —>■ oo, and the steady-state periodic solution is


FREQUENCY RESPONSE

f oo


y(t) = A1G(iw)eiat = А2еш

Thus

A 2 = AjGiico)

(3.4,24)

is the complex amplitude of the output, or

G{iw) = ^

А і

(3.4,25)

the frequency response function, is the ratio of the complex amplitudes. In general, G(ico) is a complex number, varying with the circular frequency со. Let it be given in polar form by


where К is the static gain (3.2,4). Then

^ = KMe* (3.4,27)

A

From (3.4,27) we see that the amplitude ratio of the steady-state output to the input is AJA-jj = KM: i. e. that the output amplitude is a2 = KMax, and that the phase relation is as shown on Fig. 3.12. The output leads the input by the angle <p. The quantity M, which is the modulus of G(ico) divided by K, we call the magnification factor, or dynamic gain, and the product KM we call the total gain. It is important to note that M and g> are frequency – dependent.

FREQUENCY RESPONSE

Graphical representations of the frequency response commonly take the form of either vector plots of Mei<f (Nyquist diagram) or plots of M and <p as functions of frequency (Bode diagram). Examples of these are shown in Figs. 3.13 to 3.17.

RELATION BETWEEN IMPULSE RESPONSE AND AUTONOMOUS SOLUTION

It follows from (3.4,5a) that the matrix of impulse response functions H = [7i. w] is related to that of the transfer functions by

H(s) = G(s) (3.4,14)

Furthermore, from (3.2,23) we have that G(s) = B_1(s)C, so that

H(s) = B-!(s)C (3.4,15)

or B-!(s) = ЇВДС-1 (3.4,16)

Now in the autonomous case we have (3.3,4)

Подпись: or Подпись: y(s) =H(6')C-iy(0) У (t) = H(«)C-iy(0) Подпись: (3.4,17)

Substitution of (3.4,16) into (3.3,4) yields the result for the autonomous solution with initial condition y(0), i. e.

STEP-FUNCTION RESPONSE

This is like the impulse response treated above except that the input is the unit step function 1(1), with transform 1/s. The response in this case is called the indicial admittance, and is denoted It follows then that

= адї(«) = —

s

(a)

(3.4,18)

or

(b)

Since the initial values (at t = 0~) of hi}(t) and are both zero, the

Подпись: or RELATION BETWEEN IMPULSE RESPONSE AND AUTONOMOUS SOLUTION Подпись: (®) (b) Подпись: (3.4,19)

theorem (2.3,16) shows that

Thus can be found either by direct inversion of (3.4,186) (see examples

in Sec. 2.5) or by integration of By either method the results for first – and second-order systems are readily obtained, and are as follows (for a single input/output pair the indicial subscript is dropped) :

First-order system:

s/(t) = T( 1 – e~t/T) (3.4,20)

Second-order system:

Подпись: ^(t) = — COn1 — en<(eos cot — — sin a)t)l, £ < 1 (3.4,21)

со J

and for £ > 1, s/(t) is given by the r. h.s. of (2.5,5).

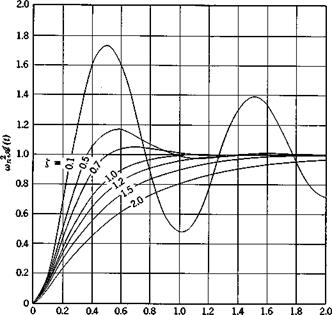
Graphs of the indicial responses are given in Figs. 3.96 and 3.11.

RELATION BETWEEN IMPULSE RESPONSE AND AUTONOMOUS SOLUTION

o>nt/2w

Fig. 3.11 Indicial admittance of second-order systems.

INTERPRETATION OF HIGH-ORDER SYSTEM AS A CHAIN

The transfer function for any selected input/output pair can be found as an element of G given by (3.2,23), i. e.

G = B-!C

where В = si — A, as in Sec. 3.3 and A and C are the constant matrices that define the system. In view of the definition of the inverse matrix we see that G is given by

G = C (3.4,1)

where/(s) is the characteristic polynomial (3.3,7). As already pointed out in Sec. 3.3 the elements of adj В are also polynomials in s. It follows from (3.4,1) and (3.3,7) that each element of G is of the form

Подпись: (3.4,2)_________ Щ*)________

(« – *l)(« -*,)•••(«- К)

where N(s) is some polynomial. Now some of the eigenvalues Xr are real, but others occur in complex pairs, so to obtain a product of factors containing only real numbers we rewrite the denominator thus

m 14(n+m)

/(«) = П(«- K) IT (s2 + ars + br) (3.4,3)

r—1 r=m+1

Here Xr are the m real roots off (s) and the quadratic factors with real co­efficients ar and br produce the (n — m) complex roots. It is then clearly

evident that the transfer function (3.4,2) is also the overall transfer function of the fictitious system made up of the series of elements shown in Fig. 3.8. The leading component N(s) is of course particular to the system, but all the remaining ones are of one or other of two simple kinds. These two, first-order components and second-order components, may therefore he regarded as the basic building blocks of linear/invariant systems. It is for this reason that it is important to understand their characteristics well—the

INTERPRETATION OF HIGH-ORDER SYSTEM AS A CHAIN

m first-order 1/2 (n – m) second-order components

components

Fig. 3.8 High-order system as a “chain.”

properties of all higher-order systems can be inferred directly from those of these two basic elements.

IMPULSE RESPONSE

The system is specified to he initially quiescent and at time zero is sub­jected to a single impulsive input

*,(<) = Щ (3.4,4)

The Laplace transform of the ith component of the output is then

Vi(s) = Gu(s) $(s)

which, from Table 2.3, item 1, becomes

Vi(s) = Gds)

This response to the unit impulse is called the impulsive admittance and is denoted Лг7(/). It follows that

M«) = Gu(s) («)

i. e. G(s) is the Laplace transform of h(t)

w <3-4’5)

From the inversion theorem, (2.3,8) is then given by hi(t) = fG{j(s)estds

27n Jc

Now if the system is stable, all the poles of Gtj(s) lie in the left half of the s plane, and this is the usual case of interest. The line integral of (3.4,6) can then be taken on the imaginary axis, s = ico, so that (3.4,6) leads to

Подпись: (3.4,7)1 f00

*«(*) = ;r e’at°o(^) dm 2iTT J—oo

i. e. it is the inverse Fourier transform of G{j(ico). The significance of Gu(ico) will be seen later.

For a first-order component with eigenvalue A the differential equation is

у — Xy = x (3.4,8)

for which we easily get

G(s) = h(s) = —(3.4,9) s — A

The inverse is found directly from item 8 of Table 2.3 as

h{t) = eu

For convenience in interpretation, A is frequently written as A = —1/77, where T is termed the time constant of the system. Then

Подпись: (3.4,10)h(t) = e~tlT

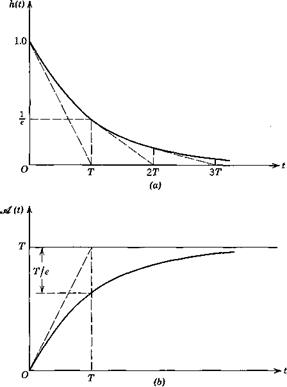
A graph of h(t) is presented in Fig. 3.9a, and shows clearly the significance of the time constant T.

For a second-order system the differential equation is (2.4,1) from which it easily follows that

INTERPRETATION OF HIGH-ORDER SYSTEM AS A CHAIN

(3.4,11)


Let the eigenvalues be A = n 4: ico, (cf. 2.5,2) where

n =

_ со = <ып( 1 — £,2)Vz

then h(s) becomes

h(s) =—————————————-

Подпись:(s — n — ico)(s — n + ico)

– 1

(•s2 — n2) + ft)2

and the inverse is found from item 13, Table 3.3 to be

CO

INTERPRETATION OF HIGH-ORDER SYSTEM AS A CHAIN

Fig. 3.9 Admittances of a first-order system.

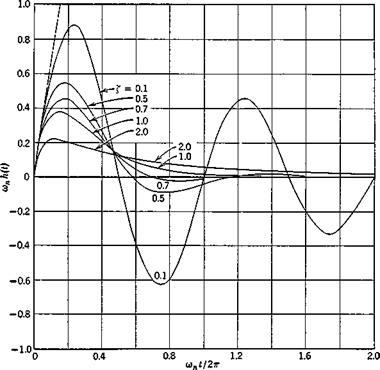
For a stable system n is negative and (3.4,12) describes a damped sinusoid of frequency cc. This is plotted for various £ in Fig. 3.10. Note that the coordinates are so chosen as to lead to a one-parameter family of curves. Actually the above result only applies for £ <: 1. The corresponding ex­pression for £ ;> 1 is easily found by the same method and is

h(t) = ~ ent sinh oj’t (3.4,13)

со

where

m’ = ft>„(£2 – l)1^

Graphs of (3.4,13) are also included in Fig. 3.10, although in this case the second-order representation could be replaced by two first-order elements in

INTERPRETATION OF HIGH-ORDER SYSTEM AS A CHAIN

Fie. 3.10 Impulsive admittance of second-order systems.

RESPONSE OF LINEAR/INVARIANT SYSTEMS

As remarked in Sec. 3.2, one of the basic problems of system analysis is that of calculating the system output for a given input, i. e. its response. This is the problem of nonautonomous performance, in contrast with the

RESPONSE OF LINEAR/INVARIANT SYSTEMS

(1)

RESPONSE OF LINEAR/INVARIANT SYSTEMS

(2)

RESPONSE OF LINEAR/INVARIANT SYSTEMS

RESPONSE OF LINEAR/INVARIANT SYSTEMS

Fig. 3.7 The four basic response problems. (1) Impulse response. (2) Step response. (3) Frequency response. (4) Response to random input.

autonomous behavior treated in the preceding section. The former is associ­ated with nonzero inputs and zero initial conditions, whereas the reverse holds for the latter.

It is evident that the transfer function defined in Sec. 3.2 supplies all that is required for such response calculations—and provided that the input and transfer function are not too complicated, the whole procedure can be carried out analytically, leading to closed-form results. The method, of course, is to calculate the Laplace transform of the input, and then carry out the inverse transformation of y(s) = 0(s)x(s). When this is not practical, it is necessary to resort to machine computation to get answers.

The major response properties of linear/invariant systems can be displayed by considering four basic kinds of input, as illustrated in Fig. 3.7. These are treated individually in the sections that follow. Before proceeding to them, however, we shall first digress to consider a useful interpretation of the transfer functions of high-order systems.