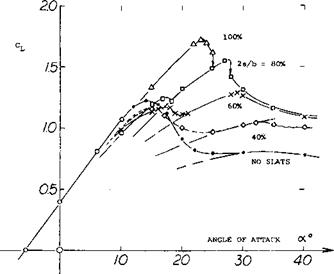
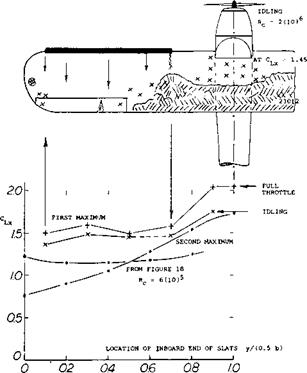
Category FLUID-DYNAMIC LIFT

CHARACTERISTICS OF HYDROFOIL BOATS

Boats, supported by the dynamic lift of hydrofoils, thus “flying” above the water, have been developed over the past 50 or 60 years (19).

THE BENEFITS of lifting the hull out of the water are twofold; most of the impact of sea waves is avoided, and resistance (drag) at higher Froude numbers, is less than that of ordinary displacement and even planing boats. Disregarding cavitation, higher speeds can thus be ob­tained with acceptable power and a minimum of discom­fort for crew and passengers. Not counting experimental boats, the highest continuous speeds reached are still below 40 knots, however, in comparison to some 32 knots as in the transatlantic “United States”, for ex­ample, or some 35 knots in any modern destroyer. There have been two types of boats developed, using either surface-piercing self-stabilizing foils, or fully-submerged and artificially stabilized systems. A few examples are listed in the table.

hydrofoil boat

foil system

A (tons)

/(ft)

ВНР

V(kts)

vK/Af

SupramarPT-20 (24)

surf piercing

28

68

1350

37

20

“Sea Legs”

(23,b)

submerged (o)

5

29

220

26

20

US Navy PCH

(20)

submerged (o)

117

116

6000

40

18

“Raketa”

(19,d)

submerged (•)

2

88

1000

35

21

“Victoria”

(20,d)

submerged (o)

39

65

2000

37

19

Canada“400”

(24,d)

surfpiercing

200

151

20000

50

21

(o) autopilot-controlled

(•) stabilized by planing plates forward

TABLE, listing a number of built and operating hydrofoil boats. The weight (in long tons) is fully loaded, the engine power is maximum continuous installed, the speed is continuous cruising.

SIZE AND SPEED have been discussed in the first chapter. It should be noticed that the sizes of the boats in the table above, are quite small, that is in comparison to ocean-going ships. An equivalent to the Froude num­ber is (Vk/n4). This number is for example:

We have also listed the Froude number in its usual definition. Both numbers show roughly the same ratio. Very instructive is the inverse of the square of the

Froude number, indicating that the loading (in pounds or tons) of the “United States” per square foot (or square meter), say of the plan form or bottom area of the hull, is roughly 20 times as high as that of the hydrofoil boat “Victoria”. This means that for equal speed or dynamic pressure, the hydrofoil area required to lift a ship such as the “United States” out of the water, would be in the order of 2 times its bottom area, in comparison to say 10% of that area in the “Victoria”. Since we need a cer­tain aspect ratio for the foil (or foils) say in the order of A = bVS = 5, for efficiency, the combined span of the “Victoria’s” pair of main foils is roughly equal to the beam, while that of the “United States” would have to be V 20 =4.5 times the beam, which would be some 400 ft (or about 1/2 her length). In order to conform to the square-cube law about which this discussion goes, the speed of the “United States” would have to be in­creased to V = V 20 (32 or 36) kts, which is in the order of 150 kts. This is, of course, impossible. In conclusion, and as explained in (23,c) hydrofoil-supported craft are thus limited to small sizes, where may be in

the order of 20 ; and we see in the table above, how re­markably constant this number is among the boats listed.

MAXIMUM OR DESIGN SPEED У KNOTS

CHARACTERISTICS OF HYDROFOIL BOATS

* SINGLE FOIL SURFACE PIERCING + SUPRAMAR – SURFACE PIERCING) 6 SUBMERGED SURFACE-CONTROLLED о SUBMERGED – SERVO-CONTROLLED

0.1 I 10 100 1000

For points, see (23,c) Along tons

Figure 18. Statistical review of size (displacement weight in long tons) and maximum or design speed of operating or experimental hydrofoil boats (23,c).

If we assume that a number of 30 be the limit in the de­sign of hydrofoil craft, their maximum feasible size would be in the order of 200 long tons for a maximum, hopefully cavitation-free speed of 50 kts. One way of in­creasing the size, is to increase the foil area S in relation to that of the hull (/ 4b’) or (4b’)2 where ‘b’ beam of the hull. Assuming that the boats listed above, have a foil span b = 4b’ (restricted, so that the boats can come along a dock or pier), doubling their span would increase the supporting area, and the permissible ship size (in tons) fourfold. At the same time, the beam of the hull would increase to = 1.26 times the original dimen­sion, so that b/4b’ = 2/1.26 = 1.6. If this is considered acceptable from an operational point of view (24,f) the feasible size of subcavitating hydrofoil boats would be around 800 long tons. Such estimates and a statistical survey of existing or designed craft, are indicated in figure 18.

WAVE PATTERN. Regarding stability and control, the minimum number of foils required is two (as in air­planes), while the struts provide areas for lateral forces in turns and for directional stability and control. Con­sidering the transverse wave system left behind a lifting foil (of larger aspect ratio and shallow submergence as in figure 8), it is theoretically possible to place the second foil at a distance downstream from the forward foil, where it rides so to speak, like a surfboard (but below the surface) somewhat ahead of the first wave crest. To say it in different words, the wave system pro­duced by the second foil would possibly cancel the crests and troughs of the first one. The distance from the lead­ing foil, at which the first crest is located, is 3/4 of the wave length

7’=2irV2/g (28)

and the distance x to the most favorable slope is 1/2 of this length. The corresponding Froude number is

= lMT = 0.56 = Vgx

or equal to 0.5, in an average trochoidal wave (3,b). Locating now the second foil at 1/2 of the wave length behind the first foil, we obtain a distance

x = (ir/g) v2 ^ 0.1 V2 in (ft)

where V in (ft/sec). At this distance the second foil would theoretically be propelled forward with a thrust equal in magnitude to the drag due to lift of the first foil (complete recovery). Considering a boat cruising at 35 knots = 60 ft/sec, the separation required would be x = 0.1 (60)2* = 360 ft. For comparison, the largest boat built to date (the AGH) has a length of 212 ft. Considering now a longer boat at 30 knots, we obtain tentatively x = 265 ft, hull length = 300 ft, but according to figure 18, a maximum displacement weight A ~ 100 long tons. Traditionally, the weight of a 300 ft long ship would be around 2000 tons. In conclusion, wave-drag recovery is not feasible in any practical design. Could it be of in­terest, however, to study the feasibility of “flying” hydro­foil boats in formation?

DOWNWASH. Deeply submerged, a hydrofoil would produce downwash in the same manner as the wing of an airplane. As explained in the “longitudinal” chapter, downwash has two components. The one corresponding to the wing’s circulation reduces quickly with distance from the lifting line at 1/4.of the chord. The other com­ponent is permanent; its maximum angle deep in the water (at the foil level) is

£ = 2 с<1= – 2CL/irA *=« – 36°Cl/A (29)

For A = 5, for example, this angle would be £ = —0.128 = — 7.6°, for C^ = 1. In keeping with the biplane theory, this downwash might be expected to be increased when placing a hydrofoil near the free water surface, in pro­portion to Kj in figure 9. Analysis of towing-tank tests

with tandem pairs of foils (21) reveals a different me­chanism, however. First, consider the downwash relative to the water surface. Assuming that this surface is a solid boundary (a ceiling) the theory of ground effect (see in the “airplane” chapter) suggests a downwash angle

d£°/dCL = – 2 KgdSOVU^A) = – 36 Kg/A (30)

The ground factor (see chapter VII of “Fluid-Dynamic Drag”) can be approximated by

Kg= [30(h/b)3/2]/[30(h/b)3/2+l] (31)

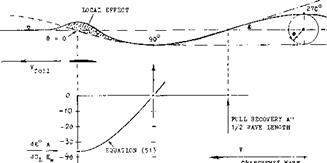
According to this analysis, a hydrofoil produces a larger downwash angle when it is deeper in the water. This is experimentally confirmed (21,a) at the location below the first trough (where the wave angle as in figure 19, is zero).

CHARACTERISTICS OF HYDROFOIL BOATS

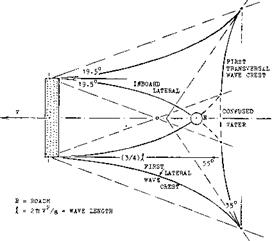
Figure 19. Wave pattern and downwash angle behind a submerged lifting hydrofoil. The wave amplitudes are shown in exaggerated size. See also figure 8.

(19) Reviews of hydrofoil boat development:

a) Oakley, State of Art, Aerospace Engg Dec 1962

b) Buermann 8c Hoerner, Naval Engrs J. 1964 p 191.

c) Buller, Status of Hy’foils, Interavia 1964 p 1692.

d) Soviet Hydrofoils, Interavia 1965 p 420; “Ra’keta”, Shipbuildg & Shipping Record of Sept 1958.

e) Hollenberg, Review, BuWeps 1960-53; AD-289,403.

f) Klante, USA Development, Schiff Sc Hafen 1964 p 347.

g) Yangos, Aeronautical Engineer on Hydrofoils, AGARD Rpt 473 (1963); AD-440,901.

h) Jane’s “Surface Skimmer Systems”, McGraw Hill.

i) Periodical “Hovering Craft 8c Hydrofoil”, London.

(20) Characteristics with fully submerged hydrofoils:

a) Miller, Hydrofoils, Nav Engrs J 1963 p 835.

b) Boeing, PC(H) Built for US Navy, Marine Engg Log Abstracts Feb 1964; AIAA Jc Aircraft 1966 p 79.

c) Hook, With Surface Feelers, The Syren Sc Snippg Jan 1959; Shipbdg Sc Shipping Record 1963 p 410.

d) Data NW Hydrofoil Lines 8c G&C (1966); see (22).

(21) Pairs of hydrofoils in tandem:

a) Kaplan and Sutherland, Stevens ETT Rpts 4C7, 410, 417,428,429(1951).

b) Wetzel, Interference, Univ Minn SAF Lab Rpt 61 (1962) 8c Paper 50(B) 1965.

c) Van Dyck, З-Foil Combination, Stevens Davidson Lab Rpt 975 (1963).

WAVE ANGLE. Part of the induced angle as in equa­tion (44) corresponds to a deformation of the water sur­face. On the basis of (ll, a,b) it appears that at higher Froude numbers, the wave factor is

Kw = 2(KL-1) (32)

This factor determines the amplitude of the undulating wave train, while

Kj = Kw + Kg (33)

determines the “biplane” drag due to lift; and equation (45) the permanent downwash angle (under a ceiling as above a ground). Assuming that the transverse wave train be sinusoidal (only true for small amplitude), the wave angle (slope) corresponds to the cosine. In hydrofoil boats, or their foil systems, we are only interested in the first 1/4 wave length, beginning with a down slope at the forward foil, and ending with the first trough. This point is found (see figure 19) at the distance behind the first foil, equal to 1/4 wave length

x – 0.5 n V"/g 0.05 V2 (ft) (34)

where V in ft/sec. The point is important insofar as there will be no down or upwash due to the wave motion, at that distance. For example, for a subcavitating cruising speed of 35 kts = 60 ft/sec, the distance is 180 ft. As such, it would just be possible to be reached by the second foil in the tandem system of a larger hydrofoil boat.

WAVE DOWNWASFL In all realistic hydrofoil boats, we will have to deal with the wave downwash in the first 1/4 of the wave length. As illustrated in figure 19, the downwash derivative between the lifting foil and the distance x as in equation (50) varies as the cosine of the angle @ of the orbital wave motion, between zero and 90° . The maximum wave downwash angle (not includ­ing that due to the bound-vortex circulation) is expected to be

Є° = – 36 CL Kw cos © /А (35)

where Kw as in equation (15), and where cos© and t = zero, at the first trough (equation 50). For example, at 1, a hydrofoil with A – 5, flying at h = c, h/b =

0. 2, with K^ = 1.3, Kw = 0.6, will produce a maximum wave angle & => 4.3°. As a matter of interest, equation (49) is properly confirmed by 1.3 = 0.6 т 0.7.

ROACH. Another interesting point in the “wake” of a hydrofoil is the intersection of the two inboard lines originating from the foil tips. Since their angle is theo­retically constant ( т or —19.5 ), the distance of the intersection is

x = ь VT (36)

where V~T — 0.5/tanl9.5°. This does not mean that a pair of lateral waves would meet there, thus forming a roach. As pointed out before, in realistic hydrofoil boats, the first transverse wave crest is at least one hull length behind the stem. The roach will then be between that crest and the stem, see figure 8.

A

гг

39

Ftons

maximum loaded weight

w

=

83.000

lb

ditto, weight in pounds

/

=

65

ft

overall length

‘b’

=

16

ft

beam of the hull

s

=

92

ft*

combined area of 3 foils

c

=

3

ft

average chord of main fobs

b

=

12

ft

span of each of 2 main fobs

A

=

4.0

aspect ratio of main foils

Ai

4.7

ditto, considering end plates

h

=

5.5

ft

foil submergence when flying

V

=

35

knots

cruising speed

V

60

ft/sec

ditto, in ft/sec

c

=

8 0.25

design lift coefficient (cruising)

■P‘

3.000

ВНР

maximum continuous combined of 2

D

=

0.1

w

when cruising (calm water)

vi

18

knots

speed w’hen taking off

CL

=

0.9

at takeoff (just flying)

n

75

number of passengers

THREE FOILS.

A combination of three foils as in the

A TYPICAL HYDROFOIL BOAT might be the "Victoria” (20,d). Characteristics are as follows:

“Victoria”, each supported by a single cerural strut, has advantages as follows.

a) The foils can readily be retracted by swinging them sideways, and lengthwise respectively, particularly in the “airplane” type configuration where the single rear foil may swing around the transom.

b) In the canard configuration (as in figure 20) the forward foil controls the height (altitude), while flaps in the pair of main foils make corrective motions.

c) Speaking summarily, the induced and/or wave drag of one of the 3 foils might be recovered.

Towing tank tests were undertaken (21,c) on the 3- foil configuration of the “Victoria”, as in figure 20. The two main foils are hopefully located within the up – w? ash areas outside the span of the control foil forward. Indeed, while the induced “lift angle” of one main foil tested alone, is 5.Ґ there is some reduction due to up – wash, that is down to 3.9° . Another test у elds a dif­ferential of 1.0° ; the average is 1.1° . It should be real­ized, however, that the angles discussed are those of the whole system pitching in unison. When considering the control action of one of the 3 foils alone, its lift-curve slope will essentially be that of an isolated foil (with dctf/dCj_ *= 15.6° , or dC^/doi0- 0.064, or doC/d6 = 0.55, in each of the main foils, for example).

CHARACTERISTICS OF HYDROFOIL BOATS

MAIN FOIL. Since the transverse wave system is a func­tion of the Fronde number, the above results only apply to the number based on longitudinal distance x, between canard and main foils

F = V/VgT = = 54/V32(38i – 1.54

where the first set of values applies to the 1/10 scale model, while the second set represents full scale con­ditions at V = 54/1.7 – 32 kts. ln terms of VT the dis- tance is x – 0.013 V4" (in ft). In figure 19, we are thus at x/0.25/ – 0.013/0.05 -0,26, where the wave down – wash angle is comparatively large. For a full-scale sub­mergence of 5.5 ft (to the foil level) and an aspect ratio of the forward foil A{- 4.7, the down wash angle (in the vicinity of the center line) is estimated to amount to dS /dCu – — 6.0 . Considering now a continuous main foil, obtained by joining the two main foils together at the centerline, their induced drag would tentatively correspond to an average down wash angle of dS°/dCf_ – (1.0 +• 1.0 — 6.0)/3 — —1.3°. For an aspect ratio A, = 2(4.3) – 8.6, with a submergence ratio h/b = 0.23, the induced drag of the main foil (pitching together with the canard foil) would be

dCo і / dC c — (К; / tr A і – (d £/ dCe)

= (1.25/27) f (1.3 fr/180) – 0.069

For comparison, the pair of split main foils alone, has 0.078; and the whole foil system together would have 0.072, instead of 0.065 as for the З-foil configuration. The increment is (0.072/0.065) — 1 – 11°V When cruis­ing at C^== 0,25: the increment would be in the order of 3°^of the total drag. In conclusion, the advantage of a split main foil lies in its convenient retractability as well as in reduced drag.

TAKEOFF. A situation where lift and drag due to lift are strongly involved, is takeoff. A hydrofoil boat is a more or less constant-angle-о Fan aek type of a vehicle. So far, trail і ng-edge flaps have not seriously been used to increase maximum lift. In automatically controlled systems, the flaps (or possibly the whole foil) are de­flected, however, particularly at lower speeds and during takeoff. Maxim urn lift coefficients obtained in this man­ner, are up to С^= L at the moment where the keel leaves the water. Taking the “Victoria” as an example, the induced or due-to-lift angles of attack required, will then be as follows:

F i. gu re 2 0. T h e 3 – f о і ‘ v м г – і і і о і t Ь е ; * – г і г і or і а”

(20,d) seen from belc », tested in a towing lank (2Lc)

CHARACTERISTICS OF HYDROFOIL BOATSa) The biplane-type angle (equation 20) with a К Value (fig 9) for twice the submergence h as in cruising condition. For Щ = 1.03, and Ay – 4.7, the result is Ы{ – 4.2° , instead of 4T° (as for an unlimited field of flow), and CD*L — 4.2 tr /180 •— 0.073, in­stead of 0.071, for an assumed (3 — 1.

b) The transverse-wave angle as in equation (14). Con­sidering that at takeoff (subscript t), – 0.5 V,

while ht = 2 h (where parameters without a sub­script indicate design or cruising condition) the Froude number at takeoff = l/V g ht may only be 36% of that when cruising. In case of the “Vic­toria”, this number is = 36(1.7)/V 32 (5.5) = 4.6; and at takeoff, = 1.6. For such a small number, equation (14) is no longer applicable. Figure 30 in chapter XI of “Fluid-Dynamic Drag” indicates a

Aoc = 0.09 Kw(c/h)(180/ir) = 0.35°, where Kw = 0.25, — and c/h = 3/11. The corresponding maximum increment of drag due to lift corresponds to ACd = (0.25) 0.09 (c/h) = 0.006.

c) The additional angle required to make up for the reduced dynamic pressure at the lower panel of the “biplane” (equation 26). For Cp = 1, this angle amounts to Ac* = (5/tt)/3.7 = 0.43°; the drag in­crement is indicated by AC^ = 0.43 (тг/180) = 0.007.

d) Regarding the angle of attack required to reach Cp — 1, equation (29) still has to be taken into account. The circulation-type increment of the angle is in the order of 0.6°. All the four increments are of the same order of magnitude. The combined value is Ac* = 1.5°, in addition to the “aerodynamic” oq —: 4.1°, for Cp 1.

14-

CHARACTERISTICS OF HYDROFOIL BOATS

(00 flo (oO 6 0 $0 ioo

LOAD ON HULL % -«*————————————————— ЮАБ ON FOILS %

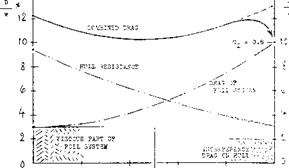
Figure 21. Drag of a hydrofoil boat similar to the

“Victoria” (20,d) at takeoff speed, estimated on the basis of foil tests (figure 20) and towmg – tank investigations of the hull as in (2lx).

SIZE-SPEED-SUBMERGENCE, Drag due to lift (which amounts to some 80°/° in the takeoff condition con­sidered) may be more important than the angle of at­tack. This drag is increased to (0.094/0.079) -1.19 times the biplane value, as in (a) above. Total drag at takeoff is increased some 14°/°. — Considering now takeoff conditions in more general terms (but still at Cp= 1), it follows from equations (14)( 15) that

dCD /CDL = A<V/CVL ~ (C/Vt2) A1’3 ; Д<х ~ c A°’3A^

and from equation (26) that

ЬСь /Сь1 = Ьо(/Ы[ b/h; but A<x ^ c/h

We summarize these trends by saying that at takeoff, ACD~ Aoc is primarily:

ACd ~ c which means size of foils and craft,

AC^ ~ i/V£* which means low design speed,

ДСф ^ 1/h means submergence and sea waves-.

(22) The “Victoria”, designed by Gibbs &: Cox (New York City) for Northwest Hydrofoil Lines (W. I. Niedermair, Seattle, Wash.) built by Maryland Shipbuilding’ Sc Dry – dock Co (Baltimore) is operating between Seattle i Wash­ington) and British Columbia (Canada).

(22) Performance characteristics of hydrofoil craft:

a) Hoerner, Takeoff, G&C T’Rpt 6 for О NR (1952).

b) Hoerner, Tests of “Sea Legs”, G&C Rpt (1958).

c) Hoerner, Size-Speed-Power of Hy’foil Craft, (26,b). (24) Hydrofoil boats of the surface-piercing type:

a) Von Schertel. Transportation (German & Supramar) SNAME Paper 1958; Am Soc Nav Engrs J 1959 p 603.

b) Biiller, Hydrofoil Boats, Ybk STG 1952 p 119.

c) Harbaugh, Development, SNAME Paper 2-h (1965).

d) Canadian EHE-400, Shippg World Shipb Aug 1964.

e) Lewis, For Canadian Navy, SNAME Paper 2-1 (1965).

f) The boat (d, e) has a foii-span/beam ratio of 3,

so that it resembles an airplane in planform.

(2d) Consideration of size Sc speed of hydrofoil boats:

a) See under “size and speed” in the first chapter.

b) Hoerner. S-S-P, Naval Engrs Journal 1963 p 915.

HULL LIFT. The lift coefficient Cp — 1, mentioned above for takeoff, is not necessarily the optimum (giving least drag). Rather, it is usually’preferable to let a plan­ing hull carry some of the weight, to get over the hump in the drag/speed function. The optimum distribution of load depends very much upon the resistance charac­teristics of the hull. Depending upon the Froude number at takeoff speed, a suitable hull may be selected, ten­tatively with a length/beam ratio of 4. It is shown in figure 21, how hull resistance and hydrofoil drag vary as a function of speed. The resistance is taken from towing-tank tests on a hard-chine hull with charac- terists similar to those of the “Victoria”. An amount of AD/W = 2% is added to account for interference with the struts attached to the bottom. Starting point for the foil system is AD/W — 37b representing the fully (11 ft) submerged struts plus nacelles. The foil systems
drag due to lift corresponds to dCD /dC£ =0.065 +0.010, where the second component accounts for the increase of the viscous drag (including interference). As in other configurations, minimum combined drag is obtained roughly with 50°/° load (weight W) each on the hull bot­tom and on the hydrofoils. To get from the minimum (D/W = 10.5%) to the takeoff point (where the keel leaves the water, with 100°/° of the load on the foils) it is necessary, first to go to some 12% of drag. This is done by deflecting the control flaps of the main foils and the angle of the canard foil. The latter one can also be used to maintain the optimum angle of trim during the takeoff run (which is around 3° , keel against water­line). It can also be understood, that lift-increasing de­vices (special flaps) are not needed in hydrofoil boats. The induced drag would increase the hump drag (D/W = 120/c). Of course, acceleration both in longitudinal and in vertical direction, require some additional thrust, not thinking of sea waves against which the boat may have to take off. In fact, the full-throttle thrust of the “Victoria” at 19 knots, is some 17,000 lb, which is almost T/W =20%. With a margin above the hump of some 6000 lb, the 87,000 lb of fully loaded weight can be ac­celerated by

TURNING. When turning, any vehicle needs a centri­petal force Y to resist or balance the centrifugal force

Y = ‘M’vVr =2 W vVg d (37)

where ‘M’ =W/g =mass, and d = 2 r = diameter of the turning circle; see figure 22. In airplanesthis force is provided by a component of the wing’s “lift”, obtained by banking properly. In displacement ships as in air­ships, the lateral force is the lateral “lift” (or “resist­ance”) of the hull (including stem, rudder, vertical fins) as described in the “slender body” chapter. In hydro­foil craft, banking is theoretically possible. Indeed, the surface-piercing type is supposed to bank in a manner similar to that of certain more or less planing motor – boats (having a suitably dihedraled bottom). Most of the boats with fully submerged hydrofoils are turning “flat”, however, thus avoiding broaching of the outside foil tips (particularly in sea waves). In this case, the struts have to provide the lateral lift force Y. Solving equation (60) for the turning diameter:

d =2 r =2 ‘M’ V2/Y =2 V2/a = (2/g) vV(a/g) (38)

where the hydrodynamic force Y=‘M’ a, and a = lateral acceleration.

AT/W/g = 6000(32)787,000 = 2.2 ft/sec2
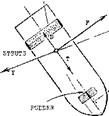
CHARACTERISTICS OF HYDROFOIL BOATSПодпись: ANGLE OP YAW CHARACTERISTICS OF HYDROFOIL BOATS

The control system can then be used (by way of an alti­meter) to make the boat “jump” up to the cruising level, corresponding to a foil submergence of 5.5 ft. As pointed out in chapter XI of “Fluid-Dynamic Drag”, resistance then reduces; and the minimum obtained in the “Vic­toria” is D/W = 90/o, at 26 or 27 knots. At the maximum continuous speed of 36 kts, the drag ratio is D/W = 10% A speed of 39 kts can be obtained (in calm water) by re – ducing submergence to 3 ft.

-■5—— RADIUS г OP TURNING CIRCLE

CHARACTERISTICS OF HYDROFOIL BOATSFigure 22. Geometry and forces during the steady-
state turn of a hydrofoil craft.

SURFACE-PIERCING hydrofoil boats, particularly of the Schertel-Supramar type (24,a, c) are at this time operating in larger numbers, in passenger-carrying serv­ices, primarily in sheltered waters. Considering, how­ever, military applications in open, or at least in coastal waters, there is only a limited advantage in such boats, over conventional patrol or motor-torpedo boats, in regard to speed, stability and riding comfort in a sea­way. To point out the importance of seakeeping in these and other hydrofoil boats, it may be mentioned that the world-speed record in so-called hydroplanes (gliding, riding or flying on 3 points over perfectly calm water) is around 200 mph (some 170 knots), while seaplanes are available, or could be built again, with minimum speeds,%y around 100 kts. In other words, the problem is to go continuously fast in water which is not calm, but may have waves up to 6 ft in height (crest to trough, as in sea state 4).

LATERAL FOIL FORCES are essentially proportional to the angle of yaw or sideslipping (which is a neces­sity in any turn). The required forces can be produced by struts, by dihedral of the foils, and/or by end plates attached to the foils. For the latter, see the “wing” chap­ter. Lateral forces of “V” shaped foils can be found in the chapter on “directional stability”, under “V” tails. Regarding surface-piercing dihedraled hydrofoils, a metacenter (the lift center) different from the one re­sponsible for roll stability must be considered. This is indicated by dashed lines in figure 16. It is seen that in the particular emergence depicted, the craft is not balanced (it will heel outward). This type of boat has to slow down before making a turn, so that a larger wetted span is obtained. The lift center can also be raised by replacing the apex of the “V” shape by a horizontal piece of foil.

STRUT FORCES. Boats with fully submerged hydro­foils need vertical struts (with lateral area) for turning (and stability). As a tolerable level of acceleration in equation (61), a = 0.2 g may be assumed. Disregarding ventilation, a surface-piercing strut is a “lifting wing”, with the hydrofoil below acting as a large end plate. A pair of struts could also be considered to be not only a biplane, but even a “boxplane”. As an example, we will assume a single-strut configuration (similar to those of the “Victoria”) with dimensions as follows.

A =4.5 = aspect ratio of hydro foil

с = c = chord of foil and strut

h/b = 1/3 = foil submergence ratio h/c =1.5 = wetted aspect ratio of strut

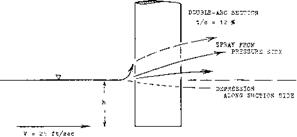
The surface flow pattern past a yawed, lateral-lift pro­ducing strut is a function of the Froude number Fc = v/l/fc. Within the range of high numbers (as we have them in hydrofoil struts) the theory of antisymmetrically twisted wings (28,d) predicts an effective aspect; ratio of the strut equal to that of the submerged part Con­sidering the foil to be an end plate with (h/b) (strut)

= (b/h)(foil) = 3, the effective ratio is theoretically doubled; thus AL = 2 (1.5) = 3. The flow pattern at the water surface shows some water piled up at the pressure side, and a depression (hollow) forming along the suc­tion side. — Experimental lift coefficients of a strut are plotted in figure 23. Evaluation of these and other data (on surface-piercing foils) leads to the conclusion that a piece of the strut “at” the water surface equal to at least Ah or Ah = 0.10 c, is not producing lift (on account of spray?). This means that the effective area is reduced as well as the effective aspect ratio. According to the “wing” chapter, the lateral angle required, Corresponds to 0

d^/dC^t = 11 + (1 l/Af) + (26/Aj_) (39)

In a similar manner, for aspect ratios below unity (as in the “small aspect ratio” chapter):

dClat /dP° = 0-8 (i^/360)Aj = 0.022 Aj. (40)

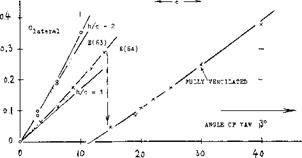
for the forces of the strut. As seen in figure 23, the two equations describe very well the tested forces. Regarding the non-linear component of lift, it is reasoned that it cannot develop at the piercing point of the strut. This component might then be approximated by

ACl = sin2|i/A (41)

LIMITATIONS. It is seen in figure 23, that the lift (lat­eral force) of one of the two struts breaks down at (3 — 14°, from Claf = 0.3. This breakdown due to ventilation, is discussed in the next section. Other limita­tions as to turning, are the rolling moment to be bal­anced by “aileron” deflection in the hydrofoils, the effectiveness of the rudder(s) (attached to, or part of one or more struts), and the power required to overcome the increased drag (due to lateral-force-producing struts, aileron deflection, and foil-strut interference,

CHARACTERISTICS OF HYDROFOIL BOATS

CHARACTERISTICS OF HYDROFOIL BOATS

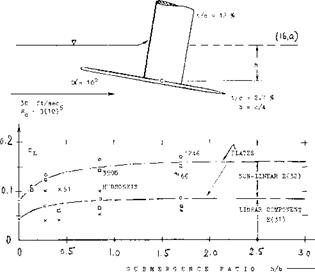
Figure 23. Lateral forces originating in a surface­piercing strut, tested (28,b) at I^ — 9, and Rc — 4(10)^, in a towing tank.

Подпись: O.o b ■- Figure 24. Lateral forces of surface-piercing struts (around zero angle of yaw) as а 0.0Г - function of their submerged aspect ratio. , 6,0 tf --
Подпись: (28) Lateral forces of hydrofoil boats when turning: a) Schwanecke, Surf-Piercing, Schiffstechnik 1957. b) Dingee, Skids Strut, Stevens ETT Rpt 472 (1952). c) Floerner, Turning Analysis, included in (23,b). d) Chey к Kowalski, Testing of Strut к Strut-Foil Interference, Stevens Davidson Lab Rpt 936 (1963). CHARACTERISTICS OF HYDROFOIL BOATS CHARACTERISTICS OF HYDROFOIL BOATS

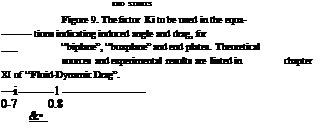
INTERFERENCE. The lateral-force derivatives (around = 0) of struts from two different sources, are plotted in figure 24, as a function of their submerged aspect ratio. The theoretical functions (equations 63 and 64) agree well with the tests on an airfoil-type section. A sharp-edged section evidently loses some suction lift. Considering a hydrofoil attached to the lower end of the strut to be an end plate, the Kj, factor as in figure 9 could be used to increase the effective aspect ratio. As shown by the pair of single points ( —) in figure 24, there are considerable interference losses, however, at the strut-foil juncture, thus reducing the force slope

CHARACTERISTICS OF LIFTING HYDROFOILS

Boats equipped with hydrofoils – and thus “flying’’, with their hull out of the water, have been under develop­ment for more than 50 years. Characteristics of such foils have been analyzed and tested (in towing tanks).

SURFACE WAVES. Drag due to lift of fully submerged hydrofoils is explained at length in chapters X and XI of “Fluid-Dynamic Drag”. As long as

doCi/dq = dCDL /dCL (7)

the angle due to lift can easily be derived from the drag functions. First of all, there is a surface wave. Water piles up above the hydrofoil moving below, thus starting a transverse wave train (with crest and trough lines es­sentially parallel to the foil). In two-dimensional flow, an angle similar to the induced angle (see the “wing” chapter) is caused by lift in the presence of a free water surface. Based upon submergence h and area (b h), indicated by subscript ‘h a universal function is ob­tained (see chapter XI of “Fluid-Dynamic Drag”). For froude numbers Fh above 5, we obtain approximately the angle due to the wave, but at the level of the foil:

d<xw/dCLh =0.5Fh2 =0.5gh/v2 (8)

where w indicates “wave”. Considering Сщ = C (c/h), we find

<xj = Kw(0.5/fJ )(c/h)Cu(180/ir) (9)

The factor Kw = f(b/h) (as in chapter XI of “Fluid- Dynamic Drag”), approximated by

Kw=(b/h)°y4 (Ю)

always smaller than unity, accounts for finite foil span. We can also write

doc% /dCL = (Kw/f£)(90/tt) (I l)

2 2

where Fc =V /g c. For a given hydrofoil craft (with constant weight, and foil dimensions b and c) it is then found that

aw~iMh°’3

(12)

—’ l/v6h0’3

(13)

For all practical purposes, therefore, this two – dimensional wave angle can be disregarded at the us­ually higher cruising speeds of hydrofoil boats. See later under “takeoff”, however. An important aspect of drag due to lift is also the fact that most towing – tank tests on hydrofoils are done above the critical or wave propagation speed

Vw = VJU (И)

where H = depth of the water (to the bottom) of the tank (or possibly in a water tunnel). In short, “all” experimental results at higher speeds (and/or higher Reynolds numbers do not contain the two-dimensional type of wave angle and wave resistance (13)

INDUCED DRAG and the corresponding increment of the angle of attack are as in airplane wings, a function of the aspect ratio A = b2/S. The surface of the water is deformed again by the presence of a lifting wing below. As shown in figure 8, a hollow appears on the center line of the wake, at x = 1.4 b. On the other hand, above the foil ends (wing tips), a pair of humps develops. Gravity distributes these humps in lateral directions, in form of 2 pairs of waves. Part of the “in­duced” drag can thus be called wave resistance. It can be said, however, that those waves are part of the trail­ing vortex system, partially transforming itself into trailing waves. At any rate, momentum is transferred from the moving hydrofoil onto the water; and it does not matter much, whether to name it “wave” or “induced”.

CHARACTERISTICS OF LIFTING HYDROFOILS

Figure 8. Theoretical wave pattern (11 ,b) caused by the motion of a fully submerged hydrofoil. The whole system moves to the left, with the viewer fixed to it. It must be understood that not the water as such moves together with the foil, but only its orbital wave motion. See also figure 19.

BIPLANE THEORY. Within the range of higher Froude numbers (as they are used in hydrofoil boats) the surface of the water follows more or less the stream of down – wash going on below. Theoretically, therefore, the hydrofoil produces the same lift as the lower panel of a biplane configuration (see the “airplane” chapter). The

CHARACTERISTICS OF LIFTING HYDROFOILS
Подпись: (15,c)
Подпись: SUBMERGENCE h

vertical separation of this equivalent biplane is (2 h) where h = submergence of the foil. The induced angle is then

O; = Ki CL/irA; d(Xi/dCL = 20 Щ/А (15)

where 20 as in the “wing” chapter, while K{ = 1 for suf­ficiently large values of h/b, and K[ = 2 for the limiting case of the foil planing at the surface. This function is plotted in figure 9.

WATER

CHARACTERISTICS OF LIFTING HYDROFOILS

SUBMERGENCE НлТІО h/c

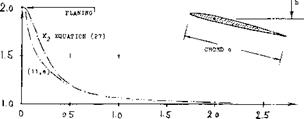
Figure 10. Factor K2 (equation 27) indicating the increment of the two-dimensional angle of attack required for a submerged hydrofoil, to obtain a certain lift coefficient; equation (18).

(10 Technical reports on hydrofoils and hydrofoil boats. A selection listed in (11) (14) (15). More than ЗСЮ sources (possibly half of them available to the public), between 1947 and 1961, are listed in “Bibliography and Literature Search” by Tech Info Center, North American Aviation Rpt S&ID 1961-157; AD-282,464.

(11) Analysis of data on submerged hydrofoils :

a) Wu, Finite Span, J Math к Phys 1954 p 207.

b) Breslin, Ship Theory for Hydrofoils, J. Ship Research Apr 1957, Mar 1960, Sept 1961.

c) Wadlin, Calculation, NACA TN 4168, NASA R-14.

d) Wadlin, Theor and Experiment, NACA Rpt 1232.

e) Schuster, Oscillating Foils, (1960); AD-257,305.

(12) Lifting characteristics of biplane wings:

a) Kuhn, Distribution Betw Panels, NACA Rpt 445.

b) Diehl, Relative Loading, NACA Rpt 458 (1932;.

CIRCULATION. When approaching the free surface of the water, the lift of a two-dimensional hydrofoil re­duces also. As pointed out in (ll, e) the upper side of the foil loses lift, while the lower side remains unaffected by the proximity of the water surface. At or “in” the surface (planing) the circulation is reduced to half, for a given angle of attack. There are two analytical ap­proaches to this effect:

a) We will replace the upper panel of the imaginary biplane by a lifting line, tentatively with the same circulation as in the lower panel:

Г — 0.5 CL Vc = w2rir (16)

This means that at the radius r = 2 h, there will be the circulation velocity

w/V=(CL/8ir)/(h/c) (17)

This velocity w is a component directed against the on­coming V. This consideration leads to an increment of the angle of attack corresponding to

A(do</dC^) = (dcx/dC^) (c/h)/4ir = 0.08(dcx/dCL)/(h/c)

where do^/dC^ = uncorrected biplane “lift angle” (equa­tion 30). The formulation does no longer hold, say be­low h/c = 0.4; it does agree, however, with the more complete analysis in (12).

b) According to (ll, c) we have in two-dimensional flow, the factor

K2 = (16(h/c)2 + 2]/[16(h/c)2 + 1] (18)

This equation, also approximating three-dimensional conditions, is plotted in figure 10. The first term of the “lift angle” will then be

dofg/dCL = 1^(10 + 10/A2) (19)

n

where (10/A ) taken from the “wing” chapter, accounts for the influence of the chord (lifting surface). A function for as indicated in (ll, e) is also plotted in figure 10.

Experimental results proving (a) or (b) to be correct, are hard to find. It is suggested, however, to accept equations (18) and (19).

Подпись: (20)Подпись:Подпись: 2.0Подпись: •VПодпись: LIFTING SURFACE CIRCULATION“LIFT ANGLE”. Using the induced angle as in equation (20) the “lift angle” of a fully submerged hydrofoil (wing) is expected to be
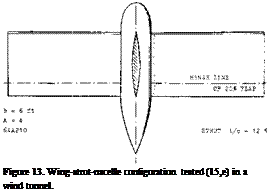
d<*7dCL = K2[ 10 + (10/A2)] + (K£ 20/A)

Experimental derivatives of hydrofoils are plotted in figure 11. Equation (30) serves well to explain the angles as tested.

DRAG DUE TO LIFT. We see that the “induced” factor is involved in all terms of the lift equations. As stated in (ll, c) this is partly empirical. When it comes to due – to-lift drag, it is necessary, however, to be specific. Re­garding the linear component, the biplane concept indicates

Cd1=KLCl/Va (21)

It is suggested, however, to consider the increment of the angle of the lower panel as in equation ( 26) as a drag-increasing component. The non-linear component is a normal force. Its drag component is simply

ACd = ДС^ sino( (22)

SMALL ASPECT RATIOS. Hydrofoils as considered

so far, have higher aspect ratios (say at least A = 3). However, when using hydroskis, very small aspect ratios may also be of interest. Simplifying the formulation as in (11,c) we obtain for the linear term of the lift

dCL/dctf= A 2 ir/3iq « A/30°K[ (23)

Where K[ is taken from figure 9. Correlation of ex­perimental points in figure 12, is not very good. Replacing the 30 by 360/T2 – 36°, as in the “low aspect ratio” chapter, agreement is found with data from (16,c). The question then remains why lift re­ported in (16,a) is higher than expected by theory.

CHARACTERISTICS OF LIFTING HYDROFOILS

Figure 12. The lift of flat plates (16,a, c) and

of profiled hydroskis (16,d), all having an aspect ratio of 0.25, as a function of their submergence ratio.

STRUTS are needed to support a hull above 2 or 3 hydrofoils. A larger main foil may have 2 struts, while a smaller control foil is usually connected with the hull by means of one central strut. As explained in chapter VIII of “Fluid-Dynamic Drag”, any disturbance on the upper side of a wing is likely not just to reduce its lift,

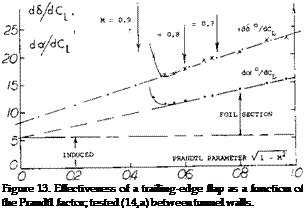
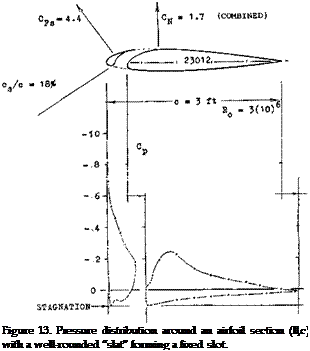
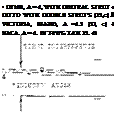
but to increase its induced angle and induced drag. Re­sults of wind-tunnel tests (15,e) on the assembly as in figure 13, are as follows:

configuration

dcx°/dCL

doc.7dCL doC{/dCL

dCD/dCL

CL*

plain wing alone —————

15.4°

3.9

0.068

0.077

1.05

wing with nacelle—————-

00

T

4.3

0.075

0.078

0.86

wing-nacelle – strut——–

15.2°

3.7

0.065

0.081

1.05

wing with strut—————

16.0°

4.5

0.078

0.087

1.04

Подпись:Подпись: Figure 13. Wing-strut-nacelle configuration tested (15,e) in a wind tunnel. The two-dimensional “lift angle” is assumed to be 11.5°, for A = 4. There is no doubt that strut interference reduces the effective aspect ratio by some 10°A The nacelle acts, on the other hand, like a good fairing. Maximum lift (CLx = 1.05) was not affected by the strut.
Подпись: STRUTПодпись: 16-309Подпись:Подпись:CHARACTERISTICS OF LIFTING HYDROFOILSПодпись:

ENDPLATES as described in the “wing” chapter can also be used in connection with hydrofoils. Regarding the factor (figure 9) it is suggested to consider the foil as a lifting line or surface, with the same h/b as with­out plates, whose circulation and effective aspect ratio are increased. Experimental results (15,d) confirm this procedure, as long as the end plates do not touch the water surface. [72] [73] [74] [75] [76]

END STRUTS. A pair of struts are often used to support a hydrofoil like a beam, that is with the struts located each, say at 1/4 of the span from the lateral edges. In this manner, the struts have some end-plate effect. How­ever, figure 14 does not confirm that dc</dCL would be reduced, or lift increased, in comparison to a single central strut. When placing the struts at the very ends of a rectangular wing, a “boxplane” is obtained rather than the biplane discussed above. Theory indicates that the factor KL’ as in figure 9, reduces from 2, at the sur­face, to zero for “very” deep submergence ratios. The connection between boxplane and biplane factor is approximately

KbM= K/(l + h/b) (25)

In reality, end struts are bound to disturb the flow at the upper side of the foil, as shown in (15,b), thus in­creasing induced angle and drag above that as indicated by theory.

1 6-012

WATER SURFACE

7 = 27 ft/зес

4o~

CHARACTERISTICS OF LIFTING HYDROFOILS

V.

8-10

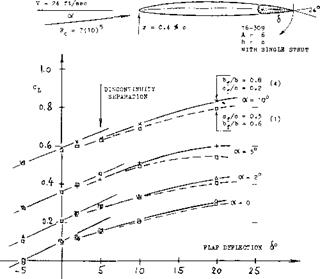
CONTROL FLAPS are needed to balance and to stabi­lize a hydrofoil craft in roll and pitch. Their character­istics, including hinge moments, are available in the “control” chapter. Figure 15 presents experimental results obtained on the 16-309 section. On account of the comparatively large trailing “wedge” angle of this section, the control effectiveness breaks down at de­flection angles beyond + 3 and — 5°, as a conse­quence of separation from the flap. Regarding control, this type of section (selected on the basis of higher non-cavitating speeds) cannot be considered to be desirable. With the minimum pressure intended to be located at 60% of the chord and a trailing wedge angle of 24°, early separation from the suction side of the flap must be expected. We have indicated in the graph what the lift due to flap deflection would be, if sepa­ration did not take place. On the basis of the experi­mental results presented in the control chapter, the effectiveness ratios dot/d8 = (dC’^/d6)/<dC^/do<) should be as follows:

doc/d<S = 0.8(0.48) = 0.38 Cp/c = 0.2, and Ъ4/Ь = 0.8

dcv/d6 = 0.6(0.60) = 0.36 cf/c = 0.3, and у b = 0.6

dcx:/d<S = average =0.38 as tested (16,a)“l” and “4”

within the range of 6 = — 4° to + 2°. However, outside this range, lift due to deflection is similar to that of split flaps, as indicated in the “flap” chapter. Drag is multi­plied, for example tripled for a deflection of 10°. A different foil section and/or a flap shape modified as indicated in the “control” chapter, would certainly give a better performance, in regard to control, lift and drag. In fact, the plain flap in the configuration as in figure 13, provides a dcg/d8 = 0.46, up to some 12° of deflection, on a 64A210 foil section; and that in figure 3, has a do</db = 0.63, that is for a 30°% flap.

CHARACTERISTICS OF LIFTING HYDROFOILS

CHARACTERISTICS OF LIFTING HYDROFOILS

Figure 15. Lift of hydrofoil (17,a) produced by deflection of pairs of trailing-edge flaps.

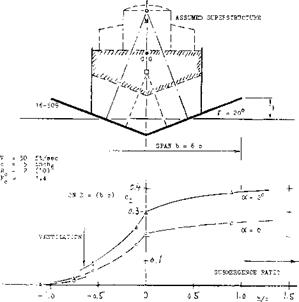
SURFACE-PIERCING hydrofoils are intended to give height (heave), roll and pitching stability through their shape. In theory, their lift, induced angle, roll stability (metracentric height) and even the pitching character­istics of a tandem pair of such foils, is readily understood and susceptible to analysis. The lift of one such foil with a dihedral angle of 20°, is shown in figure 16, as a function of its submergence (but at constant speed and constant angle of attack). Referred to the geometrical total pro­jected planform area, the coefficient reduces, as the foil emerges from the water. These towing-tank tests are performed in perfectly calm water and in steady forward motion. In reality, surface-piercing foils are very problematic because of ventilation irregularly creeping and/or breaking in, from the surface-piercing ends, particularly in sea waves. In the configuration as in fig­ure 16, the struts serve as “fences”. It is reported that at h/b = — 0.1, “a more or less sudden breakdown of the flow over the upper surface occurs”. This emergence ratio corresponds to the condition where the strut junc­tures are just out of the water. The average variation of lift with submergence (between h/b = 0, and — 0.1) corresponds to dC^/d(h/b) = —2. With this approxi­mate derivative, all stability characteristics and motions of a craft can be estimated. The metacentric height is indicated in the illustration as the difference between point M and the CG. The apparently high roll stability also means that riding in sea waves will be rough.

Figure 16. Lift of a surface-piercing hydrofoil-strut configuration (18,a) as a function of its submergence.

Подпись:THE “LIFT ANGLE” of surface-piercing fully-wetted dihedral hydrofoils as derived from (18,c) and from the formulations in this chapter and in the “wing” chapter, is expected to be
dcx°/dCL = (10 Kj/cosf) + (10 K2/A2 cos/™ ) + (Kl 20/A)

Span, area and aspect ratio are based upon projected “wetted” dimensions. For the angle of the section (lift­ing surface) analysis as in (18,e) indicates a

K2 = 2(1-/775) (26)

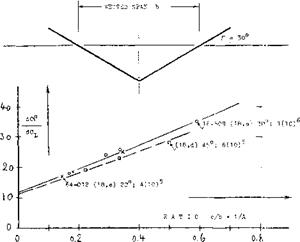
where the angle of dihedral is in degrees. Adopting the average submergence (at 1/2 halfspan) as “the” sub­mergence, it may be said that the equivalent of a “V” foil is a boxplane (figure 9) with a span equal to the distance between the surface-piercing points. Experi­mental results are plotted in figure 17 as a function of the projected wetted aspect ratio, that is of the ratio c/b = 1/A. The experimental points can be matched by equation (37) when reducing the aspect ratio by

ДА = Ah/c = 2 (Дїі/с)ЛапГ = — 0.2/tan/" (27)

This means that for Г = 30°, the effective aspect ratio is A^= A — (1/3). In other words, the surface-piercing foil ends are not effective for a submergence Ah == 0.1 c, because of surface effects (disturbance and ventilation around the piercing points).

CHARACTERISTICS OF LIFTING HYDROFOILS

Figure 17. Lift angle of surface-piercing hydro­foils as a function of their wetted aspect ratio.

(18) Characteristics of surface-piercing hydrofoils:

a) Benson, With Struts, NACA W’Rpt L-758 (1742).

b) Sherman, Various Foil Sections, DTMB Rpt C-813.

c) Purser, “V” Tail Analysis, NACA Rpt 823 (3945).

d) Sottorf, In Hamburg T’Tank, ZWB FB 1319 (1940).

e) Bernicker, Flaps, Davidson Lab Rpt 964; AD-601,578

HYDRODYNAMIC LIFT

Low-speed aerodynamics are often called hydrody­namics, simply meaning that compressibility of the fluid is negligibly small. As we will see, fluid-dynamic forces in water, are not necessarily similar to those in air, however, not even when disregarding cavitation.

A. FULLY SUBMERGED LIFTING

CHARACTERISTICS

All that has been said in previous chapters regarding boundary layer, Reynolds number, flow separation, lift or lateral forces of foils or control surfaces, also applies in liquids, such as water in particular. Although towing-tank tests are concentrating on “resistc. nce”(of ships, boats) information is also available on fins, rudders, control surfaces and their forces; and of course, hydrofoils.

REYNOLDS NUMBER. Since everything in a towing tank is usually geared to water-surface effects (waves) and the proper Froude number, Reynolds numbers are so low that appendages are not tested at all in typical investigations. Considering, for example, a hul model 10 ft long, representing a 500 ft long ship designed for a speed of 20 knots (34 ft/sec or some 10 m/s), th e maxi­mum towing speed corresponds to

Ij = V/VgT = 34/V32 (500) = 0.27 (1)

This is the “first” hollow of the wave resistance function, for which most ships are designed. The resulting model speed is V = 1.5 ft/sec, and the Reynolds number is

R| = V7/V= 1.5(10) 10*71.25= 1.2{10)6

However, the R- number of any rudder, stabilizing fin, or for the appendages of a submarine would only be in die order of 50/o of that value, which is below 10/ Test­ing a rudder separately, and adding its forces to those of One ship, does not give realistic results either, because of the very considerable wake within which rudder (and propeller) are located. The problem of steering and oabilizing of ships is very often solved, relying heavily on statistics (past experience).

RUDDERS. To support the large forces originating in a rudder, its structural strength has to be adequate. Con­sider, for example, a destroyer (5,b) turning at full speed (say 35 knots = 60 ft/sec) and with full rudder (up to 35°). Conditions may then be as follows:

SR/?h =

2 °/°

statistical rudder area (3)

SR

200 ft2

total rudder area (1 or 2)

q

3,600 lb/ft2

dynamic pressure (no wake)

=

1.0——–

normal force coefficient

N

700,000 lb

normal force in the rudder

The data are based on / = 400 ft and l/h = 9. Considering, however, the boundary layer (along a planing bottom) the rudder force may be reduced to some 60o/°. The force is then in the order of 5°A of the ships displacement weight (assumed to be 4000 long tons). However, when

HYDRODYNAMIC LIFT

■г

4\ч4ч\чуччччалуиии\у

1

WIND TUNNEL WALL, , AW\WW V w V \ WXWxMWWV

HYDRODYNAMIC LIFT

I

Figure 1. Lift of a plain control surface or

rudder tested in a wind tunnel (l, b) in combination with an end plate (wall).

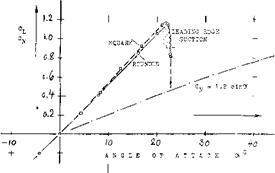
located within, or when flanking a propeller slipstream, the rudder force will be larger (5,b). The diameter of the rudder stock may be in the order of 1 or 2 it, in any larger ship. In hydrodynamic terms, a thickness ratio of t/c = 15% is considered to be “modern”. A number of such rudders (or control surfaces) have been tested (1) (6) (9) in wind tunnels. A convenient setup for doing such tests is to combine them with an endplate (or the wall of the test section), through which a rudderstock supports the model. Disregarding gap and boundary layer along the wall, the effective aspect ratio is then the “reflected” one, with a span b and an area twice the “exposed” dimensions. Figure 1 shows a typical example. The lift-curve slope corresponds to what is said in the “wing” chapters. At c* = 22°, the flow breaks down, evidently separating from the suction side. The maxi­mum lift coefficient is almost CLk = 1.2. Considering the surface roughness usually found in ships, this value does not mean much, however. Lift due to leading edge suction is theoretically (7,a):

CU~CL M6+(0.2/A3A | (2)

Cutting off the peaks in figures 1 and 5 accordingly, we may tentatively account for surface roughness. The re­sult is a lift function similar to that in part (A) of figure 3. Beyond the angle of maximum lift, the normal force will take over. As suggested in the “stalling” chapter, this force may correspond to

C^ = 1.2 sine* (3)

where 1.2 = C^ = drag coefficient of a flat plate at c< = 90°. For example, at cx = 45°, the coefficient may be C^ = 0.85, and the lift component Cl = 0.60.

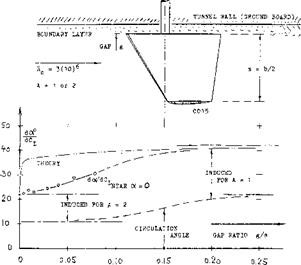
WALL GAP. Since the “wall” of a ship is usually curved, the structural gap may also open up as the fin is deflected. A “control surface” was tested (l, c) with gap ratios ‘g’/s up to some 10o/o. It is shown in figure 2, how the angle of attack (or deflection) required to produce a certain lift coefficient, increases as the gap is widened. As already stated in chapter VII of “Fluid-Dynamic Drag”, lifting-line theory is not confirmed at all. The flow through the gap is evidently restricted by separation. Eventually, the surface as in the illustration must be expected to assume a lift-curve slope corresponding to its exposed aspect ratio A = 1 (see the “wing” chapters).

ROLL-STABILIZING FINS have been introduced during the last decade to improve passenger comfort in a rolling sea (2). Such fins are half “wings” protruding from the hull in essentially lateral direction. Their angle of attack is automatically controlled by an electro – hydraulic system, sensing (and anticipating) angle and rate of the rolling motion. Some of the half “wings” tested (1) in wind tunnels, could be used as stabilizing fins. Lift-curve slopes and maximum lift correspond to what is said in the chapters dealing with “wings” and “stalling”. Of course, there is a boundary layer (the “friction belt”) around the hull of a ship. For example, at a position of 200 ft from the bow of a 500 ft long ship, the total thickness of the BL is in the order of at least 1.5°/o of the 200 ft, which is 3 ft. As described in chapter II of “Fluid-Dynamic Drag”, the corre­sponding displacement thickness is about 0.5 ft, and the momentum thickness is 0.3 ft (in comparison to a fin length of possibly 12 ft). Some fraction of these thicknesses, we might consider to be the equivalent of a gap. — When deflecting a pair of fins in the fashion of ailerons (one against the other) they interfere with each other, by producing a circulation, at least around the bottom of the hull. It is suggested that this inter­ference be small.

SUBMARINES (8) have also horizontal fins called “planes”, for control and stabilization (9) of longitudinal up and down motions. Because of some secrecy about design and characteristics of such vessels (in all nations concerned) specific experimental data do not seem to be available. However, any pair of “stabilizing” planes located near the stern, can be treated in the same way as the horizontal tail of an airplane; see the chapter on “longitudinal stability”. In most submarines, a second pair of planes (8) was or still is installed near the bow. Its purpose is depth control (and faster diving). This is similar to that of a canard-type airplane (see in the “longitudinal” chapter). It must be assumed, however, that these forward planes made the boats unstable in pitch. Three men were required, accordingly, to main­tain position and direction of motion, by means of manual control of planes and rudders. — For practical reasons, the forward planes had to be retractable. Be­ginning with the nuclear-powered “Skipjack”, and also in the “Washington” class of United States submarines, the conning tower was moved forward somewhat, and a pair of “fairwater planes” attached to its sides. The tip to tip span of these planes does not exceed the beam of the hull.

HYDRODYNAMIC LIFT

Figure 2. The influence of a “wall” gap upon the “lift angle” of a control surface (l, c).

CONTROL FLAPS. Any control surface or fin as des – scribed above, is bound to start cavitating, at higher lift coefficients in a rolling sea. The use of a trailing edge flap is therefore desirable, providing the foil section with camber. We might even use a fixed fin with a servo – controlled flap. Half of the horizontal tail surface of an airplane shown in figure 3, is a good example for marine application. The thickness ratio at the root is t./c = 150/o (to withstand the large forces and bending moments in water) and the thickness is located at 47°^ of the chord (believed to be desirable to postpone cavitation). At the low Reynolds number Rc = 2(10) , the maximum co­efficients are CL< = 0.73 for the plain surface at ex = 15°, and 0.67 when deflecting the flap to 25° at c* = zero. Considering, however, the motion of the water against the fin, possibly at an angle of cx = 12°, the maximum lift of the flapped surface corresponds to CL< =1.1. Torque or hinge moments of the flap can be found in the “control” chapter.

a) Windsor, 4 Surfaces, Md Tunnel Rpt 320 (1961).

b) Whicker, Family of Fins, DTMB Rpt 933 (1938).

c) Windsor, With Gap, Univ Md Tunnel Rpt 453

d) Chaplin, Edge Ahead, TMB Rpt 944 (1954).

e) Windsor, Collection of Data, Univ Md Rpt 15*62-1.

(2) Chadwick, Mechanics of Roll Stabilization Fins with 53 References, Trans SNAME 1955 p 237; also “Wanderer” Trials, Sperry Gyroscope Rpt 1956.

(3) Saunders, Hydrodynamics in Ship Design (1957):

a) Volume I, Fluid Flow, Interactions, Hydrofoils.

b) Volume II, Fundamentals, Resistance, Design.

c) Volume III, Maneuvering and Wavegoing (1965).

d) Van Lammeren “Resistance-Propulsion-Steering” 1948.

RUDDER TORQUE. In wings, the pitching moment is primarily of interest for logitudinal stability and control. In rudders, this moment and/or the center of the normal forces represents the hinge moment or torque. As quoted, for example in (l, b), the center of pressure of the linear component of lift is at a distance from the leading edge (at the mean aerodynamic chord)

x/c = – (dCm./dCL) = 0.5 – (2 + V Az + 4 )/4(A + 2)

where the dot (•) indicates that the moment is defined about the leading edge. This function is plotted in figure

4. For example, when placing the stock at x/c = 0.15 of a rudder with A = 1, the torque is expected to be near minimum. Of course, at higher angles of deflection, and in smaller aspect ratios, the non-linear component contributes to lift. Its center may be at x/c – 0.7 of the lateral or lower edge of surface or rudder. As a conse­quence, a turning-back component of moment will de­velop. Such a moment is definitely present at really high angles of attack or deflection, where the flow is separated (stalled). Since forces in this condition are not steady (they fluctuate considerably) they are usually not tested in tunnel investigations as in (1). Reference (l, b) sug­gests, however, that at angles around 30° , the center of pressure is around 50^ of the chord, for a lift coefficient as estimated in figure 1. In conclusion, it is not possible to locate the stock of a rudder in such a manner that the torque would be near zero under all conditions of operation.

HYDRODYNAMIC LIFTПодпись:FAIRING. Rounding the lateral edge of a control surface, or the lower edge of a rudder, reduces slope and maximum of the lift. It should be noted that in figure 1, the lift coefficients are referred to one and the same area (without the fairing). Considering area and aspect ratio, the loss – of lift due to round edge shape is as de­scribed in the “wing” chapter. When using half-round fairings, experiments and analysis as in (7,b) indicate that the effective span is approximately that of the trail­ing edge (Ц.). Also, the center of pressure moves forward. As shown in figure 4, the CP of rectangular wings using the 0015 (or any similar section) is then “at” the leading edge, for an aspect ratio Ц/с = 1. In terms of dCm./dC[^ = — x/c, such wings become unstable. In terms of rudder torque, rounding the lower edge re­duces its magnitude, or even renders the moment “negative.” This is confirmed by experimental results in (l, b).
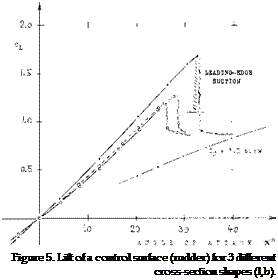
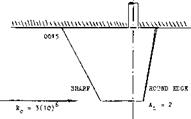
HYDRODYNAMIC LIFTПодпись: Figure 5. Lift of a control surface (rudder) for 3 different cross-section shapes (l,b).

HULL WAKE. In conventional displacement ships, the whole rudder is functioning within the wide wake behind the hull. In propeller design, the reduced speed Vw is taken into account by means of the wake fraction

“W”=(V_VW)/V (4)

The fraction is quoted (3) to be between “w” = 0.2 and

0. 4 in single-screw ships. So, for “w” = 0.3, we obtain an average Vw /V = 0.7 at the rudder, and an average qw/q ^ 0.5. Considering, however, a ship in a steady turn (such as the airship in the “slender body” chapter) the rudder will, at least on the outside of the circle, be in or at the undisturbed flow.

HYDRODYNAMIC LIFT

ІТ– і і і T

1.0


о AHEAD AS IN FIGURE 5


Подпись: 0.5" ‘ Cw = 1 .2 sin<y

Подпись: ~U 10 HYDRODYNAMIC LIFT

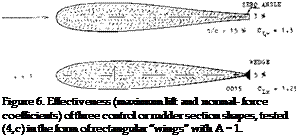
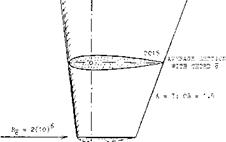
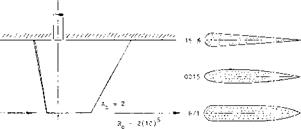
FOIL SECTION. Three cross-section shapes are shown in figure 5. As found in the “control” chapter, a straight and thin trailing “wedge” produces the highest lift. Other experimental rudder section shapes are presented in figure 6. It is seen again that a thin and straight (or hollow) trailing end improves the maximum lift. It is also expected that simply giving the 0015 section a blunt trailing edge, will increase effectiveness.

_)——– )———– 1—– >-

2o зо 4o

ANGLE OF ATTACK OC0

Figure 7. The “lift” of a rudder (or control surface) tested in astern direction (l, b).

ASTERN. Ships may also have to maneuver in the astern direction. The rudder is then exposed to full dynamic pressure (whatever there is at low speed). Figure 7 shows that the maximum force coefficient may be reduced to half of that in the forward direction.

SLIPSTREAM. Maneuverability of ships is evidently not sufficient, using rudders of the 2°i° size mentioned above, under “rudders". Usually, therefore, the rudder is placed in the middle of the propeller slipstream. Deflection of this stream provides steering even at ship speeds close to zero. As reported in (4,b) the following rudder-force ratios were observed:

0. 4 in the hull wake as against free flow

1. in wake, but with propeller, as against free flow 2.4 in slipstream as against without propeller 1.9 ditto, but in a steady turn

All these tests were made at a ship speed corresponding to Ej around 0.15. The 2.4 ratio is at the beginning of a turn, while in a steady turn (1.9) the angle of attack is naturally reduced (see the airship again). Statistical results are also listed in (5,c). The 180° turning “diame­ter” is in the order of “d”// = 3, for ships with the rudder in the propeller stream; and it is “d”// = 4 or larger, with a single rudder between twin screws. [66] [67] [68] [69] [70] [71]

COURSE STABILITY. Considering the hull of a ship to be the lower half of a streamline body, its destablizing moment can be estimated on the basis of what is said in the “streamline body” chapter. The moment corresponds theoretically to

Cm = ‘M’/qV = к sin(2cx) ^ 2k cX ^ 2 c< (5)

where к is in the order of 1.0, for more slender shapes. As such, the moment is proportional to the displacement volume V or the displacement weight Д. Consider, for example a freighter with

і = 400 ft overall length

V = 9000 tons displacement weight

V = 300,000 ft3 displaced volume

SR = 200 ft2 rudder area

The destabilizing moment may thus correspond to

‘M’/’q = 0.5 (2 V /3V/180) ^ 5,000 ((3°)

where (3 = angle of yaw, and 0.5 accounting for the heavy wake at the stern. The moment has to be bal­anced by that produced by devices such as fins, skegs, rudders at the stem of the hull. The stabilizing moment is proportional to rudder area (S^) times moment arm (x) to the CG. For the freighter considered above, with the CG or CB assumed to be at 0.4 of its length, the stabilizing moment is tentatively

‘M7q = – (1 – “w”)ftSR0.5/(dCL/d(3)(3 (6)

For “w” = 0.3. and (dCL/d(3°) = 1/20°, we obtain ‘M’/q = 1100 This is far below the destabilizing value.

We can assume, however, that the propeller provides stabilizing lateral forces. The hull itself (particularly whenTiaving a “V”, rather than “U” shaped stern) may also contribute to stability. Finally, the assumption of a moment arm equal to 0.55 (to the CG) may not be cor­rect in dynamic analysis. Rather the ship can be assumed to yaw aboht a point ahead of the CG, which means that the ship is also drifting (in lateral direction) or side­slipping, when yawing. The extreme of this combination is found in steady turns (5,a). The point about which the ship is yawing, is thus ahead of the CG. Assuming that the point might be near the bow, we arrive at a stabiliz­ing moment which might be sufficiently large. Neverthe­less, ships are known to go all across the Atlantic with their rudders correcting the course continuously by means of plus and minus up to 5° deflections. Airships are reported to have been unstable; and it should be noted that their Frounde number was similar to that of ships, insofar as their density (in lb/ft3 of displacement) was equal to that of the surrounding fluid, just as in the case of ships.

LIFT ABOVE THE CRITICAL MACH NUMBER

Deliberately, or in emergency situations, airplanes designed for subcritical conditions may be flown at, and get into, speeds appreciably higher than the “‘critical”. Character­istics of straight wings up to M = 1 are therefore, pre­sented as follows.

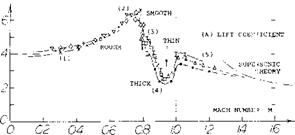
Shock Stall Considering again the expanding flow in a Laval nozzle, that flow breaks down when the geometric expansion is too long or too steep. In the case of an airfoil at some angle of attack, this means that the boundary layer separates from the trailing edge and recompression takes place across a stronger shock (phase 3). When all of this happens suddenly, the drop in the lift coefficient is equally sudden. Such a drop is seen in figure 16(A) at M =

0. 8. As reported in (6,g) shock and separation may also fluctuate back and forth; in other words, the flow pattern is not stable. In region (3), there is a discontinuity recog­nized in the variation of the longitudinal moment (to be discussed later).

LIFT ABOVE THE CRITICAL MACH NUMBERFlow Around the Leading Edge. As pointed out, particu­larly in the first section of this chapter, upon exceeding the “critical” Mach number, forces and moments usually do not break down at once. In fact, in lifting symmetrical sections a strongly negative pressure gradient developing around the leading edge favors the boundary layer flow, leading it around the edge. To understand the flow pat­tern and the development of forces and moments, a se­lected number of chordwise pressure distributions is pre­sented in figure 15. In what is called phase (1), the pressure distribution is essentially as in incompressible fluid flow, with a pressure peak and a continuous increase of the upperside pressure toward a slightly positive value at the trailing edge.
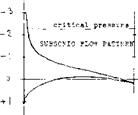
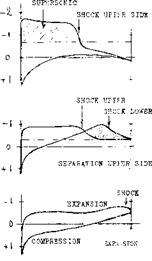
Supersonic Expansion. In figure 15, horizontal lines indi­cate the critical pressure level, as calculated using equation

7. It is evident that in phase (2) speeds are present appreciably above the local velocity of sound. An expan­sion takes place around the leading edge, similar to the Prandtl-Meyer type as in supersonic flow (l, a) extending to almost 50% of the chord. The average pressure co­efficient is Cp = —1.3, in the example shown. It is this negative pressure obtained by expansion, rather than the Prandtl-Glauert mechanism, which produces the peak of the lift coefficient in figure 16. Recompression from Cp = — 1.3, first to —0.3, takes place through a mild shock. It must be noted that a further subsonic recompression develops in much the same manner as at lower Mach numbers, ending in a positive Cp = 0.3, at the trailing edge. As shown in Chapter XV of “Fluid-Dynamic Drag”, divergence of the drag coefficient may be delayed over an interval of AM = +0.1 or 0.2. While such delays may at first be harmless, less desirable changes take place in the phases described next. [61] [62] [63] [64]

LIFT ABOVE THE CRITICAL MACH NUMBER

Figure 14. Pitching moment due to deflection of a control flap, tested (14,b) on the half-span model of a wing having an aspect ratio of 4.5.

(11) Minimum pressure peaks on airfoil-section noses (theory):

a) Kochanowsky, Pressure Distributions, Yearbk D Lufo 1940 p 1-72.

b) Weber, Suction Peak on Sheared Wings, RAF, TN Aero – 2587 (1958).

(12) Small aspect ratio wings as a function of M’number:

a) Nelson, 65-210 Wings With A = 1 to 6, NACA RM A1949K18.

b) Allen, In Combination With Bodies, NACA RM A1953C19.

c) See references (9,a, e) with A’ratios of 0.5 to 6.

d) Smith, Delta Wing With Body, NACA RM 1950K20 & K21.

e) Squire, Ogee Wing With Body, RAE ARC C’Paper 585 (1959).

LIFT ABOVE THE CRITICAL MACH NUMBERПодпись:Подпись:LIFT ABOVE THE CRITICAL MACH NUMBERMinimum Lift. While on the upper side circulation is lost as a consequence of separation, a flow pattern similar to that on the upper side as in phase (2) develops along the lower side. An expansion takes place from the stagnation “point” toward the trailing edge. Negative pressure and negative lift grow considerably, thus reducing the re­sultant lift coefficient. The coefficient drops to less than half its peak value in this phase (4). In thicker sections (with well rounded lower side, not included in figure 16) the negative lift component can be such that the resultant lift is zero, at the constant angle of attack shown.
PHASE (1) "SUBSONIC"

64АОЮ (16,e) M = o.5

CL = 0.63

PHASE (2) LIFT PEAK

64A010 (16,e)

M = 0.75 CL = o.77

PHASE (5) "SUPERSONIC" 16-009 M =1.0 CL = 0.6

“Supersonic" Pattern (phase 5). As the Mach number is further increased, the shock at the upper side moves rapidly toward the trailing edge. The lift-reducing “loop” as in phase (4) of figure 15 disappears; and the lift recovers to some extent. At and above M = 1, a supersonic type of pressure distribution is obtained. As shown in figure 16, the lift coefficient approaches from there on, the function as indicated by supersonic theory. Expansion (on the upper side) and compression (on the lower side) also mean a considerable increase of the drag.

Center of Lift. The pitching moment can be presented in the form of the location x = distance from the leading edge of the center of lift (or normal force):

x/c = 0.25 — (С т/ц /CL ) (21)

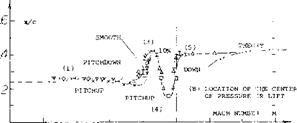
Within the completely subsonic phase, nothing happens to the moment, excepting the increase of Cmo due to cam­ber as stated in the second section of this chapter. Within the still “subsonic” phase (1) part (B) of figure 16 indi­cates a modest pitchup tendency. At a Mach number some­what below that where the lift coefficient reaches its peak, the center of lift has moved forward from x/c = 26% to some 23%.

Pitching Down. In phase (2) as in figure 15, the center of lift is evidently farther back than in (1). Figure 16(B) shows that this movement continues into phase (3) where the center is at x/c = 40%. The corresponding nose-down pitching moment could lead an airplane into a dive from where recovery is no longer possible.

Pitchup. The negative lift developing at the lower side, as in phase (4) of figure 15, evidently causes the far-forward locations, as indicated in figure 16(B), around M = 0.95. In an airplane with a straight wing, this change may mean not only pitching up, but also a dangerous loss of longi­tudinal stability (stalling). It is particularly in thicker sections (such as 0015, which is not shown in the graph) that negative pressures near the trailing edge of the lower side cause and/or aggravate the pitchup.

Q3) Lifting characteristics of slender bodies:

a) Taylor, Parabolic Blunt-Base Bodies, NASA TN D-14 (1959).

b) Stivers, Various Elliptical Cones, NASA TN D-1149 (1961). [65]

(16) Airfoil characteristics at transonic Mach numbers:

a) Ladson, Several 64-Series Airfoils, NACA RM L1957F05.

b) Spreiter, Transonic Similarity Laws, NACA TN 2273 (1951).

c) Ladson, 16-Series Pressure Distributions, NASA Memo 6-1-1959L.

d) Crane, Wings With Aspect Ratio of 8, NACA RM L195 lD24a.

e) Stivers, Pressure & Forces 64A Series, NACA TN 3162 (1954).

Approaching M – 1, the flow pattern assumes a. character similar to that at supersonic speeds. That is, expansion and attached flow are restored at the upper side, in this phase (5). As seen in figure 16(B), the center of pressure moves to the rear, ending up in a stable position slightly aft of x/c = 40%.

V

64-008

(6, c )

и 64-010

(6,h)

4-

64-010

(6, c )

I 65-010

(16,d)

0 64-012

(6,c)

Q 64A009

(6,d)

X

0 0 09

(6,e)

Д 65A009

(16,a)

0

0 0 12

(6,e)

• 0 0 12

(16,a)

64A010

(5, d)

– 63A010

(9, c)

LIFT ABOVE THE CRITICAL MACH NUMBER

63A009 AIRFOIL SECTION

LIFT ABOVE THE CRITICAL MACH NUMBER

C Q2 04 06 08 Ю!2 14 16

LIFT ABOVE THE CRITICAL MACH NUMBER

Figure 16. Lift and center of pressure of various symmetrical foil sections from subsonic through transonic M’numbers, at constant angle of attack o( =4°.

Transonic Flight. The graphs in figure 16 were prepared for ol = constant := 4 .In actual flight, the lift (in lb or newtons) would remain constant, when advancing in steady horizontal flight toward the sonic speed. The lift coefficient would thus vary roughly as C L ^ 1/M2. Quali­tatively, however, the changes of lift and pitching moment would remain as described, including the up-down-up vari­ations as in figure 16. These variations are undesirable and dangerous. The conclusion might thus be that conven­tional “subsonic” wing sections are not suitable at all to be used at transonic speeds. It is possible, however, to reduce the up-down-up variations through the use of

wings with small aspect ratios,

wing sweep in combination with area rule applied to the fuselage,

airfoil shape (thickness ratio, nose radius, trailing edge angle).

It is shown in (9,f) for example, how in small aspect ratios, the lift drop may reduce to nothing, as the thick­ness ratio is reduced from 12 to 4%. It is also shown, for example in (9,c, e)> how a wing with A = 4 and t/c = 6%, gets comparatively smoothly through the sonic speed range. There is one change, however, which cannot be avoided in ordinary wings; that is the transfer of the center of pressure or lift, from x/c ~ 25%, at least to some 40% as at supersonic speeds. The planform most perfect in this respect (theoretically not exhibiting any difference at all) is the delta shape; see Chapter XVIII.

(18) Aereas of supersonic flow are investigated or stated:

a) Подпись:In Chapter XV of “Fluid-Dynamic Drag”.

b) By Goethert as in Reference (6,g).

c) von Karman, Transonic Similarity Law, J. Math Phys 1947

p 182.

d) The maximum local Mach number obtained, before the flow over the upper side breaks down (separates), is stated (b) to be in the order of 1.4 or 1.5.

. STRAIGHT WINGS AS USED IN HIGH-SPEED AIRPLANES

The influence of compressibility on the characte ristics of wings, and considerations when using them in airplanes, are different to a degree from what is presented on airfoil sections.

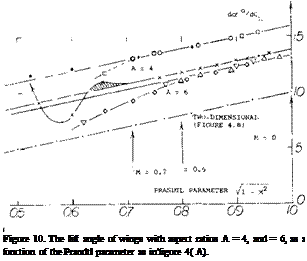
Lift Angle. Applying the Prandtl-Glauert rule to the sec­tional component of the angle of attack (as in flgure 4) the “lift angle” of wings with higher aspect ratios (say above 4) as presented in the “wing” chapter can be formulated as follows:

doC/dCu =1о7ГПмГг + (К/A) (16)

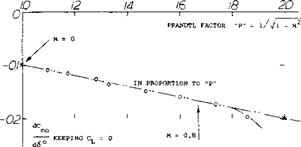
where К = 20 or somewhat larger, and VI—M :: 1/“P”. Experimental results of wings with higher aspect ratios are plotted in figure 10, as a function of this parameter. A straight-line function is thus obtained for equation (16). For A = 6, agreement is found above 71 — Мг = 0.8, that is at M’numbers below 0.6. The experimental points for the wing with A = 4, can be matched by the equation when using the constant К = 24.

. STRAIGHT WINGS AS USED IN HIGH-SPEED AIRPLANES

Smaller Aspect Ratios. In order to include aspect ratios, say below A – 4, the formulation as in (10,a) is preferable. To take compressibility into account, the parameters to be plotted are

(10° (dCL /doc)//1 – M*>
and

(“F” = A /1 – M2 /0.9) (17)

where 10 = (2тс/а)(rr/180). The function of the Prandtl factor “P” – 1 / 71 -M2 can be understood to be that of increasing the effectiveness a = CL<*/2 7Ґ. This ratio is increased from about 0.9 to (a “P”). In a formulation similar to that in (10,a):

(dCL /doc )/(0.1 f Мг) =

“F’7(2 + Of,7+ 4~) (18)

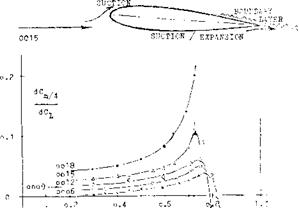
where “F” as in equation (17) contains the Mach number. Available experimental results are plotted in figure 11 with the results at M’numbers above the critical excluded. Since the value of the modified aspect ratio “F” is a function both of the geometric ratio and the Mach num­ber, confirmation of the influence of compressibility is not directly evident. Examination of individual points seems to show that lift-curve slopes at higher Mach num­bers tend to be slightly higher than expected. On the other hand, airfoil sections (5,h) such as 0015 and 0018, also lose lift as a consequence of an area of high-speed flow (suction as indicted in figure 8) developing not only on the upper, but also on the well-rounded lower side. Negative pressures of this kind are shown in (5,f & g), while at the same time boundary-layer losses are growing along the upper side (incipient separation from the trailing edge). Wings with such sections are not included in figure 11.

. STRAIGHT WINGS AS USED IN HIGH-SPEED AIRPLANES

AT cx = 4 AND M

Подпись:Подпись:The lift coefficient of a slender cone, at constant of – 12 , is plotted in figure 12 as a function of Уі — M. Here, as in the evaluation of other bodies (13) with aspect ratios between 0.3 and 0.6, it is found that the modified factor gives good results matching the experimental differ­entials of the lift coefficient. Of course, somewhere around M = 0.9, the factor (approaching infinity at M = 1) should no longer be expected to be applicable.
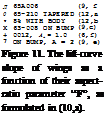
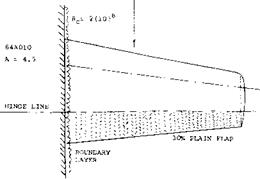
Tail Surfaces. Tail surfaces, horizontal or vertical, are basically “wings”. Elevators and rudders are trialing-edge flaps. The lift-curve slope of tail surfaces is influened by the fuselage (to which these surfaces are attached) and is accounted for as explained in the “control surface” chap­ter. It can be expected (dot /d6) their effectiveness may remain unaffected by compressibility. This means that the lift due to flap deflection increases with the Mach number at the same rate as (dCL/dctf). The lift angles of a particular surface are plotted in figure 13. The line through the (d6/dCL ) data happens to have ordinates 1.5 times those through the (doc /dCL ) points. Therefore, dot /d6 = 2/3, a ratio which for a 30% flap is at the upper limit of what is shown on figure 2 of the “control” chapter.

. STRAIGHT WINGS AS USED IN HIGH-SPEED AIRPLANES

10 (dCL/dc*

Lifting Bodies, such as cone-cylinder combinations or fuselages can be considered to be low-aspect ratio wings. Even though their lateral boundaries are well rounded, we can assume that at aspect ratios well below unity, their linear lift component corresponds to

(dCu/dor ) ^ A (19)


IN TWO-DIMENSIONAL FLOW


°) fl – M2


Подпись: "F" = ASPECT RATIO PARAMETER Jl - M2 A/0.9 О / 2 3 ~4 . STRAIGHT WINGS AS USED IN HIGH-SPEED AIRPLANESПодпись: Л 65A006 (9, f ) 0 65-210 TAPERED (12,a) • 8% WITH BODY (12,b) X 63-008 ON BUMP (9,c) + 0012, A± = 1.0 (6,f) 7 ON BUMP, A = 2 (9, e) Figure 11. The lift-curve slope of wings as a function of their aspect-ratio parameter “F”, as formulated in (10,a).

as in figure 11, without any influence of compressibility. However, it is not known yet how the second, non-linear component as presented in the “body” chapter may vary as a function of the Mach number. Since a slender wing is closer to a three-dimensional body than to a lifting line, it is suggested to use the modified Prandtl factor as derived from (3,f) in chapter XV of “Fluid-Dynamic Drag” in the simplified form of

“P” = i /УГЛА (20)

Подпись: (8) Riegels, “Aerodynamische Profile”, Oldenbourgh Germany 1958. Experimental results as in (6,e,f) are listed in this book.

Control Flap. The pitching moment produced by a flap (keeping Cl. = zero) is shown in figure 14. It varies in proportion to the Prandtl-Glauert factor (equation 6). The value extrapolated to “P” = 1, which means M = 0, agrees with those plotted in figure 4 of the “control” chapter. The hinge moment of the flap is also tested in (14,b). At deflections below 6=7, this moment is found to be independent of the Mach number. At 6 above 8 , it seems to increase in proportion to “P”. All moments considered continue to grow (or they remain constant, as the case may be) for some interval beyond the critical Mach num­ber. Pressure distributions as in (14,b) show the peaks as suggested in figure 14. Depending upon lift coefficient and flap deflection, the critical Mach number can thus be encountered either at the leading edge, or in the vicinity of the maximum thickness, or around the hinge line of the flap.

. STRAIGHT WINGS AS USED IN HIGH-SPEED AIRPLANESПодпись:Wing Flaps “always” cover only part of the span. Their characteristics can be considered in terms of two – dimensional flow, that is in reference to the airfoil section from which they are deflected. It is suggested to use the principle as demonstrated in figure 13, together with the part-span function as in figure 21 of Chapter V, to de­termine the lift-increasing effect of wing flaps. This pro­cedure amounts to increasing lift and lift-curve slope in proportion to the Prandtl-Glauert factor. The span wise lift or load distribution is particularly treated in (10,b).
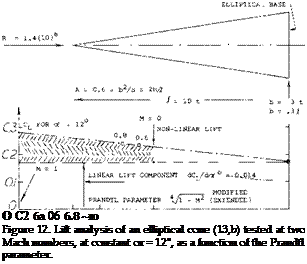
Подпись:Critical Lift. Airplanes flying at high speeds normally operate with reduced lift. Consider an airplane cruising at M = 0.8, at 9 km or 30,000 ft. At this altitude, the speed of sound is reduced to 0.9 of that at sea level. At the same time the atmospheric density is reduced to less than 40%, so that the lift coefficient required to support the craft may be between 0.3 and 0.4. Under these conditions, with a Prandtl factor “P” = 1/0.6 = 1.7 or higher, the minimum pressure at the suction side may be between that as indicated by equations (10) and (11), say C pmm = -0.25 —0.25 = —0.5; and that as in figure 6, say Cpmjn = —1.0. The critical Mach number is 0.7, accordingly, for a proper­ly cambered section; or Mcnt = 0.6 for a symmetrical section. In conclusion, the permissible M’number can be below the 0.8 as assumed above. Of course, with 30 of sweep, the 0.8 is reduced to an effective value of 0.8 cos30P = 0.7; see the Chapter XV on swept wings. [60]
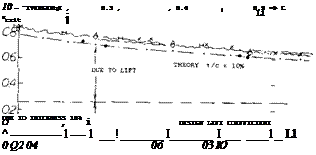
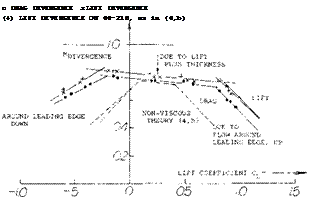
INFLUENCE OF COMPRESSIBILITY ON AIRFOIL SECTIONS

In two-dimensional flow patterns, there is basically less cross-sectional area available than around three – dimensional bodies, into which air particles and stream tubes can be deflected. As a consequence, airfoil sections are particularly sensitive to compressibility.

Prandtl-Glauert Factor. As explained in Chapter XV of “Fluid-Dynamic Drag”, or in (l, a), the influence of com­pressibility upon the positive or negative static pressure differences along the sides of slender airfoil sections and upon the resulting load (lift) is essentially the same as that of an increase of the angle of attack. Therefore, in two – dimensional flow, pressure and lift coefficients increase (at least in good approximation) in proportion to the Prandtl-Glauert factor as in equation (2).

Pressure forces of lifting airfoil sections are plotted in figure 3. It is seen that lift coefficients, and the lift-curve slope grow in proportion to 1//9. It can also be concluded from this graph, and equation 2, that at M = 0.2, the influence of compressibility is comparatively small; the factor is 1 //З = 1.029. For example, the number of an airplane taking off or landing at sea level at 100 knots, is M = 0.15. Compressibility can, therefore, be disregarded in many realistic conditions, as it is in most of the chap­ters of this text. However, at M = 0.6, lift and other coefficients are expected to be 25% increased. Such incre­ments are not found, however, in airfoil sections with thickness ratios above some 14%. For example, the 0018 section as tested in (6,f) exhibits a derivative (dCL /dec,) = 0.083, which remains constant up to M = 0.6. Increased and futher increasing viscous losses in the flow over the upper side are evidently responsible for this result.

(3) The Prandtl-Glauert rule is presented and improved:

a) Glauert, presented in ARC RM 1135 (1927); see a. so (l, c).

b) von Karman, Compressibility in Aerodynamics, J. Aeron Sci 1941 p 337.

c) Kaplan, On Lifting Elliptical Cylinder, NACA Rpt 834 (1946).

d) Kaplan, Transonic Similarity Rules, NACA Rpt 894 (1948).

e) Mathews, Pressure Distribution on Bodies, NACA Rpt 1155 (1953).

f) Goethert, Modification for Bodies, Ybk D Lufo 1941 p 1-156; NACA TM 1105.

(4) Characteristics of cambered airfoil sections:

a) See 66-Series Airfoils in (5,a) and 10% Sections in (5,e).

b) Graham, 66-210 Airfoil Section, NACA TN 1396 (1947).

c) Stack, 4412 Airfoil Pressure and Forces. NACA Rpt 646 (1939).

d) Becker, 23012 Airfoil Section, NACA W’Rpt L-357 (1941).

0 Lindsey, 24 Airfoils 16-Series to M = 0.8, NACA TN 1546 (1948).

g) Summers, 64AX10 Series Airfoils, NACA TN 2096 (1950).

h) Van Dyke, 16 Six-Series Airfoil Sections, NACA TN 2670 (1952).

do(JdCL = loVl —M^ (8)

This function is essentially confirmed in figure 4. For example, at M = 0.6, the angle of attack required to produce a certain lift coefficient is 20% smaller than at M -^-0. In both graphs, the experimental points are seen diverging from the theoretical function, at about M = 0.7, or at /l — M2 = 0.7. The critical Mach number has been reached in this case (for example by the 0012 section, at C L = 0) and the lift is higher, or the angle of attack lower, on account of a supersonic expansion along the upper side, when lifting.

The Minimum Pressure of a symmetrical airfoil section at zero lift in incompressible fluid (such as water, or in air at low speeds) is approximately

Срт, п=-2№) 0°)

where x = distance of the maximum thickness from the leading edge. Provided that the airfoil sections has proper camber, Chapter II, the negative pressure due to lift corre­sponds approximately to

Cpmin = — 0.7 CL (11)

These empirical functions are taken from the “hydro – dynamic” chapter of “Fluid-Dynamic Drag”. In the case of foil sections with thickness location between 30 and

in symmetrical airfoil sections exposed to incompressible fluid flow. As explained in Chapter II, the nose radius is

r/c = (r/t)(t/c) = (rc/t2 )(t/cf (15)

Л FROM LIFT DIVERGENCE О FROM DRAG DIVERGENCE X POINTS ABOVE CLi О Mcrit FROM PRESSURE (5,e)

H FROM DRAG DIVERGENCE (4Л 16-009

Подпись:Подпись:Подпись: CПодпись: pmi n

Figure 5. Experimental drag and lift divergence Mach numbers of a family of cambered 64AX 10 airfoil sections (6,g) as a function of their design lift coefficients.

Leading Edge. The correct camber for CL = 0.5 would theoretically (see the “airfoil section” chapter) be around 4% of the chord. Such a section would not be considered to be practical for high speed wings. Camber in the order of 2% was often used in airplanes, say around 19^0. Even such modest camber is not very desirable in high-speed airplanes because of pitching and wing-twisting moments. Symmetrical sections may thus be preferred. When lifting, very high peaks of velocity and minimum pressure are developing around the nose of such sections. Regardless of section thickness (within conventional limits) these pres­sure peaks are theoretically a function of the nose radius r. As pointed out in (11) the peak is expected to corre­spond to

— /(r/c) [59]
where (rc/t2) = constant in a family of similar sections. For example, (rc/t2) = 1.1 in the 4-digit series of airfoil sections, and ~ 0.07 in NACA’s 64-series. Pressure distri­butions are reported, for example around the 64A010 section in (5,d). At lift coefficients somewhat above 0.2, this section develops a pressure minimum above the lead­ing edge. At higher lift coefficients, this minimum grows into a very sharp peak. For example, at Cj_ = 0.6, the coefficient is Cpm(n ^ —2. Various experimental results are plotted in figure 6, as a function of CL. This part of the theoretical prediction as in equation (14) is thus confirmed. Because of viscous losses in the flow around less rounded edges, very high pressure coefficients (pro­portional to 1/r, as in equation 14) do not come true, however. Rather, the minimum pressure coefficient is statistically found to be a function of CL /(t/c), as noted in (20).

Divergence. Below C{ = 0.2, the 64A010 section men­tioned above, develops two pressure minima, one due to thickness and lift (near the location of maximum thick­ness) and one due to lift at or above the nose. The same two minima and the subsequent divergent Mach numbers (where drag and lift diverge from their steady variation, the drag rapidly increasing and the lift decreasing) are found in figure 7. the close-to-horizontal lines correspond to those in figure 5, while the two lateral branches repre­sent the flow around the leading edges as in figure 6. The CL level of the “bucket” corresponds to camber or design lift coefficient. The CL size in terms of upper and lower limit is larger in thicker sections, and smaller in thinner ones.

(6) Airfoil Sections as a function of Mach number:

a) Nitzberg, With 6 to 15% Thickness Ratio, NACA RM A1949G20.

b) Berggren, Leading-Edge Radius and Thickness, NACA TN 3172 (1954).

c) Wilson, 6 to 12% Sections 64-Series, NACA RM L1953C20.

d) Daley, Various Sections in Open Tunnel, NACA TN 3607 (1956).

e) Goethert, Airfoils in the DVL Tunnel, ZWB Rpt FB-1490 (1941); see Canadian Nat Res Laboratories Translation TT-31 (1947).

0 Goethert, In DVL Tunnel, Lilienthal Rpt 156 (1942); NACA TM 1240.

g) Goethert, Airfoils and Wings, Wright Field Lecture Notes 1948.

h) Loftin, 10% Thick Airfoil Sections, NACA TN 3244 (1954).

Подпись:Pitching Moment, As explained in Chapter II, the longi­tudinal moment consists of two components, one due to camber and one due to lift. Both of them could be expected to grow according to the Prandtl-Glauert rule, that is in proportion to the pressure differentials and the lift arising in an airfoil section. As shown in (4,h) such variation of the moment due to camber (corresponding to Cu = 0.2) may actually take place. Other sources (4,d, f,g)(12,a) show essentially constant CmQ values, par­ticularly for the 230 series (8), while airfoils tested be­tween wind-tunnel walls (4,g)(6,b) exhibit rather irregular variations at higher lift coefficients and higher Mach num­bers. If in doubt, the Cmo values grow somewhat in negative direction (nose-down) as the M’number is in­creased. The growth is restricted, however, by increasing viscous losses.
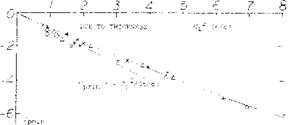
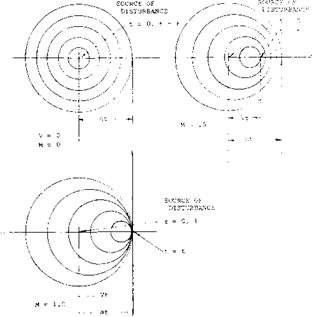
Pitching Due to Lift. It is known (see figure 30, Chapter II) that contrary to theory, the longitudinal moment due to lift grows progressively more positive (or less negative) as the thickness ratio is increased. Because of viscosity (boundary layer) thicker sections lose lift on their upper side, and this loss is made up by increased suction. around the leading edge. As seen in figure 8 the “one-sided thickening of the boundary layer” evidently increases, together with the Mach number. The static stability derivative (dCm,/dCL ) increases in positive direction (par­ticularly in thicker sections), which means a reduction of static longitudinal stability (pitching up). As a conse­quence of section losses around the leading edge, really

thin sections such as 0004 in (4,b) exhibit ————– Cm

values, hardly affected by the Mach number. Since CL increases at the same time, their derivatives (dCm /dCL ) reduces as the M’number is increased.

INFLUENCE OF COMPRESSIBILITY ON AIRFOIL SECTIONS

-8L і I! f I I I _

О 64A010 45° YAWED WING {5 , о ) "SWEPT " ОНА ‘:’TER

0 0015 AND 18 SECTIONS (6,e, i:)

Л ОООЭ AND 12 SECTIONS (6,e)

X 0006 AND 9 SECTIONS (6,1)

+ 64A410, 64A006 AND 10% (5,d}

Figure 6. Kvaluation of minimum pressure coefficients around the leading edge, primarily of symmetrical airfoil sections.

Figure 7. The critical and divergent Mach number of the 63-210 and 64-210 airfoil sections (6,h).

Sharp Leading Edges are used in airfoil sections intended to be flown at supersonic speeds. One and the same series of 6% thick symmetrical sections are investigated in (7,a) and (7,b). Around a’ =0, and CL = 0, the lift-curve slope is highest in the 0006-63 section. However, as listed in figure 9, at ex’ = 4 , the normal force coefficient is practically the same for all 4 sections shown. Also, the Mach number at which the maximum lift coefficient (near stalling) is obtained is essentially the same (M = 0.8) for all sections. Although CLX is lower than for rounded edges, the flow manages to get around the sharp edges. In fact, at M = 0.4, the pressure distribution is basically the same in all 4 sections. At higher Mach numbers (say above 0.6) an area of supersonic flow develops, starting near the leading edge and eventually collapsing by way of a shock (sudden compression) at a location between 40 and 60% of the chord. The minimum pressure coefficients are in the order of Cpmm “ —1.7 at M around 0.7, independent of the nose radius. The largest differences are found in the drag coefficient, which grows (at or = 4 ) from 0.010 to 0.035, as the nose radius is made smaller and smaller (reduced from round to sharp). In conclusion, in the subsonic speeds range sharp-edged sections are not very efficient. They do develop lift, however; up to and above M =0.8. The angle of attack for stalling separation from the upper side when approaching Clx reduces from 9 or Uf at M = 0.4, to 7 or 8° at M = 0.8.

INFLUENCE OF COMPRESSIBILITY AT SUBSONIC SPEEDS

The Speed of Sound. The propagation of small dis­turbances of pressure, such as sound waves, occurs at the speed of sound which is given by

a[58] = l/(dp/dp) = (dp/dp) =

compressibility in (km /kg) 0)

Since in a perfect gas, p ^ ^ , where к = 1.4 in air, the speed of sound is

a = к р/р = к “R” T ~ 20 T(°K) (2)

where “R” = “gas constant” = energy (kg m/sf ) per kg and (°K) = 29 in atmospheric air up to some 90 km of altitude. The speed thus increases with temperature. This means as well as others, that around a stagnation point, the speed (particularly in upstream direction) is increased, while in an area of reduced pressure (such as along the suction side of an airfoil) that speed is somewhat reduced.

INFLUENCE OF COMPRESSIBILITY AT SUBSONIC SPEEDS

The compressibility of water is negligibly small for all speeds of vehicles (ships, boats, torpedos) even it they can go faster than 50 knots. Disregarding supersonic speeds, the compressibility of air (2) is so much greater that its influence upon aerodynamic characteristics must be taken into account at higher subsonic speeds.

1. PRINCIPLES OF COMPRESSIBLE FLUID FLOW

In a compressible fluid the propagation of pre ssure re­quires a finite amount of time to travel a given distance from the point of disturbance. This time is required as the disturbance travels at the local speed of sound relative to the body rather than instantaneously as assumed in in­compressible flow. When the flight speed approaches the speed of sound the finite time element leads to changes in the flow pattern. This is illustrated in figure 1 showing the propagation of a disturbance moving at M = 0, .5 and 1.0. It is interesting to note how the disturbances pile up in front of the body as the Mach number approaches 1.0.

(1) Principles of compressible fluid flow:

a) Prandtl, “Essentials of Fluid-Dynamics”, London 1952.

b) Liepmann and Roshko, “Elements of Gasdynamics”, Wiley 1957.

c) Liepmann & Puckett, Aerodynamics of a Compressible Fluid, Wiley 1947.

Impact Pressure. In considering the characteristics of com­pressible flow it is instructive to examine isentrcpic chan­nel flow (l, c). If we consider a body at rest and the flow impinging on the body issuing from a reservoir, as illus­trated in figure 2, it is possible to find relations in pres­sure, local speed of sound and density of use At the ultimate limit of subsonic flow where the local Mach number is 1.0 the following ratios are obtained:

Подпись:p0/p =1.9 absolute pressure

To/Т =1.20 absolute temperature

^/p =1.58 density ratio

a0/a = 1.10 speed of sound

q0/q =1.28 impact pressure

Подпись: (4)

The subscript о in the above indicates the conditions in the reservoir, which is also the condition on impact of a Pitot tube.

The local dynamic or impact pressure q is related to the local static pressure and Mach number by the equation

q=l/2?V2 = a^pM/2 (3)

The impact pressure can also be related to the difference between the reservoir pressure and the static pressure as a function of the Mach number

pc – p/q = 1 + (M2/4) + (M4/40)

– 1.09 (CM = .6 = 1.219 @M = .9

It should be noted that the dynamic pressure used in the coefficients such as CL are still based upon the “dynamic” pressure q. This pressure

q = 0.5 p (M2) a2 = 0.5 p Vе’ (5)

(where all quantities are those in the ambient flow) is then a “potential” of the undisturbed flow, rather than a pressure differential which can directly be measured with the aid of a Pitot-static or Prandtl tube. In fact, there is some difficulty in wind-tunnel testing, in determining M’number, temperature and density.

As far as lift is concerned, the impact pressure as such is usually not considered, although it has consequences upon the pressure distribution of airfoil sections and wings (lifting or not lifting).

Prandtl-Glauert Rule (3). When approaching a wing, the air particles within a certain sheet of the stream slow’ down. They continue to be slowed down at the lower side of that wing, when it is lifting. As explained above, the pressure corresponding to reduced velocity is increased above that as expected according to Bernoulli’s law of aerodynamic (or hydrodynamic) motion. What was said about the time required for pressure to propagate, also holds for negative pressure differentials as at the upper side of an airfoil (due to thickness as well as due to lift). To explain this phenomenon, it can also be said that the air particles do not have the proper time to be deflected around the convex upper surface of a lifting wing. As a consequence, the values of all pressure differentials and of the resulting normal or lift forces, increase as a function of the Mach number. As found by Prandtl (l, a), by Glauert (3,a) and probably by others, all differentials of the pressure and lift coefficients are approximately pro­portional to the Prandtl-Glauert factor.

і ip – і / Ci — m2 (6)

In reality, 1 – 00 is never reached at M = 1, neither at the

stagnation point (where C p max = 1.28) nor at the suction side of airfoils (where vacuum is the extreme limit, with C pmin = — 1-43,’at M = 1).

Critical Velocity. We have considered static pressure above. For small variations along slender bodies or on airfoil sections at small lift coefficients the velocity differ­entials are approximately:

ZW/V = – 0.5 Cp

However, at higher Mach numbers conditions are more complicated. In this text, maximum velocity around a body or wing is of particular interest as it may locally reach the speed of sound. This speed, in turn, is a function of the temperature at the point of maximum speed (or minimum pressure). The flow around the nose and past the suction side of a lifting airfoil is the same as that through a Laval nozzle (l, a,b). At the stagnation point we have the absolute “total” or reservoir pressure p. From there, an expansion takes place. As in the smallest cross section of the nozzle, the speed of sound is reached at some point at the suction side, where p or Cp obtain their critical values, so that the local number = 1. In air, conditions at that point (subscript x) are indicated by the following constant ratios:

Px/P.

= 0.528

absolute pressure

Tx/T.

= 0.833

absolute temperature

ал/а#

= 0.913

local speed of sound

PxC.

= 0.634

density ratio

where the subscript (• ) refers to the reservoir c ondition (with V = 0) from where the flow originated (such as in the pressure tank of a wind tunnel, or in a stagnation point).

Critical Mach Number. The relations of the listed, to the “ambient” quantities in the undisturbed flow to which airfoil or body are exposed, may be found in texts such as (T, a,b). The critical Mach number is defined as that where C first reaches the critical negative value, that is where at a particular point of the surface the local speed of sound (corresponding to M^ = Vx /ax = 1) is first attained. These values of critical pressure and ambient Mach number for M local equal to 1 may be found from the equations

Px /q = (0.75/Мг) (1 + 0,2 M2fb

(7)

C Pmin =(p /q)-(1.43/M2)

Boundary-Layer Control by Blowing

Blowing over trailing edge flaps and the “jet flap” are presented in Chapter V. Blowing can also be used at, or near, or around the leading edge of an airfoil, to prevent or postpone stalling (separation) at higher angles of at­tack.

“Round” Airfoil Boundary-layer control was applied to a round-nosed and cambered section (28,b). As shown in figure 37, blowing is most effective from around x = 0.4c, as far as the magnitude of maximum lift is concerned. The experiments appear indicate that

&CL 4 s/c -/c7;

Roughly, it may also be said that

— v Cp~C<s ;

where Cp ~ Cq. The downstream-directed slot as in figure 37, was also used to try BL suction. In comparison,

this type of control reaches a certain limit (after removing the boundary layer). By contrast, blowing downstream, not only restores full energy; as shown in the graph, for CpCq – 0.12, it can also add momentum to the flow reaching to and beyond the trailing edge in a manner similar to that of a jet flap.

A Comparison of blowing and suction through two slots, is reported in (28,a). When discharging through forward slot, stalling of the RAF-31 section is comparatively gen­tle, between оі = 14 and 19° , for A = 6; maximum lift is increased from CLX = 0.9 to 1.6. By comparison, when sucking (through rear slot) the drop in CL is com­paratively sharp, while the maximum lift obtained is only modest (CLX = 1.2). The result of suction is better, however, when using the forward slot (CL* = 1.4). Blow­ing is thus found to be superior as to lift as well as in regard to the quality of stalling. The low Reynolds num­ber of this experimental investigation (Rc = 2(10) ) should be noted, however.

Подпись: The Momentum Required to eliminate or to prevent separation, by blowing, can be estimated (28,c). We will assume an airfoil section with blowing from the nose, in

Boundary-Layer Control by BlowingПодпись: Figure 38. Lift of a “wing” (28,d) at constant angle of attack, as a function of the momentum coefficient indicating blowing from a leading-edge slot. Combined Blowing. The type of stall (“abrupt.” or “gen­tle”) is qualitatively indicated in figure 37. When blowing from near the leading edge, the loss of lift is likely to be abrupt. Stalling can be made more gentle in this case, by increased flow. Another way of improving the quality of stall, would be blowing from farther forward. This is done in the configuration as in figure 38, where blowing from the leading edge is combined with that over a 60° trail – ing-edge flap. For a given discharge at the flap, lift at constant angle of attack of a “wing” with = 5, in­creases along a straight line, as the momentum coefficient for the nose slot is increased. This increment represents increased circulation. It does not stem, however, from any improvement of the flow over the trailing flap. In fact, that flap stalls beyond a certain increment of lift, as the momentum coefficient of the flap discharge is no longer sufficient to keep the flow attached.
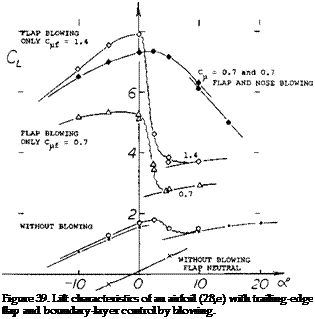
round numbers:

<**

=

zero

angle of attack in 2-dimensional flow

=

60

blowing trailing-edge flap, with C^ =

CL

=

3.0

maximum lift coefficient

s/c

=

0.2%

slot-width ratio, indicating outlet area

w/v

=

5

the blowing velocity ratio

Cq0

=

0.01

volume-flow coefficient of blowing

Cpo

=

25

blowing pressure coefficient = A p/q

C-uo

=

0.1

nose-slot momentum coefficient

x/c

=

0.7

indicating distance between slots

The procedure illustrated is as follows:

a) The loss of momentum between nose and flap corre­sponds to the BL thickness

а/с = (x/c)(U/vf 0.5 Cf ж 0.005 (27)

where U = average potential velocity along the upper side of the airfoil, assumed to be = 2 V; and Cf = 0.003.

b) The momentum discharged, has to be at least as great as the loss under (a):

CM = (1,5/a/c + (Us /V) h(slc) f ~ 0.08 (28)

where U = potential velocity at the location of the slot, assumed to be = 3V.

In all these equations and values (25) compressibility has not been taken into account. Considering velocity ratios up to 5, and/or Cp = 25, a more accurate calculation as in (28,c, d) may be advisable. – For the airfoil in figure 38, the minimum moment coefficient computed above, is shown at the left edge of the graph.

Ground Proximity. The configuration as in figure 38, was also tested (28 ,e) at higher Reynolds numbers (see figure 39) and in ground effect. A reduction of circulation is found near the ground, similar to that as shown in Chap­ter V for example from CL = 7, down to half, at h = 0.4c. So, there is no incentive for designing high-lift airplanes in low-wing form. Assuming, h = c to be a realistic height in a conventional airplane, the reduction is still from CL = 7, for example, almost down to 5. The reduction is negli­gible, however, for a wing with CL = 4.

Stalling. Blowing over the 60° flap of the configuration in figure 39 is so effective that a lift coefficient of almost CLX = 8 is obtained (30). Stalling takes place abruptly, however, within an interval of 1 or 2°, so that the use of such a wing would not be practical (would be dangerous). Separation (from the leading edge) could be prevented by means of a slat (or a nose flap). In the investigation quoted, blowing out of a slot located near the leading edge was used, however. With the help of this slot (and an

(28) High lift through blowing along the upper side of airfoils:

a) Perring (RAE), Withdrawing and Discharging, ARC RM 1100 (1927).

b) NACA: Knight TN 323 (1929) and Bamber Rpt 385 (1931); Blowing and Suction Through Backward-Opening Slot.

c) Thomas, a) Increasing Lift Through Flap Blowing, b) Calculation of Momentum Required, ZFW 1962 p 46.

d) Gersten, From Nose and Over Flap. Rpt DFL-189 (1962).

e) Lohr, Braunschweig Rpts DFL-0116 & -0188 (1961/63); also DLR-1964-02.

appreciable value of the momentum coefficient) a very gentle stall is obtained. This characteristic improves fur­ther when approaching the ground. Optimum conditions for the NACA 0010 airfoil configuration tested, including maximum lift, are then found when discharging half of a given value of momentum over the 60 flap, and the other half from the leading edge. An angle-of-attack range of 20 is thus obtained where the lift coefficient remains within plus/minus 5% of CL =5, for example. Of course, at lift coefficients of such magnitude, appreciable inter­ference can be expected from the plates between which the airfoil was tested.

Boundary-Layer Control by BlowingПодпись:Pitching Moments. As reported in (28,e) blowing from the leading edge produces less negative (that is, more desira­ble) moments than when using trailing flaps producing the same lift increment. For example, at CL = 4, using a total Qu. = 0.7, the coefficient of the configuration as in figure 39, is in the order of:
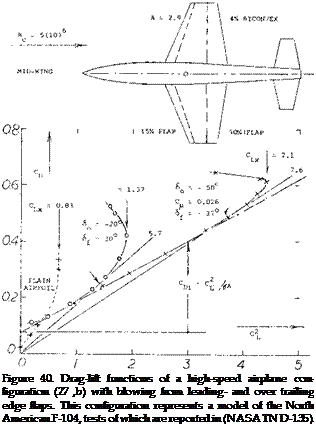
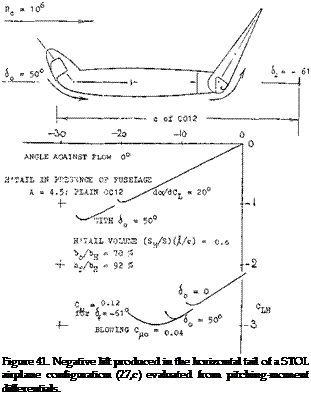
ОиД = — 0.6 when blowing over the flap = – 0.3 blowing 1/2 nose and 1/2 flap

However, the differential reduces when approaching maxi­mum lift. At and beyond Cux, all pitching moments presented in (28,e) turn strongly negative. This tendency not confirmed in other references would make an airplane very stable, and stalling impossible. Regarding the con­figuration in figure 39, it must also be said that it is not “balanced”. The angle of attack for CLX is around zero. The flap is too “strong”. A smaller flap, a lower angle of deflection, or increased blowing from the nose flap at the leading edge would give a more desirable attitude at mod­estly positive angles of attack.

L*

Подпись: C

Blowing From the Knee of nose flaps is reported in several references. In (27,a) CLX is increased from 1.5 to CLX =

3.0, for a plain trailing-edge flap deflection of 30°, using a round-nose-flap angle 6© between – 5 and – 25°, for Cqo = 0.007. For the airplane configuration as in figure 40, the following lift coefficients were obtained:

0.83 for the plain airfoil section

1.47 with 37° trailing, and – 30° nose flap

1.92 with ($4. – 37*, Qu. i = 0.016; and – 40° nose flap

2.10 with <f* = 37° ;Ou.*= 0.016; <f0 = -50° ; C*© = 0.010

In comparison to the very high moment coefficients with C^x. above unity as in figure 39 producing CL higher than 7, the coefficients used or obtained in this configuration are modest; the combined Gu – is 0.026, and the highest

CLK is 2.2. The larger lift increment comes from blowing over the trailing flaps. Deflection of, and blowing over the knees of the nose flaps makes these more effective, how­ever, so that they can be deflected up to — 50 . — Other advantages are:

a) While bf = 47° produces somewhat higher lift, the quality of stalling is better (more gentle) for 64 = 37®.

b) While 2/3 span flaps provide about the same lift as full-span flaps, stalling is more gentle in the latter condi­tion.

c) No hysteris was found in the CL (a ) function when using blowing flaps as indicated.

d) For landing, “boundary-layer control results in a con­siderably reduced speed and reduced distance”.

e) When blowing over the ailerons (which are portions of the flaps) they were “very effective lateral control de­vices”.

Tests on an actual North-American F-104 in a full scale tunnel using the same wing as in figure 40 with the same flaps, but with the ailerons neutral and a wider fuselage show only a CLX =1.57.

Takeoff. In order to get some insight into performance, the characteristics of the airplane as in figure 40, are plotted in polar form. Takeoff (see analyses in (27,b, c)) is a more difficult operation than landing as engine power is limited. Not only high lift, but also drag and BL control power have to be considered. Besides the plain wing, the illustration shows two selected high-lift configurations, not necessarily optimum in performance, but with com­paratively gentle stalling characteristics:

performance parameter

plain

without

with BLC

with “drag’

Cl*

– 0.83

– 1.37

– 2.10

– 2.10

(L/D),

7.9 (0.3)

5.3 (0.8)

5.2 (1.1)

4.0 (1.3)

8 (0.8)

27 (1.1)

35 (1.5)

26 (1.7)

(C!/Cd)x

3.3 (0.7)

5.7 (1.2)

7.6 (1.9)

6.9 (2.0)

oC. c^x

– 12°

– 12°

-14°

– 14°

Clx

(L/D)x (Cj/Cg)x (Cl/Cd )x я x

maximum lift coefficient maximum range ratio – maximum climb parameter figure of merit (takeoff) angle of attack at 0.9 ClX

The figure of merit discussed in Chapter V does not really indicate takeoff capability. It is easily obtained, however, in figure 40. The numbers in parentheses indicate the lift coefficients at which the maximum values of the re­spective parameters are found. — The tabulation shows first the BL-controlled configuration to be “better” when taking off and climbing. The drag equivalent to the power required to for blowing should be considered, however. Assuming an internal efficiency (in ducts and through the slots) of 50%, that drag may correspond to ACD = 2 C^u 0.05, in the system considered. Performance parameters including the “drag” are listed in the last column above. They show the BL-controlled configuration to be inferior when climbing. However, takeoff is better than in the airplane with plain flaps no blowing and at any rate, the use of flaps (with or without BL control) increases takeoff and climb performance considerably over that of the plain wing that has a t/c = 4%, is sharp-edged and a symmetrical section. The result of a more complex analysis in (27,b) shows that the distance to clear a 50-foot obstacle is reduced 25%, by the use boundary-layer control, under the following conditions:

1) most of ground run with flaps neutral, and without BL control;

2) conversion to high-lift configuration, shortly before lift-off;

3) using 8% of engine thrust for BL control (by air bleed).

Подпись: Figure 40. Drag-lift functions of a high-speed airplane con-figuration (27 ,b) with blowing from leading- and over trailing edge flaps. This configuration represents a model of the North American F-104, tests of which are reported in (NASA TN D-135).

A BL control system also has some structural weight. In the STOL aircraft as in (27,c) the weight fraction is stated to be between 1 and 2%. The pumping power required is said to be between 0.01 and 0.02 HP/lb, for a wing loading of 50 lb/ft2 .

Slot Design. In the practical construction of an airplane, it is simply not possible to provide spanwise slots for blow­ing (or suction) purposes, without any supporting inter­ruption. In (27,b) testing was done to determine the consequences of partially blocking the slots at the leading and trailing-edge flaps. It is reported that “when one – quarter of the area of the slot(s) was blocked (by spacers 0.5% c wide) and the value of C^u. was the same as that with the slot(s) fully open, no detrimental effect on the aerodynamic characteristics was noted”.

(29) Description of the so-called Coanda effect:

a) “Everybody” has seen a ball stably resting “on top” of a vertical jet of water. The principles of Bernoulli (1700 to 17 82) or Ventury (1746 to 1822) are seen at work, in this spectacle, Coanda has tried to apply the fact that a jet of fluid clings to a curved surface, particularly in thrust augmentation nozzles.

b) Metral, Coanda Effect, Pub Sci Tech Ministere de EAir No. 218 (1948).

c) Newman, Deflexion of Jet Sheets, Contribution in (28,1).

d) Univ Toronto Inst Aerospace, Thrust Augmentation and Jet Sheet Deflection (1964); see DDC AD-610,525 and 611,759.

Подпись:Подпись:A Horizontal Tail (suitable for a “high-lift” transport aircraft) is investigated in (27,c). During landing of a conventional airplane, the stabilizer is producing positive lift, while the elevator is trying to reduce the lift of the tail, possibly to zero. When this is no longer feasible, the stabilizer or the whole horizontal tail has to be trimmed down to a negative angle against the fuselage. There are then two reasons why elevator and horizontal tail of a really high-lift airplane (STOL) may be inadequate in size and/or effectiveness:
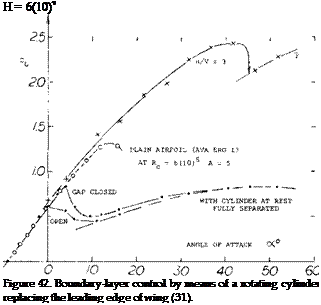
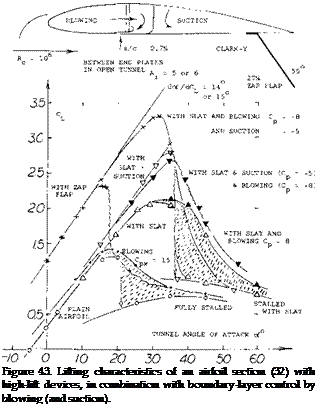
a) Deflection and/or extension of large and BL-controlled wing flaps necessarily produces large negative (nose-down) pitching moments.

b) Corresponding to the high lift coefficients obtained (say, CL = 4 or 5) the dynamic pressure at which the airplane is flying, is very low.

Of course, the wing flaps also produce increased down – wash, thus helping the tail to provide the negative (tail – down) lift required to counterbalance the wing’s pitching moment. Presence of, and interference by the fuselage is likely to reduce the average downwash, however. — In order to control a STOL-type airplane such as in (27,c) having a CL* above 6, and a Cm/4 in the order of 1.1, the tail surface as in figure 41, might be used. Including a nose flap with blowing around the “knee”, the maximum nega­tive lift produced (in the presence of the fuselage) corre­sponds to CLH = — 3. Using a tail “volume” V = (.//c)(S^ /S) = 3.8 (0.28) = 1.06, the maximum Ditching moment produced by the tail is indicated by

Сш =VCLH = 1.06(3) = 3.2 (30)

Of course, to produce this value, the tail surface has to be trimmed to an angle of — 14°, against the flow. Only 1/3 of the value is needed, however, in the airplane con­sidered; and that much can be obtained by means of the BL-controlled elevator, at a lesser angle of tail setting, and possibly without any nose flap at all. However, deflecting the nose flap, and blowing around its “knee”, would prevent stalling of the tail surface.

High-Lift Combinations. A leading-edge slat was investi­gated (32) in combination with various other high-lift devices. As partly shown in figure 43, the following values were obtained:

o

at oL = 17 for the plain airfoil

31° with leading-edge slat

16° with trailing-edge flap

24° with flap and slat

20° with upper-side blowing

34° with upper blowing and slat

21° with flap and upper blowing

31° with flap, upper blowing and slat

Rotating Cylinder. In figure 38 of Chapter V, it is shown how rotation of a cylinder placed within, or replacing the trailing edge of an airfoil, is an effective means of getting the flow around that edge. A similar method of boun­dary-layer control (preventing separation) at the leading edge, is illustrated in figure 42. Considering the very low Reynolds number (below 105) the maximum lift obtained for u/V = 3, is impressive. All traces of laminar separation (including a hysteresis loop, in the lower part of the graph) have disappeared. At higher speeds of rotation, the cylinder can be considered to be a pump. It then ac­celerates the surface flow; and its effect may be similar to that of gentle blowing.

Similar lift values were found when replacing upper-side blowing by area suction. As far as the slat is concerned, its effect is largest when the trailing edge is either not “strained”, or protected (by blowing or suction). The quality of stalling indicated in parentheses above shows the slat does not help when it is operating at high load. A basic principle to be learned from these experiments is that leading edge devices are not only useful to increase maximum lift and are needed to prevent sudden lead­ing-edge stalling, but also that they should also be bal­anced in size and design, against any trailing-edge devices, so that stalling starts from that edge, slowly proceeding forward.

Boundary-Layer Control by BlowingПодпись: H = 6(10)4 Figure 42. Boundary-layer control by means of a rotating cylinder replacing the leading edge of wing (31). Подпись:Blowing Around Leading Edge. Suction from the leading edge (and possibly suction from any place on the upper side of an airfoil) is characterized by a more or less abrupt stall. As shown in several examples in this chapter, blow­ing (from suitable places on the upper side) produces, on the other hand, comparatively gentle stalling. However, the ultimate in harmless stall, and in maintaining lift beyond its maximum, may be expected by imitating the cylinder in figure 42, using the so-called Coarrda effect (29); that is by blowing around the leading edge, from the lower to the upper side. In the experiments illustrated in figure 43, forward-facing slots were thus used located at 29 and 50%, respectively, of the chord. Dissipation of the jet sheet (primarily by mixing with the outside flow) was found to be so strong, however, that the maximum of its dynamic pressure is reduced to half, and its velocity to 1/4, at a distance equal to some 10% of the chord. For the slots investigated, therefore, a real increment of maximum lift v as not obtained. As demonstrated in the graph, the quality of stalling is definitely improved, however, from “abrupt” to “gentle”. In other words, lift is appreciably increased (say doubled, under certain conditions) at angles of attack beyond that where the lift is maximum. In one configuration (involving upper-surface suction, but not shown in the illustration) a hysteresis loop with a width of 6° of the angle of attack, is eliminated by lower-surface blowing (although C LX is reduced). In the case of the plain airfoil, strong blowing (corresponding to Cp = 15) is required to obtain the beneficial effect of lower-surface blowing. At higher lift coefficients (with Zap flap de­flected) the effect is only found in combination with a leading-edge slat (evidently guiding the discharged flow around that edge). It is expected, however, that this type of blowing would be more effective and efficient when using a slot further forward (say at or even ahead of 10% of the chord).
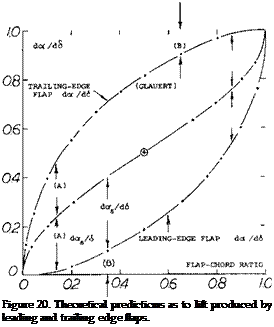
(30) In figure 39, it should be noted that lift coefficients up to CLX =8, are only obtained with extremely high momentum coefficients (up to Cm. – 1.4). Such coefficients are typical of jet flaps as described in the “trailing edge” chapter. In effect, we have this type of flap in figures 38 and 39.

(31) Wolff, Rotating Cylinder in Leading Edge of Wing, Dutch Rpts RSL (Amsterdam); see translations NACA TM 307 & 354 (1926). [57]

CHAPTER VII –

LEADING-EDGE OR NOSE FLAPS

The camber of a section, especially at the leading edge of an airfoil, improves the flow around the nose, especially from the stagnation point on the lower surface to the upper surface. Since the camber level needed to prevent separation at the higher lift coefficients is large and results in high drag at low cruise lift coefficients, o:her devices are used. Thus, instead of camber, leading edge devices similar to trailing edge flaps are used to improve the flow about the leading edge.

Nose Shape. In Chapter IV it was shown that in sections with little or no camber and a small radius, the flow separated at fairly low angles of attack near the leading edge causing the airfoil to stall. This is illustrated by the test data of (13,c) given on figure 32 for airfoils with various leading edge shapes.

Подпись:

Подпись: Leading-Edge Camber. A well known airfoil shape is the NACA’s 23012 section. Its mean line is straight over the rear 85% of the chord (to keep the pitching moment low, = ~ 0.015) while the nose is pulled down, so to speak, to increase the maximum lift coefficient. A comparison of the maximum lift of the 23012 section with other 12% thick NACA sections as tested (13,d) in two dimensional flow at R = 6(10)to shows the advantage of camber at the leading edge: Section NACA Maximum Lift Coefficient 23012 1.72 2412 1.68 0012 1.57 So, there is some improvement over the straight section 0012; and the increment is at least as high as that due to 2% of conventional camber. Another airfoil section cambered according to the same principles as the 23012, is the modified 64AX10 as reported in (13,b). Considering the pulled-down 15% of the chord to be a flap, figure 22 suggests some increase of maximum lift; that is, from Сц< = 1.3 to above 1.4, for 1.2% camber or cf0 = - (4 or 5)°.
Подпись: (13) Airfoils with modified (drooped) leading edges: a) Kelly, 63-012 Airfoil with Nose Modifications, NACA TN 2228 (1950); see also figure 59 in the “maximum lift and stalling” chapter. b) Макі, 64A010 Nose Shape and CLX , NACA TN 3871 (14) Theoretical analysis of airfoil nose shape: (1956). a) Rettie, Velocity Distribution, ARC RM 3027 (1957). c) Butler, Leading-Edge Modifications, ARC CP-410 (1958). b) Roshko, Maximum Lift Due to Flaps, Douglas Rpt d) Abbott and Others, Summary of Airfoil Data, NACA SM-23626 (1959). TRpt 824 (1945). c) Glauert, Airfoil with Hinged Flap, ARC RM 1095 (1927).

Flap Theory. The improvement in Cux obtained by lead­ing-edge camber are limited to an increase of less than 10%. A much more effective method is to deflect the airfoil-section nose in form of a movable “flap”, as shown in figures 21 and 23, for example. An ingenious analysis encompassing both trailing – and leading-edge flaps, is pre­sented in (14,b). Figure 20 shows the theoretical results of this study for lift variation due to nose-flap deflection, for the optimum or symmetrical lift coefficient and for the lift due to trailing-edge deflection. It is seen in the graph that lift due to deflection of nose flaps, is practically zero, for chord ratios, say up to 10%. To be sure, there is a decrease of lift (at constant angle of attack) particularly when using larger-size flaps.

Stalling Angle. As pointed out in (14,a) stalling from the nose of an airfoil section takes place when the stagnation point reaches a critical location “below” that nose. Denot­ing the angle of attack at which the flow comes onto the leading edge “smoothly”, meeting it in a “symmetrical” manner thus placing the stagnation point right onto the nose, by the subscript “s”, this angle approximately corre­sponds to

do£6 /dcf0 = – (2/tr) fc0/c;

C L6 = (dC L /doc )(2/тг) sincf0 Tc0/c (12)

where cf0 = angle of nose-flap deflection, negative when pulling the flap down (so that оCs becomes positive). In other words, оCs is naturally increased when bending down the leading edge “into” the oncoming flow. For small flap-chord ratios, the “symmetrical” angle of attack is approximately

(*5~ cf NTc0 /с (13)

Suction pressures “above” the nose vary as (at — оCsf. Assuming that there is a critical Cpmm (behind which stalling takes place) it may be expected that the maximum lift coefficient in two-dimensional flow, is

CLX =CL* + 2іГ(оС -<*s) (14)

where x indicates a maximum value, depending on parameters such as nose radius and Reynolds number. If this value is constant for a given airfoil, it can be con­cluded from equation (13) that

AClx =CL5^ cf n/^/c (16)

A more accurate, complete function for, is included in figure 20. It should be noted that this graph is anti – symmetrical insofar as A = A, and В = В. The physical meaning of this symmetry is that in a trailing flap as well as for a correctly deflected leading flap, the stagnation “point” is at the leading edge.

LEADING-EDGE OR NOSE FLAPS

Figure 21. Hinged section nose; influence upon lift of airfoil section.

Optimum Flap Angle. In the particular configuration shown in figure 21, the maximum lift coefficient of the otherwise plain airfoil, is increased from CLX = 1.1 to a maximum of 1.66 for an optimum leading-edge deflection of cf0 = — 30 . The same and other results are plotted in figure 22, as a function of the theoretical nose-flap pa­rameter d lc0/c as in equation (16). It is seen, indeed, that A Cu « C. Stalling takes place at higher lift coefficients, where the upper side of the airfoil is no longer able to support the flow against a strong pressure gradient.

LEADING-EDGE OR NOSE FLAPS

Hinged Noses have been tested (15,a) as early as in 1920. Some more recent results are presented in figure 21. In combination with a standard 20% and 60° split f ap, some deterioration of lift can be seen in the graph, growing as the deflection of the nose flap is increased from zero to — 30 and — 45°. Since the tests were conducted between wind-tunnel walls, it can be suspected that some boun­dary-layer interference is involved, in the “corners” be­tween airfoil and walls. Some of the deterioration is also likely to be genuine, caused particularly by the negative pressure gradients around the bends of the flaps, followed by positive gradients.

(15) Experimental investigation of nose flaps:

a) Harris, Biplane With Variable Camber, ARC RM 677 (1921).

b) Lemme, With Hinged Slotted Nose, ZWB 1676 (1944); NACA TM 1108 and 1117.

c) Kelly; 64A10 with Slat, Leading & Trailing Edge Flaps; NACA TN 3007 (1953).

d) Kelly, Loads on Slat and L’Edge Flap as in (c), NACA TN 3220 (1954).

e) Gambucci, 0006 With Leading and Trailing Edge Flaps, NACA TN 3797 (1956).

f) Spence, On 40 Swept Airplane Model, ARC RM 2752 (1952).

LEADING-EDGE OR NOSE FLAPS

-03 -0.2 -0.1 ‘ 0

Figure 22. “Symmetrical” and maximum lift of (round-nosed) airfoil sections, as a function of the theoretical (14,b) le ading-edge flap parameter.

Reynolds Number. In all leading-edge flaps, the bound­ary-layer flow is or can be laminar. Testing for example, an airfoil at Rc = 10*, the R’number of a 10% flap is only 105. At a number Rc = 10to, a 0009 section investigated in (15 ,b) only shows CLX =0.7 for the plain airfoil, while with optimum nose flap, CLX = 1.3 is obtained. So, there is an appreciable increment. It still seems, however, that the flow remains laminar in this case, up to and beyond the bend above the leading-edge flap and may then sepa­rate because of the positive pressure gradient necessarily aft of the bend.

Leading and Trailing Edge Flaps. With the combination of leading and trailing edge flaps an increase in the maximum lift coefficient to a higher level is obtained. As seen in figure 22, the increment due to nose-flap deflection is approximately constant depending upon size, type and angle of the trailing-edge device. However, approaching sincf fcjc = – 0.2, which corresponds to 6C =: — 30 for a 15% nose flap, separation and stalling takes place somewhere on the upper side of the airfoil. Another consideration regarding the use of flaps, are the pitching moments necessarily produced by their deflection. Incre­ments ЛСтд (or values of ACm^ taken at constant CL, are plotted in figure 26. By comparison, the moment due to a 20% and 60° split flap corresponds to Cmo ~ – 0.20. Deflection of a nose flap thus increases the already strong and undesirable pitching, moments of flapped wings.

Sharp Leading Edges are as good (or possibly better than) rounded edges, as long as there is not much of a flow around them. As a consequence, deflection of such edges can lead to lift coefficients as high as those found in comparable round-nose configurations. This also means that the gain of the differential in maximum lift obtained by deflecting a sharp-edged nose flap, is greater than that for round-nosed sections. An example of a sharp-edged airfoil section is presented in figure 23. Due to separation the optimum nose-flap deflection of such sections can be expected to be more sensitive than round-nosed airfoil shapes (such as in figure 21, for example). In fact, their viscous drag plotted in figure 27, shows such pronounced minima, the best that CLS for any 6o can be deter­mined. These values are included in figure 22. Looking closely (in figure 23), it is seen, however, that lift as a function of 6 is not very sensitive as to variations of 6©, say by + or — 10 as against the optimum (giving mini­mum drag).

LEADING-EDGE OR NOSE FLAPS

LEADING-EDGE OR NOSE FLAPS

from a circular-arc airfoil section.

Maximum Lift. The mechanism of stalling in sharp-nosed airfoils is explained in Chapter IV and/or in (16,c). The maximum lift coefficient of sharp edge airfoils is given on figure 24. Laminar separation and turbulent reattachment of the flow over the upper side consumes some momen­tum. As a consequence, the CLX function of sections with sharp-edged nose flaps is no longer parallel to the Cus line (as in figure 22). It is also evident in figure 24 that in

combination with a trailing-edge flap, the increase of CLx with the nose-flap angle is still smaller. Although the differential in CLX due to the deflection of the leading edge flap is greater for a sharp edge airfoil, the actual CLX is lower than for a round nose section. CLx =: 2.0 for the sharp nose as compared with 2.5 to 2.6 for the round nose section, figure 22.

LEADING-EDGE OR NOSE FLAPS

LEADING-EDGE OR NOSE FLAPS

Figure 24. Sharp-edged airfoil sections; maximum-lift coefficients as a function of nose-flap deflection.

(16) Investigation of sharp-edged nose flaps:

a) Rose, 4.3% Double-Wedge Airfoil with Flaps, NACA TN 1934 (1949).

b) Marshall, Double Arc Section With 17% Flap, ARC RM 2365 (1950).

c) Rose, Stalling of Sharp Airfoil With Nose Flap, NACA TN 2172 (1950). See also TN 1894 and 1923 (1949), and TN 2018 (1950) with various chord ratios.

d) Lange, Wing with A = 4 and Circular Arc Sections, NACA TN 2823 (1952).

e) Cahill, Summary Report on Forces of and Loads on Airfoils with Leading – and Trailing-Edge Flaps, NACA TRpt 1146 (1953).

f) Croom, With Leading – and Trailing-Edge Flaps, NACA RM L1957J15 (also with BL control) and L1958B05 (also with spoiler).

g) Powter, Biconvex Wing With Flaps, ARC RM 2157 (1946). [55]

Comparison With Slat. A sharp-edged (biconvex) airfoil was investigated (I6,b) with leading – and trailing-edge devices. It is stated that “in view of the structural diffi­culties (of a slat) tests were also made using a simpler method”, namely a same-size nose flap. Maximum lift coefficients obtained at Rc ~ 10* with a slotted flap at 46°, are as follows;

clx =1 .55 for the airfoil with trailing-edge flap

= 2.02 with flap and optimum slat

= 1.75 with flap and 35° nose flap

The nose flap is roughly half as effective as the slat in this case.

Kruger Flap. The nose flaps presented so far, are simply portions of airfoil sections, suitably hinged so that they can be deflected. A different type is shown in figure 25, obtained by pulling out of the airfoil, or deflecting from its lower side, a comparatively thin extension of the chord. This flap is named after W. Kruger, who first investigated (17,a, b) various shapes at the AVA (Gottin­gen) in 1944. The Kruger flap is used in the inboard portions of some present-day swept wings (as in airliners). — Since this type of flap is extended forward of the basic airfoil chord, an increase of the lift-curve slope can be expected. This is seen to be true in figure 25, particularly when using the flap (a) on the otherwise plain airfoil. In combination with a trailing-edge split flap, lift coefficients (and pressure gradients) are evidently so high that inter­ference (boundary-layer separation) takes place in the corners between suction side and the walls of the so-called two-dimensional wind tunnel used. Part of the de­terioration can be genuine, however.

Nose Radius. As mentioned above, the gain in maximum lift obtained by the use of nose flaps, is particularly great for sharp-edged airfoil sections (where CLX is low, with­out any leading-edge device). The effectiveness of Kruger flaps is shown in (17,a) on various airfoil sections. Also considering the results as in figures 21, 22 and 23, the following statements can be made:

The effectiveness of nose flaps increases, as the lead­ing-edge radius is reduced, particularly to below r/c = 1%. Maximum values of A CLX = 0.6 are obtained for supersonic-type sharp-edged airfoil sections (where Clxo = 0.6 or 0.7, only).

The increment in maximum lift can be expected to be small in round-nosed and well-cambered sections. For example, for a 12% thick airfoil with 4% reflexed camber, and r/c = 1.6%, almost no increment at all was found (17,a).

These statements may also be correct for leading-edge

slats.

Подпись: a) Upper side (sliding out) b) Lower side (deflecting). much improved. For the plain airfoil, a high lift co­efficient is maintained up to оСг = 25°, which is some 10° beyond that for CLx. It seems that laminar separa­tion first takes place at the leading edge of the flap. Subsequently, the flow reattaches in turbulent form to the upper side of the airfoil. Final separation starts near the trailing edge, gradually progressing forward. In combi­nation with the split flap, stalling develops over a range of some 4° of the angle of attack. Thus, the lower-side Kruger flap can be used to induce gentle stalling (18). Considering practical operation of an airplane, the “per­missible” maximum lift, staying away from a sudden loss of lift would thus become satisfactory.
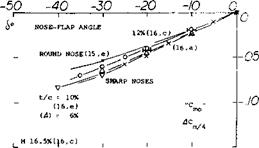
Pitching Moments. Nose flaps represent a forward ex­tension of the wing chord, which adds a positive tail-down component to the pitching moment. In the configurations shown in figure 25, the variation corresponds to

dCr^/dCL = +0.06 for type (a)

= + 0.05 for type (b)

Considering a flap extension in the order of 8% of the airfoil chord, a forward shift of the aerodynamic center could be expected, equal to 0.75 (0.08) = 0.06, which comes close to the experimental results. Approximately the same shifts were found when using the nose flaps in combination with a standard split flap. All these derivat­ives are positive (destabilizing), in a manner similar to that of slats. Kruger flaps (if not extending too far down) might help, however, to reduce the large nose-down pitch­ing moments caused by Fowler or similar flaps.

LEADING-EDGE OR NOSE FLAPS

R0 – 5(10)6

Stalling. Deflection of a leading-edge flap increases the angle of attack at which stalling takes place. For example, in figure 21, the increment is A oC between 8 and 10°. In combination with a split flap, stalling is quite sudden, however as seen on figure 25. In configuration (a) the lift coefficient drops from CLX = 3.0, to CLX = 1.9, at оC2 = 18°. Separation evidently “springs” from somewhere on or shortly aft of the nose flap. If the same flap would be used in combination with a cambered airfoil section, stall­ing might be more gentle (possibly beginning from the trailing edge). The (b) type Kruger flap in figure 25, can be deflected to any suitable angle. Maximum CLX is obtained for 6n = + (110 or 120) , in the definition as in the illustration. We have plotted results for 6n = + 130°, however. While the increment in maximum lift is not spectacular in this case, the quality of stalling is very

LEADING-EDGE OR NOSE FLAPS

Figure 26. Pitching moments “C^’ of « 15% chord leading-edge flaps.

(18) As pointed out in (10,e), damping by a positive dCL /doC in the wing tips is considered to be at least as important to prevent rolling over, as the maintenance of high lift.

Camber. The pitching moment of airfoil sections consists of two components. That due to camber or deflection of a nose flap, is plotted in figure 26 in the form of “Сюо” (defined for CL = 0) or ACmy4(taken for C L := constant), as a function of the angle of deflection. Converting the angle (25°) of the configuration as shown, into a dip ratio (y/c = (c0/c) sincfo = 6.3%) we find that the moment (АСтд = – 0.05) is of the same order of magnitude as that due to slats, in part (b) of figure 9. As mentioned in context with that illustration, the camber moment of nose flaps may also increase with their chord length.

peak at the knee is too high, so that separation occurs from some place aft of that bend in the surface. The investigation (15 ,b) indicates that a peak of the maximum lift coefficient is obtained when the flap is deflected so far, that the first peak almost disappears. In the con­figuration considered, that condition is found at 60 = — 45°, producing a CLXл = 1.33. A little bit of flow around the nose of the flap from the lower to the upper side is desirable, however. It seems that such a flow promotes transition to turbulence, so that separation at the knee is prevented or postponed.

LEADING-EDGE OR NOSE FLAPSПодпись: Cpmin (A) Pressure distribution for one particular nose-flap angle, at maximum lift. Подпись:

Flap Forces. Integration of a pressure distribution yields both the resultant force in a nose flap, and its hinge moment. Using the peak-pressure values as in part (B) of figure 28, as an indication for the flap load, some ex­change between the two peaks evidently takes place, as the flap angle, or the angle of attack and the lift co­efficient are varied. The magnitude of the normal forces is shown in figure 29, indicated by a coefficient based on chord or area of the flap. The derivative is

(dCNo/dC L) between (2.8 and 3.5) (20)

with or without trailing-edge flap deflected arid is also confirmed in (I6,e) for the round-nosed flap as in figure 30. When deflecting the nose flap and/or when using a trailing-edge flap, the load is reducing, corresponding to a lateral shift of the straight lines in the graph, by certain values of Д CL. Empirically, the load is zero:

a) when the lift coefficient CL or ACL is about half of that as in equation (12);

b) when CL or ACl is about half of the (ACt ) due to trailing flap as in Chapter V.

Подпись:Adding these two components, the lift coefficient in fig­ure 29 is obtained.

Подпись: force coefficient, as a function of the total lift coefficient pro-duced. Hinge Moments of nose flaps consist of a component due to angle of attack and one due to deflection. For 60 = 0, the moment simply corresponds to a part of the airfoil lift or load. When deflecting a flap downward, the minimum pressure peak at or near the leading edge, reduces in magnitude, as shown in figure 28. Hinge moments “H” reduce accordingly. The coefficient
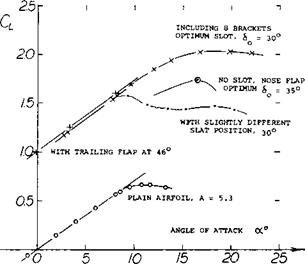
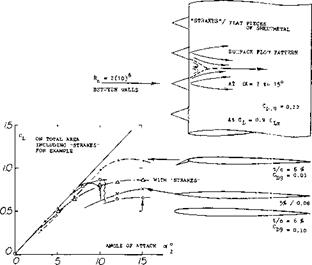
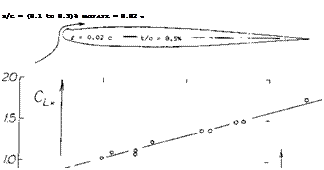
CM =H/qc0S0 = H/qc! b (21)

(where “o” refers to the chord of the nose flap) is plotted in figure ‘30, as a function of the total lift coefficient. The derivative dCH /dCL is approximately:

= 2.0 for the sharp-edged flap in the graph = 1.5 for the round-nosed flap as in figure 29.

The lateral shift in the lift coefficient is roughly:

Де.

=

CLSi equation (12) for sharp-nosed flaps.

acl

=

1/2 CLS, for round-nosed flaps,

дси

=

(A C’L ) as for the normal force, above

The Kruger flaps deflected from the lower side (as in part (B) of figure 25) have loads and hinge moments different from those discussed above. As reported in (17,b) the normal-force coefficient varies between:

C^0 = -1.5 (down/back) at low lift coefficients

= + 3.7 (up/forward) at high lift coefficients

t/o*« 7.5 *

25* ^

Подпись: BOUNDARY LAYER CONTROL NEAR THE LEADING EDGE
Подпись: і Подпись: 46?

Elimination of the boundary layer by suction or restora­tion of its dynamic energy by blowing, are well-known means of keeping fluid flow attached. In Chapter V blow­ing over wing flaps is presented. The same type of control can also be used at or around the leading edge of lifting airfoils.

A. Control Through Turbulence or Vortex Generation Any of the leading-edge devices discussed in this chapter may be used to guide the flow around the leading edge. Separation (stalling) will subsequently take place, how­ever, when and if the boundary layer remains laminar. Consideration of transition turbulence, mixing and vortex generation is, therefore, important.

Laminar Separation takes place very soon after a still laminar boundary layer is directed to flow against an adverse positive pressure gradient. Strong gradients of this kind are encountered at higher lift coefficients on and behind every flap or slat placed at the leading edge of an airfoil. The fact that those devices are effective, can be explained by reasons as follows:

a) The Reynolds number at the end of a flap or slat, is an order of magnitude larger than that “at” the not very round leading edge of a plain airfoil.

b) The mechanism of laminar separation, followed by transition and re-attachment may also be active, pre­venting separation from behind flap or slat.

c) Surface imperfections within a slot, or such as the gap near the hinge axis of a flap, may help or even be neces­sary to make these devices effective.

It is amazing that neither analysis (21,c), nor the numer­ous experiments with leading-edge devices, have really gone into the mechanism and/or into auxiliary means through which subsequent separation is prevented or post­poned.

Transition. The optimum (out of 6) arrangements of a “leading-edge slat of rather unusual design” is presented in figure 31. It is debatable to call the “flap” a slat. Our explanation for the increase of lift from CLX == 1.74 to 2.02, due to the presence of the slot – is turbulence. The flow is likely to remain laminar to the end of the nose flap. It then separates, turns turbulent as it passes over the slot, and it meets the round nose of the main airfoil in this condition. In fact, a reduction of the maximum lift may be expected, if there were a flow through the slot.

16*

LEADING-EDGE OR NOSE FLAPS

1.5 ft

LEADING-EDGE OR NOSE FLAPS

Figure 31. Lifting characteristics of an “Unusual Design’’ of a leading-edge slat or flap (16,b).

Vortex Generators have been investigated and are used on many aircraft primarily to improve the flow over trail – ing-edge flaps. The function of these devices is well de­scribed in (21,b). They are either ramps (or wedges) each forming a pair of trailing vortices like a little wing, or vanes (little half-span “wings” or plates) protruding from the wing surface at a lateral angle of attack thus producing each a tip vortex. When placing a number of such ele­ments in a spanwise row within the boundary layer, a

(20) Pressure distributions, loads and hinge moments of nose flaps:

a) Kelly, Leading-Edge Flaps, as in (17,d).

b) Kruger, With Kruger Flaps, as in (20,b).

c) Lemme, Round-Nose Flap, as in (17,b).

d) Cahill, Sharp-Edge Flap, as in (18,e).

(21) Lachmann, “Boundary Layer and Flow Control’’, 2 Volumes, Pergamon Press (1961):

I) Summaries and Increase of Lift:

a) A major part of Volume I deals with trailing-edge blowing, and it is as such referenced in the “trailing-edge’’ chapter.

b) Williams, British Research (including nose suction).

c) Pleines, Slotted Wings (including Fieseler “Stork’’ and Dornier-27).

d) Basic considerations of separation control are presented in various places.

e) Wagner, Engineering Considerations of Suction and Blowing.

II) Primarily BL Control for Low Drag:

a) Most of Volume II deals with low drag, which is not part of this chapter.

b) Pearcey, Prevention of Separation by BL Control.

series of chordwise trailing vortices is formed. These heli – coidal vortices serve to exchange retarded particles of air near the surface of an airfoil with high-energy particles at the edge of the boundary layer. In short, momentum is transported toward the surface through mixing or turbu­lence. For vane-type generators placed on the upper side of an airfoil, in a single row the following dimensions are said (22,a) to be most effective:

h/c

= i%

for the height ratio

y/h

= 6

for the lateral spacing

j2/h

= 2

for the chord length of the vane

A

= 15°

for the angle of yaw

The size, height, of vortex generators “should be related to the range of surface for which they are required to be effective — rather than to any local boundary-layer con­ditions”. An example of the use of vortex generators is shown in figure 36, along the wing roots and ahead of the aileron.

Increasing Lift. It is reported (22,c) that the maximum lift of the NACA 23012 section was increased 30% by means of turbulence generators which postpone separation from the trailing edge. The influence of leading-edge separation of a 6% thick section (22,f) was very small, however; CLx was increased from 0.8, less than 10%. When placing “generators” ahead of the section nose, the beneficial effect is of a different nature. “Strakes” as shown in figure 32, do not really increase the maximum lift. They change stalling characteristics, however; increasing the an­gle of maximum lift by some 5°. The pattern shows how the flow reattaches itself “immediately”, behind the pro­tuberances as well as between them. — As far as nose flaps are concerned, it is suggested that the gap “around” the hinge axis, or the lip of the airfoil adjoining the flap, may produce transition and turbulence. In the case of slats, the

LEADING-EDGE OR NOSE FLAPS

Figure 32. The influence of several leading-edge modifications (13,c) on the lift of a thin airfoil section.

converging (nozzle-like) slot formed when extending the slat, must be expected to stabilize laminar flow. It is, therefore, suggested that turbulence generators placed within the slot might improve the effectiveness of the slat. In fact, the Messerschmitt slat as in figure 8(b) shows a sheet-metal step (into which the slat is intended to fit, when retracted); and this step may very well act as a transition trip. See also figure 4.

B. Boundary-Layer Control by Suction Around the leading edge of a conventional airfoil shape, the boundary layer is thin and laminar. Suction directly at the nose would, therefore, not make sense. There are some arrangements, however, whereby suction will guide the flow around the leading edge, subsequently preventing or postponing separation.

A Nose Shape, specially designed to be combined with boundary-layer control is shown in figure 33. Flow around the leading edge is accomplished by suction through a narrow slot as indicated. After most of the turning has been done, the flow is then directed against a comparatively modest pressure gradient along the upper side of the airfoil. As reported in (23,a): “unexpectedly, the increments in Clx correlated excellently in terms of the momentum sucked through the slot, not the Quanti­ty” (25). The increase of maximum lift shown in the graph is impressive, however such nose shape would not be practical for high-speed flight.

(22) Mechanism of and experiments with vortex generators:

a) Pearcey, Prevention of Separation, last contribution in (28,11).

b) Bruynes (United Aircraft) Mixing Device, US Patent 2,558,816 (1951).

c) There is a number of unpublished reports, listed in (a). Other such reports by United Aircraft Corporation (1947/1954) are mentioned in (e) & (f).

d) Schubauer, Forced Mixing, J Fluid Mechs 8 (1960) Part I.

e) Spangler, Influence on Skin Friction, NASA Contractor RptCR-145 (1964).

f) Bursnall, Maximum Lift of 6% Section, NACA RM L1952G24.

g) As reported by McFadden in NACA TN 3523 (1955), “vortex generators (at 35-percent chord) were found to be effective in both the wing-dropping and pitch-up problems” of the North American F-86 swept-wing airplane, at Mach numbers around 0.9.

(23) High lift through leading-edge slot suction:

a) Williams, High-Lift Boundary-Layer Control, in Volume I of (28).

b) Williams, Theoretical Investigations (RM 2693) and Tunnel Tests (RM 2876) of Nose-Slot Suction, ARC Rpts (1950/52); see also (28,1).

c) McCullough, 63-012 Airfoil, NACA TN 1683 & 2041 (1948/50).

Подпись:figure 40 of Chapter V, suction distributed over a certain chordwise area, therefore, seems to be more practical. Tests (24,f) on a 0006 airfoil section, with suction through perforated sheet metal backed with felt, show the following near-optimum situation:
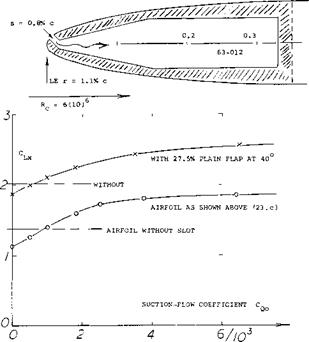
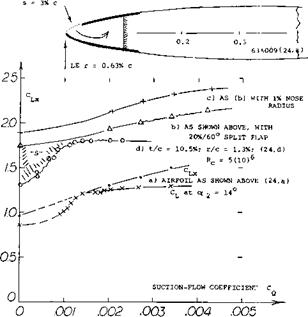
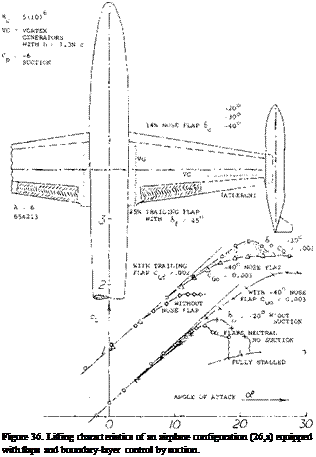
Llx

0.87

for the plain airfoil

C« =

0.69

with perforated nose

CL ~

1.30

with suction, at beginning stall

Cux

1.40

with tunnel-wall interference

x/c

1%

required area, from nose point

Cq =

.001

required for up to C u = 1.3

5 –

————————————– _j___________________________________________ і______________________

0 01 Q2 Q5

Figure 33. Boundary-layer control around the nose of a specially designed airfoil section (24,a, b) by suction through a narrow slot.

Because of severe tunnel-wall interference (3-dimensional flow pattern) stalling takes place over an interval of up to 8° of the angle of attack (whereby CL increases from 1.3 to 1.4). This type of stall is not typical for boundary-layer control by suction.

Leading-Edge Slot. The NACA 63-012 airfoil section was investigated (23 ,c) with various suction slots. Optimum dimensions (with or without a 40° plain trailing flap) were found to be as follows:

s/c = 0.06% for the width of the slot

x/c = 0.8% for the chordwise location

The maximum lift coefficient was increased as shown in figure 34. Up to Cq = 0.004 (or somewhat higher) separa­tion from the leading edge is evidently being; eliminated, thus increasing lift by ДСи = 0.7 for a plain airfoil, or =

0. 6 (with trailing flap). Although “the abruptness of the stall was reduced” by suction, a margin of some 2 or 3 degrees in the two-dimensional angle of attack may not be considered to be satisfactory in the practical operation of an airplane. In the second phase of the investigation, another slot was added at 51% of the chord. Lift was further increased to CLX =2.4, and = 2.9 (with trailing flap). Stalling returned to being really abrupt, however. The drop from Cl = 2.4, is estimated to be down to CL =

0. 8 (as in NACA Rpt 824, without flap and without suction). In conclusion, this type of suction boundary layer control to increase of maximum lift, does not seem to have a practical value. It should also be noted that without suction, the presence of the slot reduces the maximum lift noticeably.

Distributed Suction. A slot such as in figure 33, for example, also has a sink effect (thus also drawing some air from upstream). Since this effect is comparatively small, the location of a slot having a width between 0.1 and

0. 6% of the chord, can be expected to be critical. As in suction applied to the nose of trailing edge flaps, see

LEADING-EDGE OR NOSE FLAPS

Figure 34. Maximum lift of the 63-012 airfoil section, as a func­tion of suction (23,c) through a narrow slot near the leading edge.

(24) Area Suction around the airfoil nose:

a) Gregory, 63A009 Section With Nose Suction, ARC RM 2900 (1952).

b) Pankhurst, Stalling Properties, ARC RM 2666 (195 3).

c) Nuber, 64A212 Airfoil, NACA TN 1741 (1948).

d) Dannenberg, 10.5% Section, NACA TN 2847 & 3093 (1952/53).

e) Hunter, Flight Investigation, NACA TN 3062 (1954).

f) Weiberg, 0006 Airfoil, NACA TN 3285 (1954).

Lift Increments. Two other airfoil sections with area suc­tion near the nose, are shown in figure 35. The maximum lift coefficient increases with the chordwise extent of the porous area (indicated by the flow coefficient CQ) in a manner similar to that due to slot suction, in figure 34. That is, leading-edge separation is more and more post­poned, until at constant angle of attack (shown for a: = 14°) a certain plateau of lift is reached. The fact that the maximum lift continues to increase as the suction flow increases, can be explained by a general improvement of the boundary-layer flow along the upper side of the air­foils tested. The behavior of the 10.5% airfoil is different, however. Separation from the leading edge (indicated by the area “S”) is first eliminated. As above at constant angle of attack, a constant lift level is then reached, at CQ = 0.0015. Further increased nose suction does not post­pone further stalling then taking place from the trailing edge. — The “most economical” extent of nose suction in the 63A009 section, is around 3% of the upper surface. When using a trailing flap, the increments in figure 35 may be slightly smaller (ACl = 0.4 or 0.5) than those for the plain airfoils (ACl = 0.5). In other words, more suction is required to handle increased BL losses and pressure gradi­ents.

Rc = 1.2(10)6

LEADING-EDGE OR NOSE FLAPS

Figure 35. Maximum lift of symmetrical airfoil sections, as a function of the flow coefficient indicating boundary-layer control by suction through a porous area near the leading edge.

Porous Materials are needed to form the surface of an airfoil where boundary-layer control by suction is used. Various materials are listed (24,d) such as perforated sheet metal, paper, sintered metal, felt, wood, ceramic. Since the outside pressure is not constant in chordwise direc­tion, suitable combinations (in layers) are selected in such a manner that any return flow across the porous area is avoided, and the suction velocity is kept reasonably uni­form. The permeability of any porous material is reduced when wetted. As reported in (24,b) sintered bronze be­comes “saturated” in a rain fall of 1 inch/hour, within 3 minutes, so that the suction velocity (at constant pump power) reduces to 40%.

The Pressure Required to move air particles from outside, into the hollow nose of the airfoil, primarily corresponds to the local static pressure coefficient at the surface. It should be noted that theoretically the total pressure (p + q) is to be considered. Within the boundary layer, the dynamic pressure q is low, however. For the 0006 suction discussed above, at Cu = 1.3, the coefficient of the static pressure differential is between Cp = — 30, directly at the nose point, and Cp == — 10, at the end of the 1% suction area. With a standard (20% and 60°) split flap deflected from the trailing edge, the Cp values are – 55, and – 20, respectively. As mentioned above, there can thus be a “circulation” of flow in and out across the suction area. — When sucking through a slot, there is some loss (due to sharp edges). Across a porous material, the loss is likely to be appTecIable. Approximately, the differential is д p — w, where w = Q/Sa = average velocity through the porous area. In the tests discussed (24,f), the suction velocity was in the order of w = 0.1V. For example, for w = 10 ft/sec, the pressure differential through the particular material used, is some 270 lb/ft2 . Considering this and a similar composition (of wire “cloth” and sheet metal) used in flight tests (24,e) a corresponding coefficient in the order of A CP =: 10 may be assumed. Summing up, a static pressure differential corresponding to A CP be­tween 20 and 60, would thus be required to operate the 0006 suction system as needed. If including half of the potential dynamic pressure at the location of suction, we are left with a coefficient between 15 and 35. Static pressure coefficients of the 10.5% thick section in figure 35, are appreciably lower than those of the 0006 section. When approaching CLX, the minimum pressure peak reaches Cp = — 12, reducing to about half of this value at the end (at 3.5% of the chord) of the most effective suction area.

Stalling. The quality of the stall of the airfoils in figure 35, is similar to that in typical tunnel-tested symmetrical sections, with little margin some 2° of the angle of attack and a drop, for example from CL =1.8 or 1.7, probably down to 0.8 (as for the plain airfoil, in NACA Rpt 824). Although there is an improvement in stalling quality over the really abrupt type as in airfoils with slot suction, distributed suction (from near the leading edge) does not seem to be perfect either. Regarding other aspects of this subject, are covered in Chapter V.

(25) For definitions of CU. and CQ et cetera, see under “blowing” in the chapter on “trailing-edge high-lift devices”. Including losses in a blowing slot, the flow coefficient obtained, may only be 50% of (s/c) /Cp.

Подпись:In a Cambered Airfoil section, with a well-rounded upper side, separation (stalling) starts from the trailing edge. Boundary-layer control at or from near the leading edge is, therefore, not of very great value, as illustrated in (28,b), in comparison to blowing, the influence of suction is also more or less limited to the elimination of the boundary layer arriving at the slot. — The cambered section 64A212 was investigated (24,c) between wind – tunnel walls. A 2412 wing was flight-tested (24,e) on a small airplane. Principal results are as follows:
NACA 64A212 airfoil @C* = 0.002 CLX increased from 1.28 to 1.59 NACA 2412 wing @ Cq = 0.001 CLX increased from 1.30 to 1.62

Other results of the flight tests are:

a) With porous area, but without suction, CLX – 1.2 only.

b) Suction power may have been too small.

c) Some 60% inboard suction was as effective as full-span.

d) With small wing flaps down, CLX = 1.6, increased to 1.8.

e) With power and propeller on, there was hardly any increment.

f) In heavy rain, the suction power is doubled.

A Nose Flap. With a nose similar in shape to those in figures 21 and 22 a large increase in CLX is obtained when the boundary-layer material is removed around the knee.

As shown in figure 36, C^x is increased from around 1.4 to 2.2. In fact, this type of flap is only effective when used in combination with suction. It is possible that without suction (and with a sealed surface) laminar sepa­ration takes place at or behind the bend of the flap. With a deflection 6C = — 40° rather than 20° the quality of stalling seems to be good, particularly in view of the 65-series foil section involved.

Trailing Flap. In combination with a part-span suction controlled trailing-edge flap, the lift coefficient of the airplane configuration as in figure 36, is increased from CLX = 1.86 without nose flap to 2.00 with 6 = 30° to

2.42 and with 60 = 40°, CQO = 0.003 to 2.65 (when adding vortex generators “VG” as shown). These values may not look as impressive as those likely to be found as the result of two-dimensional airfoil investigations. In­cluding part-span effect and fuselage interference, they are close to reality, however. [56]

Power Required. As stated under i4pressure required”, directly at the nose, the external pressure coefficients of the 10.5% thick airfoil (figure 35) are considerably lower in magnitude than those of the 0006 section. The chord – wise dimension of the suction area required, is threefold, however. Roughly, the same internal suction power may thus be needed. This power can be determined, using the methods as presented in Chapter V. In doing so, inlet and outlet pressures of pump or blower have to be considered. Near the leading edge, the dynamic pressure (0.5 p Ua) of the potential outside flow can be very high, say 20 times the ambient dynamic pressure. Since primarily boundary-layer material is sucked into the wing, only some fraction of that pressure is recovered. When con­sidering the outlet pressure (against which the pump is working) there are two possibilities:

a) discharge at some place, say into ambient pressure,

b) Подпись:blowing over a trailing-edge flap.

Подпись: for CP = constantПодпись: (25)Подпись: for s/c = constantLEADING-EDGE OR NOSE FLAPSПодпись:Since the static pressure is low around the bend of a deflected flap, such a combination would be com­paratively efficient. – Disregarding dynamic pressure, and when blowing into ambient pressure, the equivalent drag coefficient for a boundary-layer control system at or near the leading edge, would be in the order of
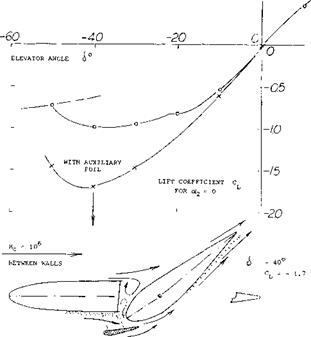
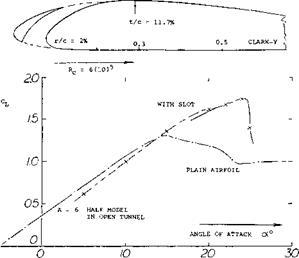
ACd = CQ Cp = 0.001 (20 to 60) ^ 0.04 (24)

where the numerical values are those of the 0006 section discussed above. Taking into account an internal ef­ficiency of 50% (in ducts, blower, engine transmission) we may have a &CD = 0.08. This would be as much as the drag of an average airplane at CL ~ 1.1, or 50% of that at CL ^ 1.6.

Takeoff. Theoretically, all the engine power of an airplane would be available for bo’undary-layer control purposes, when landing. Takeoff might be equally important, how­ever, and the estimate above implies that drag and engine power required during takeoff, would possibly by 50% increased when using leading-edge suction. One must also consider cost, weight and complexity of the system. After discussing and referencing these drawbacks, Wagner (21,e) therefore comes to the conclusion that suction in chord – wise or spanwise combination with blowing (.also using new principles of pumping and powering) would be a more acceptable proposition.

CHAPTER VI — LEADING-EDGE HIGH-LIFT DEVICES

An important (or predominant) limitation of lift to be obtained in wings, is flow separation from the leading edge. Means of preventing or postponing such separation are, the use of leading-edge slots or slats, camber or the deflection of nose flaps, and boundary-layer control (blowing or by suction).

These devices are used to increase the maximum lift and/or to prevent stalling from the wing tips, thus pre­serving lateral (aileron) control. All types of leading – edge lift-increasing devices function by increasing the angle of attack where stall takes place. They thus control separation, while lift (circulation) is basically controlled by the position of the trailing edge (by angle of attack, with or without a flap).

CHAPTER VI — LEADING-EDGE HIGH-LIFT DEVICES

Figure 1. Horizontal-tail configuration tested (1) in a two-dimensional water tunnel; influence of a slot forme і between elevator nose and fixed auxiliary airfoil on the negative lift in the landing condition of an airplane.

I. INFLUENCE OF SLOTS AND SLATS ON LIFT

Slots or slats are an effective means of preventing or postponing separation from the leading edge and they may help to postpone separation from the trailing edge. There are generally three types of leading edge devices;

1) fixed slots near the leading edge,

2) auxiliary airfoils ahead and above the leading edge,

3) extendable or automatically moving slats.

Principle. Boundary-layer control by means of a slot (such as in slotted trailing-edge flaps) is based on the concept of injecting momentum into a “tired” boundary layer. Near the leading edge of a wing the boundary layer is small however. In addition to the supply of momentum to the boundary layer the following mechanism seems to be important for the effectiveness of leading-edge slots or slats. Considering airfoil plus slat to be an entity, it is seen in figure 13, that the peak of the negative pressure distri­bution, is loaded onto the slat. Peak and subsequent positive pressure gradient on the “main” part of the airfoil, are thus appreciably reduced. Whatever boundary layer is formed along the upper side of the slat, is carried downstream as a thin sheet between the outer flow and the “jet” of fresh air exiting from the slot. In other words, the thickness of the boundary layer developing along the upper side of the airfoil, is reduced by the presence of a slot or slat. Still another important property of slots is demonstrated in Chapter V on “trailing-edge devices” (for all types of slotted flaps) or in figure 1 that is in a converging slot (as in a nozzle) an equalization of total pressure takes place, even though there may be a heavy boundary layer and/or separation at one side of their entrance. As a consequence, the efflux of momentum is comparatively uniform; and such slots are a suitable means of feeding momentum into the boundary layer at the upper side of flaps or airfoils. In the horizontal-tail configuration, as in figure 1 the maximum value of the negative lift coefficient is thus increased from 1.0 to 1.7.

(1) Hoerner, Investigation of a Horizontal Tail Configuration, Fiesler Water Tunnel Rpt 14 (1939).

Fixed Slots. In the period of airplane development after 1930 efforts were undertaken to avoid or to reduce the structural complications of movable slats (see later). A fixed slot can be obtained simply by cutting a passage through the nose of and airfoil. With fixed slots such as shown in figure 2 the lift continues to increase above the angle of attack where the original plain wing stalls. Here as in the case of slats the lift at smaller angles at attack is somewhat lower than that of the plain airfoil. Similar results are reported in (2,b) for the more modern 23012 section. Leading-edge slots have been combined with other slots placed along the chord (2,c) eventually forming a cascade of vanes (2,c) and/or a combination with a trailing-edge slotted flap. Maximum lift coefficients up to the order of 4 have thus been obtained. However because of the lower structural design (strength) and performance at the low lift coefficients of high-speed flight such arrangements cannot be considered to be practical.

Drag. Assuming that a fixed slot would be effective by postponing separation and increasing lift its presence will increase the wing drag in the cruising and/or high-speed operation of an airplane. By rounding the leading edge of the main airfoil, the drag can be kept “low”. Fcr example, the coefficient of the shape as in figure 2, is in creased by ACos 0.01, in cruising condition, at CL = 0.3 (and up to CL = 1.0). When designing (around 1937) the Fieseler “Stork” (3) which would today be called a STOL aircraft, the principal requirements were low weight (aided by structural simplicity) combined with high lift. It was, therefore, decided to use a slat or slot of the conventional shape (3,a) and to leave it in extended position, accepting the added drag when flying at lower lift coefficients (such as at cruising speed). Water-tunnel tests reported on page

6- 14 of “Fluid-Dynamic Drag” revealed, however, that there is a minimum of sectional drag associ^ed with a fixed slot, provided that there is no flow through the slot (between slat and wing). The angle of attack where this flow pattern was obtained, could be controlled by slightly adjusting the trailing-edge wing flaps. As reported in (3,b), the section-drag coefficient of the wing was thu s reduced from CD5 = 0.030 to 0.018, at CL = 0.3; and this magnitude was considered to be acceptable in a STOL-type airplane such as the “Stork”. Even at the optimum lift coefficient (where the flow through the slot is smooth) slats produce some additional drag; the differential is in the order of ДСоэ = 0.01.

(2) Airfoils with fixed leading-edge slots:

a) Handley Page in “Aeronautical Journal” 1921 p 270.

b) Weick, Clark-Y Wing With Fixed Slots, NACA TRpt 407 (1932).

c) Weick, Multiple-Slotted Clark-Y Airfoil, NACA TRpt 427 (1932).

d) Bamber, 23012 With Several Forms of Slots, NACA TN 702 (1939).

s/c = 2%

CHAPTER VI — LEADING-EDGE HIGH-LIFT DEVICES

Figure 2. Example for a fixed slot cut into an airfoil (2,b).

Auxiliary Airfoils. Another way of avoiding the complications of slat mechanism is to place a low-drag auxiliary “vane” ahead and above the leading edge of an airfoil, in fixed position. For maximum lift, the position of such an auxiliary foil would be similar to that of slats forming a suitable converging nozzle “around” the nose of the main airfoil. Drag at low lift coefficients however is very high. Therefore, when selecting an “optimum” posi­tion, both the lift at high angles of attack, and the drag at lower lift coefficients must be considered. Full scale tests of a fixed auxiliary airfoil on a light twin aircraft are given in (4,c) another such compromise is shown in figure 3. Performance of various configurations is claimed in (4,a)

to be as follows:

Configuration

mm

Llx

Cw/C,

Clark-Y plain wing

0.015 (0.015)

1.30 (1.30)

86

fixed slot (figure 2)

0.023 (0.022)

1.75 (1.65)

76

with auxiliary foil

0.019 (0.016)

1.95 (1.70)

104

with automatic slat

0.016 (0.014)

1.84 (1.63)

114

(3) Fieseler “Stork” Fi-156, with fixed slat or slot:

a) Krassilschikoff, Optimum Configuration (used in the “Stork”), САНІ (Moscow) Rpts 105 (1931) 133 and 161 (1934); see Luschau 1936 II (2) and (9).

b) Petrikat, “Stork” Airfoil With Slat, Fieseler Water Tunnel Rpts 6 and 12 (1939); see Ybk D Lufo 1940 p 1-248.

c) Hoerner, Flight Testing the “Stork”, Lilienthal Paper ZWB 099/006 (1938), see Luftwissen 1940 p 202; also Translation by Mississippi State College (1956).

d) The 1500 “Storks” (1939/43) were preceded by one “Gugnunc” biplane (built by Handley Page in 1928) winner of the “Guggenheim Safe Aircraft Competition”; see report on that competition, New York (1930).

e) The “Stork” has been imitated several times; see for example Pleines, Application of Slotted Wings, in (28,1). The last airplane of this type is the Dornier-27; with flaps, slats and propeller slipstream, CLX =5.3.

The numbers in parentheses are based on combined “wing” area of airfoil plus slat or auxiliary foil, while the other numbers are on Clark-Y airfoil area. — There are two objections, however, to these experimental results:

a) The Reynolds number of the auxiliary airfoil is only 9(10)4. Different optimum locations and larger lift increments may be expected at higher R’numbers.

b) Arms are needed to support any slat or auxiliary foil. They must be expected to increase drag, and to reduce lift (including its maximum).

CHAPTER VI — LEADING-EDGE HIGH-LIFT DEVICES

CHAPTER VI — LEADING-EDGE HIGH-LIFT DEVICES

Figure 3. Optimum combination (providing maximum CLy /CD mm) of and airfoil (4,a) with a fixed auxiliary foil, placed ahead and above the leading edge.

(4) Investigation of airfoils with fixed auxiliary foils:

a) Weick, Clark-Y With Various Shapes, NACA TRpt 428

(1932) .

b) Weick, With Various Chords and Shapes, NACA TRpt 472

(1933) .

c) Fink, Fixed Auxiliary Airfoil or Slot on Lis. ht Twin Aircraft, Full Scale Test, NASA TN 7474.

(5) Investigation of airfoils with slats:

a) Wenzinger, Clark-Y Wing With A = 6, NACA TRpt 400

(1931) .

b) Jacobs, Airfoils Function of R’Number, NACA TRpt 586 (1937).

c) Weick, Fowler Flap and Slat, NACA TN 459 (1933).

d) Quinn, Combination With Flap and BL Control, NACA TN 1293 (1947),

e) Moss, Three Different Slat Chords, ARC RM 270:5 (1952).

f) Axelson, 64A010 Airfoil With Slat, NACA TN 3129 (1954).

g) Townend (NPL), Slots and BL Control, J RAS 1931 p 711.

h) Ormerod, Bristol Fighter, ARC RM 1351 (1930) and 1477

(1932) .

When calculating the wing area, aspect ratio, lift-curve slope and induced drag, it does not matter whether the basic airfoil chord, or the combined area of airfoil plus auxiliary foil is used. The pitching moment of this con­figuration is like a tandem system with considerable inter­ference. For the configuration as in figure 3, the center of pressure is constant at 20% of the Clark-Y chord, between CL =0.7 and CLx, while the CP of the plain airfoil is at and aft of 30% of the chord.

Maxwell Slat. A seemingly simple slat mechanism is shown in figure 4. The moving parts operate only by rotation, about fixed hinge axes. To close the slot, the slat is turned until it touches the upper side of the airfoil, and a plate is meant to cover the inlet at the lower side. The reference wing chord is the total (including the slat). Wind-tunnel tests (6) show this configuration to be effective in regard to lift, and efficient as far as drag at small lift coefficients is concerned. There are two reasons against this type of slot, however:

1) rotation alone does not provide any optimum location of the slat,

2) structurally, the system may be as complicated as really retracting the slat.

OPTIMUM GAP = 3.5% c

CHAPTER VI — LEADING-EDGE HIGH-LIFT DEVICES

Figure 4. Example of a so-called Maxwell slat (6,b). The slot is obtained by moving two parts about a fixed axis.

(6) Investigation of so-called Maxwell Slats:

a) Gauvain, Clark Y Maxwell Slat, NACA TN 598 (1937).

b) Lowry, 23012 Wing With 30% Slat, NACA WRpt L-693 (1941).

c) Gillis, 23012 With 18% Slat and Flaps, NACA WRpt L-574 (1941).

d) Turner, Flight Investigation, NACA WRpt A-88.

“Slats" are movable auxiliary airfoils or vanes, extended ahead of the leading edge of an airfoil to help the flow at higher lift coefficients, to get around that edge. At smaller lift coefficients (at higher flying speeds of an airplane) the slats are not needed. In fact, the drag of a far-extended and dipped slat would be prohibitive, see Chapter XVI; within the range of intermediate and low coefficients. As a consequence of separation from the lower side as shown in figure 5, drag coefficients as high as CDS = 0.1 are obtained which is in the order of 10 times that of the clean wing. Therefore, for good airplane performance slats are made retractable or automatic. Aerodynamic and kine­matic development of such slats was first undertaken by Lachmann (7,d) and Handley Page, some time between 1920 and 1930. – The position of a slat in relation to the original airfoil, is defined by

a) extension forward of the leading edge,

b) downward droop or dip,

c) size of the gap at the outlet of the slot,

d) rotation or downward deflection.

CHAPTER VI — LEADING-EDGE HIGH-LIFT DEVICES

Figure 5. Lifting characteristics of a slatted airfoil at two very different Reynolds numbers.

Reynolds Number. For a slat the Reynolds Number based on its chord is an order of magnitude lower than that of the wing section. So, for example, if the landing of an airplane takes place at Rc = 10[52], a wind-tunnel investi­gation may only be conducted at 10^, and the Reynolds number of the slat would possibly be as low as Rs = 1.5 (10) , which must be considered to be critical. Wind – tunnel results on slatted airfoils obtained below 10fe, must therefore be accepted with reservation. Characteristics of a particular configuration are presented in figure 5, for two widely different R’numbers. Several discontinuities are evident for Rc ~ 7(10) ; they stem from partial separations from slat and/or upper side of the airfoil. The variation of the maximum lift coefficient as a function of Rc as in figure 6, looks rather steady. There is a dis­continuity, however, around Rc = 10е*, where a second maximum takes over. One set of points (between 10to and 107) also displays a “sudden” increase of. Some slat configurations have sharp corners, both at the slat and the lower edge of the main airfoil nose. Whether intended or not, these corners might promote turbulent boundary – layer flow through the slot. It might also be tried to stimulate turbulence by trips (surface steps as in figures 8,b or 17,b, for example) or by distributed roughness (or turbulence generators; see later) placed near the outlet of the slot. Results of such tests do not seem to be available, however.

Slat Size. Maximum lift coefficients are plotted in figure 1 as a function of the chordlength ratio of the slat. Foi most of the airfoils tested, there is a sudden increase oj Сцх, at slat-chord ratios between cs/c = 0, and = 10% This increment evidently indicates elimination of leading edge separation. It is not found in cambered sections witl well-rounded noses, where such separation is not present

(8) For shapes of RAF sections (28, 38, 48, 34) see Relf, 6 Aerofoils in CAT, ARC RM 1706 (1936).

CHAPTER VI — LEADING-EDGE HIGH-LIFT DEVICES

) ….. ……… 1————– 1————— L –

о /0 20 Ю%

Subsequently, all configurations tested, show a steady increment of Clx with the slat-chord ratio. It is suggested that lift grows simply because of the extension of airfoil chord. The average rate of growth is

AClx/си[53] [54].~ l+(cs/c) (2)

where CL# = C LX extrapolated to cs/c = zero. The rate is higher than the average in otherwise plain airfoils; and it is lower in airfoils with trailing flaps deflected. In fact, the lines in figure 7 are essentially parallel to each other. They can be expressed by

ACLX = (1.6 to 2.0) c5/c (3)

CHAPTER VI — LEADING-EDGE HIGH-LIFT DEVICESПодпись:CHAPTER VI — LEADING-EDGE HIGH-LIFT DEVICESПодпись:

Подпись: Design Rules. The basic rules for designing suitable slats given in (5,c) are 1. The slat chord should be at least 12% of airfoil chord. 2. The forward extension is at least 60% of slat chord. 3. The angle of the slat (below airfoil chord) should cover the stagnitation point of the airfoil. 4. The slot gap should be around 3% of airfoil chord. 5. The slat thickness near leading edge = 2% of airfoil chord. The angle of dip (rotation of the slat) is found in the same reference to be between 9 ancFi 6°. For wings operating at high lift coefficients slot angles up to 60 are used. When comparing these dimensions with those of the selected configurations in figure 8, it must be realized that structural considerations are a reason for modest extension, while pitching moments (see below) call for small dip. Slats have been tested (5,e) with chord lengths and extensions up to 30% of the chord. They are not considered to be practical, however.
Подпись: Loss of Lift. As seen in figures 2, 4, or 18, the lift coefficient drops somewhat when extending a slat, at constant angle of attack (such as at oC = 10°). For a wing with automatic slats, this means that one wing tip might have 10% less lift than the other one, if there is a delay in the deployment of one of the slats. The loss of lift can be reduced by making the dip and/or slat gap smaller.

The argument of extended airfoil chord does not apply to the Maxwell-type of slats. Nevertheless, they show the same rate of CLX growth as the conventional type of forward-extending slats. We may have some biplane effect here.

c*/c

Подпись: 20

Подпись: a) DERIVATIVE DUE TO CHORD EXTENSION Figure 9. Pitching moments due to leading-edge slats. a) Derivative due to chord extension b) Moment due to camber (dip).

Pitching Moments. When extending a slat into the typical and most favorable position, two things happen: the effec­tive wing chord is increased and when moving the slat down, the airfoil becomes cambered. As a consequence, the pitching moments are changed. As shown in. figure 9, there is a positive increment of dC^ /dCL , which means that the “aerodynamic center” moves forward. The for­ward extension of slats is usually less than their chord length. For an average A x/cg = 2/3, we tentatively obtain

(dC m/4/dCL ) = + (2/3) (cs/c) 0.75

= 0.5 (cs /с) (5)

where 0.75 = (1 – 0.25). This equation is confirmed by experimental results. As a tail-down moment, the deriva­tive is destabilizing. The pitching moment due to camber (corresponding to droop or dip) as in part (b) of figure 9, is negative (nose-down). It thus aggravates the :rim situa­tion caused by trailing-edge flaps. It is shown iri figure 30 of Chapter II, that the pitching moment of 230-type sections (similar in camber shape to that representing slats) increases with the camber location (x/c). A trend of ACmo~ (y/cf is seen, accordingly, in figure 9.

О

10

ЗО

Combination With Trailing-Edge Flap. Basically, a lead­ing-edge slat (or nose flap) increases the angle at which stalling takes place by a given increment. This increment may be the same when adding the leading-edge device to an airfoil equipped with a trailing-edge flap. The result can be expected to be a “very” high maximum lift coefficient. An example of such a configuration is presented in figure

10. There is a large hysteresis loop, reaching over some 25* of angle of attack (for A = 4). Without a slat, a 10° wide loop was found in the same test conditions. Such loops have also been found in airfoils without slats, evi­dently in the critical range of the Reynolds number where leading-edge separation disappears, see Chapter IV. If the hysteresis persists at larger full-scale Reynolds numbers, it can or has to be eliminated by means such as so-called double-slotted flaps (see Chapter V) or possibly by turbu­lence generators (on slats or ahead of trailing flaps). An­other combination of slat and flap is illustrated in figure

11.

Подпись: FLAP <0° (0°) F' WD 9%c (94) DOWN 64c (44)
Подпись: Figure 11. Lifting characteristics of an airfoil (7,c) with slat and trailing-edge flap.
CHAPTER VI — LEADING-EDGE HIGH-LIFT DEVICES

Although the Reynolds number is appreciably higher than that in figure 10, the maximum lift obtained with a hardly extending flap is not higher.

CHAPTER VI — LEADING-EDGE HIGH-LIFT DEVICES

Ю 20 ЗО 4C 50

Figure 10. Example of a combination of slat with trailing-edge flap (7,a), tested on rectangular airfoil (with A = 4) in open wind tunnel.

Подпись:Подпись:

Подпись: Pressure Distributions. In the beginning of this chapter, it was mentioned that “the peak of the distribution is loaded onto the slat”. This is not quite the case as seen from the pressure distribution plot figure 12. We can argue, however, that the load is evenly distributed, be-tween slat and main-foil nose. Therefore, the minimum pressure coefficient might be reduced from Cp =: — 6, for a similar plain airfoil at the same lift coefficient, to — 3, as tested for a combined CL =1.5. Distribution or load on the slat depend, however, upon shape and position (dip and inclination) of the slat. Figure 13 shows, for example, a peak value for the slat of Cp = — 8, while that of the main airfoil is only - 3. In this case, the slat lias really taken over the leading-edge load. In fact, when deflecting a trailing edge flap slotted, at 30 or 40 , for a CL ~ 2.8 the slat-pressure peak is roughly doubled, while that on the main-foil nose is only modestly increased. Such considerations can be useful when designing slat configurations. Although at present the design of slots is a trial and error process good progress is being made in solving the problem with the use of high speed computers. This should give important improvements in the design.

Combined Pitching Moments. Trailing-edge flaps produce nose-down pitching moments of a considerable magni­tude. As shown in part (b) of figure 9, the moment due to dip of a slat (added to that of a flap) makes trimming of an airplane difficult. Considering “optimum” slat position producing maximum Cu , a larger dip (larger by 1 or 2% of the airfoil chord would be desirable, in combination with a flap. Some compensation by the positive derivative as in part (a) of figure 9, may help to trim an airplane; it reduces stability, however unless the flap contributes a negative component. With a Fowler flap as in (7,b) used in combination with a slat, the pitching moments are ob­tained at CL between 2 and 4, are of the order of Cm/4 = – 1. As a matter of interest, the “viscous” section drag is in the order of CDS = 0.1. Both these values are about 10 times what they are in an average plain airfoil section. It should also be considered that the negative lift in the horizontal tail, required to balance the pitching moment, reduces the lift gained by the lift device. This negative lift may correspond to a reduction of CLX of 0.1 or more.

Slat Forces. As shown in figure 14, the forces (practically equal to those normal to the slat chord) might statistically be approximated by straight lines corresponding to

ACfs « ACn3 ^ K(CN or Cu ) (10)

where “s” indicates forces referred to “inclined” slat area; and CL the combined lift of the configuration referred to the basic airfoil chord or area. The factor К is between 3 and 4, for slats in extended position. Disregarding the fact that the flow separates (at lift coefficients say below 0.5, from the lower edge of a slat, provided that it remains extended) the lines in figure 14 are shifted laterally by certain values of A CL ; that is, by airfoil-section camber, by dip and/or by trailing-flap deflection. Therefore, in­creased dip or deflection of a trailing flap, considerably reduces the slat load (for the same lift coefficient). The maximum loads are considerable, however with or with­out a flap and are in the order of Crs = 4 or 5.

CHAPTER VI — LEADING-EDGE HIGH-LIFT DEVICES

Figure 14. Slat normal forces (referred to slat-chord area) as a function of the combined lift coefficient.

kinematic system. Therefore, direction and location (cen­ter) of the slat force (rather than its magnitude) are responsible for its automatic transfer (out and in again). — As to the location (or center) of the slat force, along its subtangent chord line, the data in part (b) of figure 15, roughly indicate a comparatively constant value around x/cs = 40%; that is at higher lift coefficients.

Inclination. Regarding direction, figure 15 shows that oC $ = 90° may be reached at Cu between 0.2 and 0.4, in “conventional” airfoil sections. The slat force then tilts forward to between 70 and 60°, at CL between 0.8 and

1.0. Upon opening (moving forward, above CL = 1.0) the angle remains essentially the same. As the lift coefficient (or angle of attack) is increased, the force tilts forward more and more, thus causing the slat steadily to move forward.

CHAPTER VI — LEADING-EDGE HIGH-LIFT DEVICES

Figure 15. Direction (inclination) and location (center) of slat forces, as a function of the lift coefficient.

CHAPTER VI — LEADING-EDGE HIGH-LIFT DEVICES

Line of Force. To understand the nature of the slat force, it may be remembered that the tangential (chordwise) force of any airfoil section changes from positive (in the direction of drag) at smaller lift coefficients, to negative (“forward”) at higher coefficients. To move an “auto­matic” slat out, a force is evidently required in the direc­tion of its chord line, or of the motion as directed by its

Kinematics. The mechanical mechanism permitting the slat to move, must be such that the extension takes place at higher lift coefficients (when needed) and in a smooth (continuous) manner. As illustrated in figure 17, there are two or three ways of doing this. As the angle of attack or the lift coefficient is increased, the slat forces eventually pull the slat out and move it forward. To design a smooth-working mechanism, center and direction of the slat force, as discussed above, have to be known (10).

Подпись:CHAPTER VI — LEADING-EDGE HIGH-LIFT DEVICESCHAPTER VI — LEADING-EDGE HIGH-LIFT DEVICESo) LATERALLY FOLDINS LINKAGE SYSTEM

Figure 17. Three types of mechanical mechanisms, which can be used to extend a slat, or to let it move by itself.

(9) Investigation of automatically moving slats:

a) Bradfield, RAF Airfoil Wings, ARC RM 1190 and 1204 (1928); see also same type slats in RM 1192 and 1214.

b) Jennings, Flight Tests Linkage Variation, ARC’ RM 1677 (1932).

c) Petrikat, Slats in Water Tunnel, Ybk D Lufo 19 40 p 1-248; see (3,b).

d) Lachmann, Practical Information; ZFM 1923 Issues 9 & 10 p 71; ZFM 1924 Issue 10 p 109; ZFM 1930 Issue 16 and 17. See also his book (28).

e) Braun, Optimum Slats and Slat Kinematics; Messerschmitt Rpts ТВ 33 & 34, ZWB UM 7835 (1941) and 7836 (1942). Translation of TB-33 by North American Avaiation CADO ATI-32590.

The linkage system as in figure 16 was developed (9,c) both analytically and by experiment. Assuming that the line along which the force is acting, remains constant, the motion of the slat will be steady and stable, as Jong as the instantaneous pole point (determined by the two lever lines) remains behind and/or above the force line. For­ward extension and the size of the slot gap increase if the kinematic is arranged in such a manner that the pole point moves up, along the force line. Part (b) of figure 16 shows how the translation of the slat takes place:

at Cl = 0.9, the slat begins to move forward, at CL = 1.3, it reaches a limiting stop, returning, the slat is fully retracted at Cl. = 0.8.

When using a trailing-edge flap (or an aileron), start and termination of the slat motion take place at lift co­efficients changed corresponding to flap deflection. Roughly, transfer (out or in) occurs at the same angle of attack.

Slot Pressure. The assumption that the slat force or at least its line of action remains constant, is not completely correct because of a certain variation of the pressure between slat and leading edge of the “main” airfoil. This pressure can become critical in the “closed” position of the slat. Average pressures corresponding to Cp = – 0.5, and up to – 1.2 are reported in (9,e) for example. Positive pressures are, on the other hand, found in (11 ,d) corre­sponding to Cp = + 0.1, and + 0.2, for a slat which has a small gap at the lower (pressure) side of the airfoil. A dangerous situation can arise when the trailing edge of the slat does not precisely fit onto the surface of the airfoil, thus leaving open a small gap at the upper side. The negative pressure thus developing is bound to keep the slat back up to a lift coefficient above that where it ordinarily would move forward. Subsequently, the slat will jump or pop out (suddenly) possibly banging against its stop.

Sliding Slats. In thin airfoil sections, a linkage system such as in figure 16, is structurally restricted by the wing thickness near the leading edge. The alternative solution as in part (c) of figure 17, has the disadvantage of moving the slat in spanwise direction. A more suitable design is shown in part (b) of the illustration. The slat, or a sup­porting pair of attachments, move along rails or tracks (by means of rollers).

(10) Some of the modern airliners (as the Boeing 707 or 727, for example) have slats installed near the wing tips. It seems, however, that any automatic function is not considered to be practical or reliable. Instead, the slats are extended together with the trailing-edge flaps, by means of an hydraulic actuator. The slats are also out during takeoff.

Stall Control The purpose of using leading edge slats (or slots) is twofold, to increase the maximum lift coefficient and/or to prevent wing-tip stalling. Since a large number of accidents are caused by wing stalling the use of slats can be an important safety device. When using slats to protect the wing tips, overall lift is usually not: increased. Safety and controllability are increased, however, and the operational margin of lift below the maximum can safely be reduced. In a wing with part-span slats, two* stalls take place, one at the angle of attack where the unslotted portion (in the center of the wing) loses lift, arid the other one at a higher angle of attack where the flow over the wing tips (although protected by slats) also separates. The lift of such a wing is shown in figure 18. Note there definitely is a dip between the two maximum lift condi­tions. For satisfactory roll stability, the lift curve slope of the outboard parts of the wing panels should remain positive. Control by means of ailerons, may still be avail­able, up to the “very” high angle of attack where the second maximum of the lift coefficient is found. Even beyond that maximum, there is increased lift due to the presence of the slats.

CHAPTER VI — LEADING-EDGE HIGH-LIFT DEVICES

CHAPTER VI — LEADING-EDGE HIGH-LIFT DEVICES

Figure 18. Lifting characteristics of a model wing (12,a) equipped with various lengths of outboard l’edge slats.

Span Ratio. The small high-wing airplane as in figure 19, was flight-tested (12,b) with various lengths of slat placed ahead of the leading edge, beginning from near the wing tips. At a constant angle of attack of 16°, total lift increases slightly with an increase in the slat length. For span ratios up to 0.6 or even 0.7, the maximum of lift reported, is evidently the first of the two mentioned above. For comparison, the maximum values of the wing in figure 18, have also been plotted in the graph. It then becomes apparent that under realistic conditions (in­cluding elevator effectiveness) the maximum lift is only really increased when extending the slats to the fuselage. A classical example of such an increment is the “Stork”; including the slipstream effect, lift coefficients were ob­tained (3,c) of CjJ( = 2.7 without, and of 3.9 with 40° slotted wing flaps.

CHAPTER VI — LEADING-EDGE HIGH-LIFT DEVICES

Figure 19. Flight-tested maximum lift of a high-wing airplane (12,b) as a function of the span ratio of outboard l’edge slats.

(11) Pressure distributions around, and loads on slats:

a) Jacobs, Slotted RAF-31 in VDT, NACA TN 308 (1929).

b) Wenzinger, Loads on Slats and Flaps, NACA TN 690 (1939).

c) Harris, 23012 With Slot and Flap, NACA TRpt 732 (1942).

d) Arabian, On Swept Wing, NASA TN D-900 (1961).

(12) Characteristics of part-span slots or slats:

a) Weick, Wing-Tip Slots, NACA TN 423 (1932); see also Lateral Control With Slots in TN 443 (1933).

b) Weick, Lateral Control in Flight, NACA TN 2948 (1953).

c) Hollingdale, Analysis Load Distribution on Tapered Wings With Part-Span Flaps and Slots, ARC RM 1774 (1937).