Category FLUID-DYNAMIC LIFT

MAXIMUM LIFT DURING LANDING

Besides stability and control, the primary requirement for landing is high lift to reduce the speed at touchdown. This, of course, is accomplished by increasing the maxi­mum lift coefficient of the airplane. In fact, trailing-edge wing flaps were invented and developed as “landing flaps”.

Landing Characteristics. The lifting system needed to give the best landing performance is chosen in a manner similar to that used to find the best configuration for takeoff. For landing, however, the highest CLx possible is of importance as this reduces the speed at touchdown and makes possible a shorter landing roll. Since the glide slope is proportional to the drag lift ratio, high drag during

MAXIMUM LIFT DURING LANDINGПодпись: performance Подпись:landing is desirable as it makes possible a steep approach angle. Practical flying qualities limit the approach angle, however, especially with the larger high speed and high performance aircraft. As the speed is reduced the ap­proach angle can be higher as long as adequate control power is available.

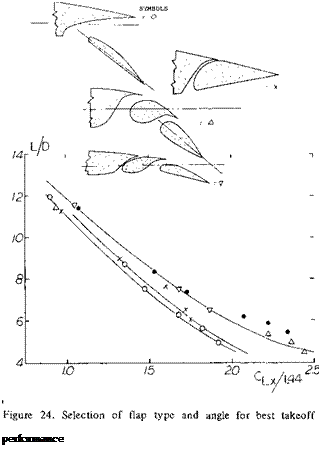
Although high drag may be desirable along with high levels of during landing, it may be necessary to abort the landing in which case the lift drag ratio again must be high. For the aborted landing condition the problems of flap and wing designs are like the takeoff condition. That is, a certain minimum L/D is necessary to provide the rate of climb required see figure 24. In this case, however, the L/D needed is lower as the airplane is usually operating at a lower weight for landing and full power is generally allowed for this condition (19,b).

Full-Span Flaps. The maximum lift will, of course, be obtained with full-span flaps, provided that lateral (and other) control would still be sufficient. The maximum coefficient then depends upon the type of flap, its angle of deflection, the shape of the airfoil, forebody and the Reynolds number as discussed in Chapter IV. However, variation and combination of these parameters leads to hundreds of possibly “optimum” configurations. In order to hold down the number, we will consider the more practical shapes and we will correlate the maximum lift coefficients versus simple parameters such as the airfoil and thickness ratio. As far as the flow pattern at CLx is concerned, it may be correct to say that all types of flaps when used at larger angles of deflection exhibit separa­tion. To say it in different words, the flap stalls first; lift may then continue to rise with the angle of attack; and the final stall may be expected to take place from some­where along the upper surface of the airfoil and possibly at the leading edge of the airfoil. This is the reason for the development of leading edge devices for the prevention of separation as discussed in the next chapter.

(23) Experimental investigation of partial-span wing flaps:

a) Wenzinger, Split Flaps, NACA TRpt 611 (1937).

b) Silverstein-Katzoff-Hootman, Comparative Tunnel and Flight Investigation of Maximum Lift, NACA TRpt 618

(1937) .

c) House, Slotted Flaps on 23012 Wings, NACA TN 719 (1939); continuation of TN 472 (split flaps), TN 505 and TN 663 (split flaps) 1938.

d) Neely, Tapered Wing With Fowler Flaps, NACA WRpt L-134 (1946).

e) Johnson, Flaps on Straight Wing, NACA TN 2080 (1950).

f) Schneiter, Plain-Flap Ailerons, NACA TN 1738 (1948).

g) Sherman, 18 Wing-Fuselage Combinations, NACA TN

(1938) .

PERFORMANCE DURING TAKEOFF AND CLIMB

Although flaps are usually designed for the landing condi­tion, higher lift coefficients will also make possible im­proved performance during takeoff and climb. At these conditions drag becomes an important consideration as the performance is determined by the level of excess thrust. Thus, for improved takeoff and climb performance it will be found that flaps with higher levels of CL* and lift drag ratio are needed.

Flow Pattern. To determine the best flap configuration, it is desirable to understand the flow pattern in and around the flap. Unfortunately, when watching wind-tunnel tests one sees very little. Examination of the drag – and lift forces as tested, and sometimes pressure distributions, will give some indication of the actual flow pattern. For ex­ample, flow separation from the upper side of the flap shows up in reduced lift, increased drag and (if tested) in higher hinge moments. However, some investigations of slotted flaps have been undertaken (14) in a water tunnel where the flow pattern was visible while measuring forces and moments at the same time. Some results are presented in figure 21.

a) In neutral flap position, there is a stationary small vortex within the slot entrance. Such a vortex consumes little energy, provided that the outlet of the slot is ef­fectively closed (sealed).

b) For the slot shape as shown, the flow separates around the bend of the entrance. As long as this separation is only local, an efficient nozzle flow may develop, as long as the flow remains essentially attached to the upper side of the flap.

c) A bad example of a flow pattern is shown for a deflection angle of 50°. Separation is “complete” within the slot as well as on the upper side of the flap.

Optimum or acceptable slot and flap shapes are discussed below. However, the only straight-forward way of making a single-slotted flap really efficient is to give it a long and flat entrance. In a way, this is done in the case of the Fowler flap (to be discussed later).

Thick Wing Sections. For a certain period of time, sec­tions with thickness ratios in the order of 20% were used. It seems that someone put together the facts

that minimum drag of thick sections (when tested on

smooth wind-tunnel models) is not much higher than

that of wings with conventional thickness ratios,

that very high aspect ratios may result in low induced

drag and long range,

that thick wings could be used to store fuel, as in long-range airplanes.

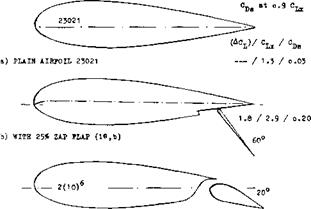
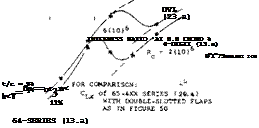
It was therefore found justified to spend money on the tunnel testing of airfoil sections up to t/c = 30% such as in (16c, e,f)- It is interesting to see to what limits one can go in aerodynamic shape. To increase the maximum lift co­efficient of such sections, slotted flaps have been tried (15,d, e,f). The general characteristics of their performance are given in figure 22. The choice of the flap type for these thick sections can be evaluated from a comparison of Cuy and L/D @ CL = .9CLX* Based on this the double slotted type is superior because of the reduced separation and drag.

і

Thrust Available. The takeoff and climb performance is directly a function of the excess thrust available as shown by equation

wc – (T/W – D/W)V = (T/W – 1/(L/D))V

Since the thrust available is here considered to be fixed, the thrust required must be determined and minimized for best performance. The excess thrust is the difference in that available and the total drag. On the ground the drag includes the ground rolling friction, the “parasitic” or

PERFORMANCE DURING TAKEOFF AND CLIMB

o) WITH 26* SLOTTED FLAP (16 ,a) 1.0 / 2.4 / o.06

viscous components, the ideal induced drag and that in­duced component due to the non-elliptical loading. When considering flap performance during takeoff and climb, the drag increase due to deflection and the non-elliptical loading are of primary concern. Also of importance is the maximum lift coefficient at the flap setting being con­sidered.

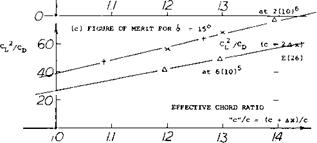
Figure of Merit-T. O. In Chapter I a figure of merit was given for evaluating configuration with respect to the takeoff and climb performance. The peak climb angle is obtained when Cq /cf. , the figure of merit, is a mini­mum. The drag coefficient corresponds to the total at the CL selected. While the value of CD /CL gives a rough idea of the relative merit of a system it does not indicate the full capability, as the CL is not known for the system. A better procedure is to relate the performance to C and the operating rules governing takeoff.

Takeoff Characteristics. The performance at takeoff in terms of field length and maximum gross weight is gov­erned by safety considerations and the corresponding op­erating rules and regulations (19,a, b). These con­siderations generally lead to a requirement of a minimum rate of climb after takeoff with the flaps and landing gear in the takeoff configuration. The rate of climb required must usually be met with the critical engine inoperative. Where the case where power is fixed equation can be rewritten in terms of the lift drag ratio required

L/Dy = 1/(T/W – wc /V) (26)

At the L/Dr given in equation 26 the airplane is generally required to operate at a speed 20% above the stalling speed. This means that the operating Cu is 1/1.44 CL)C for the flaps and landing gear in the takeoff configuration. Thus the takeoff speed is effected by two considerations: the L/D ratio and the CLx. If the flap angle could be changed during takeoff improved performance would be possible, but this is not allowed by the rules and is generally impractical as the pilot work load during a failure is too high.

PERFORMANCE DURING TAKEOFF AND CLIMB

PERFORMANCE DURING TAKEOFF AND CLIMB

Figure 22. Lifting characteristics of 21% thick airfoil sections, tested between walls at Rc = 2(10) , equipped with various types of flaps.


PERFORMANCE DURING TAKEOFF AND CLIMBПодпись: lxПодпись: (a) MAXIMUM LIFTPERFORMANCE DURING TAKEOFF AND CLIMBПодпись: Д CLARK-Y (_20>b) 30% + A = 6 US, a) 26% x 23012 (18,a) 30%

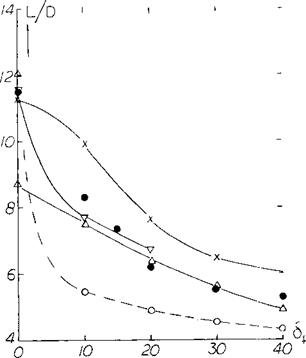
Flap Selection for Takeoff Flaps are usually thought of as devices for improving the maximum lift coefficient and are thus selected for reducing the landing distance. On most conventional powered jet aircraft, however, the field length needed for takeoff is generally longer than that required for landing. Thus, the flap system should be designed to give peak takeoff performance as well as minimum landing distance. Based on the concept of op­erating at a CL that results in the L/D needed to give the required rate of climb at takeoff, the best flap configura­tion and operating angle can be found. This requires determining the lift drag ratio for the complete airplane as a function of flap angle when operating at a CUp = CLX /1.44. The choice of the best flap type and angle for takeoff can be determined from plots such as illustrated on figure 24. On figure 24,a the lift drag characteristics of the total airplane are given as a function of flap angle for various types of flap configurations with NACA 6 series sections (13,a). The lift coefficient corresponding to the flap angles is given on figure 24,b for the same section. Based on a given L/D required to satisfy the climb require­ments the lift coefficient at takeoff can be determined for the given system from figure 25. The flap angle is then found from figure 24,a at the same lift drag ratio and flap type. From these figures the best flap’system is obtained when at the L/D. Based on the data given on figure 24 the double slotted flap is the best of these considered as it generates the highest coefficient for any given lift drag ratio.

Part-Span Flaps have been mentioned above. In a rec­tangular wing, a modest inboard flap deflection can be expected to reduce the induced drag during climb (28 ,e), making the lift distribution more elliptical. In conven­tionally tapered wings, the induced drag is likely t:o be increased. There are elaborate methods available (22) for the determination of load distribution across the span. An approximate procedure of estimating the corresponding variation of the induced drag is presented in Chapter VII of “Fluid-Dynamic Drag”. Another such method is as follows.

Induced Drag. An analysis of elliptical wings with part – span flaps is presented by Young (5,f). For practical purposes it can be said that

c0i = (Cl / ТГА) + K(ACl ) (33)

where C = coefficient of toal lift, and лСь = (&CL) Sf/S, where (ЛС|_) = increment due to flap in two – dimensional flow as in various graphs of this chapter. The factor К is approximately as follows:

К =0.17(1 — (bf/b)) for inboard flaps

= 0.21 (1 — (bf /b)) including a 0.1 b

cut-out

4

G

PERFORMANCE DURING TAKEOFF AND CLIMB

(b) OPTIMUM LIFT

PERFORMANCE DURING TAKEOFF AND CLIMB

Figure 23. Performance of extended-lip slotted flaps (including Fowler flaps) as a function of their translation.

where bf is measured between the ends of the flaps. For example, for bf/b = 0.5, the factor К is ^ 0.04, and^

0. 05 when including 10% cut-out due to the fuselage. It is interesting to note that for a given combined geometric flap span (not including the cut-out) the minimum in­duced drag of elliptical wings is obtained for a cut-out in the order of 10% of the span. As mentioned before, the increments due to flaps, particularly in rectangular wings, are different from those of the elliptical ones stated in this paragraph. We will assume, however, that the basic lift distribution may be close to elliptical, as it actually is in average tapered wings.

CHARACTERISTICS IN THREE-DIMENSIONAL FLOW

In wings with finite span the induced angle of attack and the induced drag have important effects upon the per­formance of flaps.

Limits of Circulation. Any lifting wing deflects a stream tube of air with an effective diameter approximately equal to its span. In engineering language the corresponding downwash angle at the “lifting line” corresponds to the second term in

dc*°/dCL^ 10 + 20/A (20)

“Base” Drag. Behind flaps with separated flow pattern there is a negative base-type pressure. Tests reveal that the magnitude of this pressure behind split flaps deflected 6СГ, corresponds to the coefficients.

C p = -0.55 in two-dimensional flow (between walls)

= —0.60 in wings with full-span split flaps

= —0.45 in wings with part-span split flaps

So, there is a difference in drag due to flaps installed on finite wings. Assuming that the negative pressure has some boundary-layer controlling effect upon the upper side of the airfoil, there is also a possibility that in part-span flaps, quantities such as (aCu) and CLX are somehow lower than in two-dimensional conditions. The negative pressure in full-span split flaps may be explained by tip vortex suction.

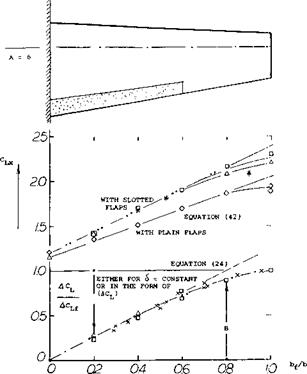
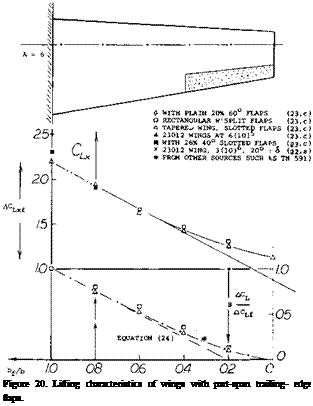
CHARACTERISTICS IN THREE-DIMENSIONAL FLOWПодпись:Подпись:Part-Span Flaps. Figure 20 shows how the overall lift of a wing is reduced as a function of the flap-span ratio. Since the presence of the fuselage usuallymakes it impossible to deflect wing flaps in the very center of the airplane, a function is also included showing how lift decreases when cutting away from the center. Flaps are usually used up to some 0.6 of each half span; and the cutout due to fuselage may amount to 0..1 b. The resultant lift increment of an airplane as derived from the graph, may be some 70% of the two-dimensional values found in the first section of this chapter. This influences the performance in three ways:

• the optimum average lift coefficient is reduced,

• the optimum flap deflection is reduced,

• the induced drag of the wing is increased.

The induced drag will be considered under “takeoff’ and “climb”. The results of part-span analysis (23,c) are plot­ted in figure 20. The subscript “f ’ indicates values for a wing with full-span flaps. The ratio ACL/ACuf can be evaluated for constant angle of attack such as of = zero. For small angles of deflection:

ACL/ACLf =Cl6/CL6, (23)

where CL5 =: dCL/dS. Theory is well confirmed by ex­perimental points. Variations of the function with plat­form (taper ratio) and/or aspect ratio are predicted to be small. For flap-span ratios up to 0.5 halfspan, it can be written:

ACLjACLi я 1.25 (b{ /b) (24)

(20) Characteristics of Fowler and similar flaps:

a) Wenzinger, Pressure Distributions 20 to 40% Flaps, NACA TRpt 620 (1938).

b) Platt; Wing Including Loads, Downwash, Takeoff; NACA TRpt 534 (1935).

c) Wenzinger, Venetian-Blind Flaps, NACA TRpt 689 (1940).

d) Wenzinger, 23012 Airfoil With Auxiliary Tabs, NACA TRpt 679 (1939).

e) H. D. Fowler, Variable Lift, “Western Flying”, Nov 1931 p 31.

0 Harris, 23012 Airfoil With 2 Flaps, NACA W Rpt L-441 (1940).

g) Fullmer, Foil Sections for Lockheed “Vega”, NACA W Rpt L-681 (1945).

Part (b) – Outboard flaps (ailerons).

(21) Rettie, Velocity Around Airfoil Nose, ARC RM 3027 (1957).

Outboard Flaps. The results in part (b) of figure 20, gives the influence of a fuselage on the performance of out­board flaps. It might tentatively be assumed that the loss of lift is

(ACL/ACLf ) = (b-bf)/b (25)

where b – bf = flap cutout in the center of the wing. For determining maximum lift, a similar equation might be used.

Lift Distribution. The problem with part-span wings, is the fact that optimum conditions (providing maximum L/D) in the flapped and the plain parts of the span may not be obtained at one and the same angle of attack. For the modest angle of deflection <5 = 20 , the lift increment due to an average flap is already 0.7

0. 7, while the difference in the optimum coefficient be­tween flapped and plain parts of the wing, only amounts to ACU & 0.2. Thus, a compromise must be accepted and the optimum angle of flap deflection may only be in the order of 10 , rather than 30 or even 40° as suggested by two-dimensional flap investigations. In fact, all the dis­turbances and interruptions of the lift distribution by supporting and actuating devices, by the fuselage and by engine nacelles, make the more advanced wind-tunnel results questionable, particularly as far as flight per­formance is concerned.

CHARACTERISTICS IN THREE-DIMENSIONAL FLOW

CHARACTERISTICS IN THREE-DIMENSIONAL FLOW

CHARACTERISTICS IN THREE-DIMENSIONAL FLOW

Figure 21. Examples for the flow pattern past slotted-flap con­figurations as observed in a water tunnel at RCf above 10 .

V — TRAI LING-EDGE WING FLAPS

2. LIFT CHARACTERISTICS OF SLOTTED FLAPS

To postpone flow separation from the back of deflected flaps, boundary-layer control by means of a slot, opening ahead of the flap nose has been found useful.

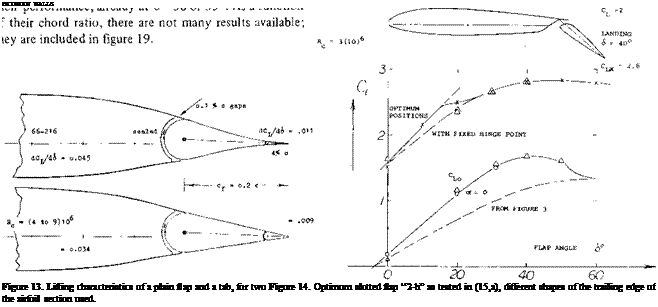
Single-Slotted Flaps. In a systematic investigation of slot shapes (15,a) the one designated as “2-h” (with a some­what extended upper lip) was found to provide the highest lift— combined with the lowest drag coefficients. To obtain the optimum positions shown in figure 14, a complicated kinematic system is required;simple rotation about a suitable hinge point is not optimum for all angles of attack and of deflection encountered during takeoff, climb and when landing an airplane. Lift increments both for fixed hinge point and for optimum positions, are indicated in figure 14. These increments are appreciably higher than those for plain or split flaps (in figures 3 and 6, respectively). However, there is a limit above 5 = 40 , where separation evidently takes place. Other flaps of the slotted type, shown in figure 15, show a deterioration of [51]

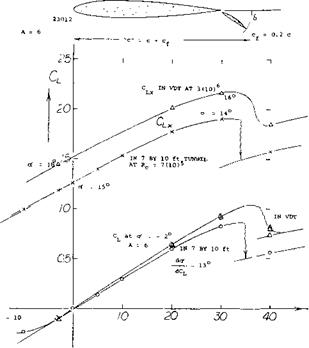
External Flaps. It has been mentioned (under “flow pat­tern”) that a way of substantially improving the perform­ance of flap slots, is to make their entrance long and flat. In the extreme, this design procedure leads to the “ex­ternal” flap, developed at one time by Junkers (17,e) under the name of Doppelflugel (double wing). As sug­gested in figure 1, structural strength necessitates a larger thickness ratio of the “main” airfoil section. The com­bination of main airfoil and flap must be considered to be the lifting wing. Characteristics of such a wing with A = 6, are presented in figure 16. The fact that tests in the NACA’s Variable-Density Tunnel produce a high lift-curve slope (at оC = —2°) may be attributed to the turbulence level in that: facility. The flow past the flap breaks down between 30 and 40 deflection. In aerodynamic respect, the external flap can also be considered to be a Fowler – type.

V — TRAI LING-EDGE WING FLAPS

(17) Characteristics of external flaps:

a) Wenzinger, 23012 Airfoil Between Walls, NACA TRpt 614 (1938).

b) Reed, Fairchild Airplane With 23015 Wing, NACA TN 604 (1937).

c) Platt; 23012 Airfoil, Also With Roll Control, NACA TRpt 541 (1935).

d) Platt; 23012 and 21 Wings, also in VDT Tunnel, NACA TRpt 573 (36).

e) Billeb, Junkers Doppelflugel, Luftwissen Janaury 1935; Translation in “The Aeroplane” 1935 p 269.

f) Bradfield, Junkers Type Ailerons, ARC RM 1583 (1934).

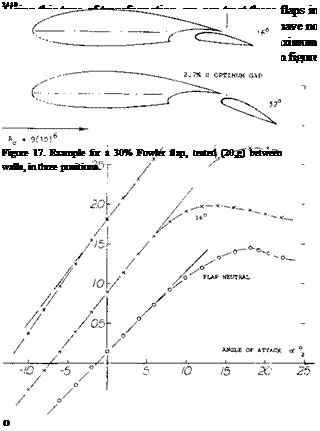
Fowler Flaps. A breakthrough in the aerodynamic design of wing flaps invented by H. D. Fowler. This flap com­bines: a highly efficient slot opening with an effective increase of wing chord. When retracted, the Fowler flap is hidden within the contour of the airfoil section, with only a small gap left (if any at all) on the lower side. Trans­lation and deflection of this type of flap poses some engineering problems, of course. For one thing, the flap has to be moved along tracks; and these tracks are likely to protrude from under and beyond the trailing edge of the basic wing. Also, when effectively increasing the wing chord, the lift-curve slope increases (with the lift co­efficient still based upon the original chord). This increase is shown in figure 17.


і і і n


(b) MAXIMUM LIFT COEFFICIENTS (TRANSFORMED)


FLOW STILL ATTACHED TO FLAP?


FLAP ANGLE 8 *


Figure 16. Example (17) of an external flap (Doppelflugel) as part of a rectangular wing with an aspect ratio of A = 6.


FLOW SEPARATED FROM FIAP


О = 20%

"" AS IN FIGURE 3


Chord Extension. It can be assumed that the lift-curve slope (dCL /dcy ) grows in proportion to (c + Ax), where дх = chordwise translation of the flap when deflecting and extending. Lift characteristics can thus be reduced to those of an airfoil section having the chord “c” = (c + дх), and a flap-chord ratio


= 10%


(a) TRANSFORMED LIFT INCREMENT


Cf /“c” = l/((c/cf) + ( Ax/Cf ))


(17)


V — TRAI LING-EDGE WING FLAPS

Even the – original simple slotted flaps have a small trans­lation to the rear when deflected to a suitable position. For the ideal (fully extended) Fowler flap, the translation is дх = cf. We thus obtain:


100


V — TRAI LING-EDGE WING FLAPS

an effective foil chord


c(l c^ /с),


b) EXTENDED-LIP SLOTTED FLAPS:

23012, END PLATES, EXTERNAL FLAP 20%/1.0 66-(1.5)16, A 6, FOWLER FLAP 30%/1.3

23012, WALLS, EXTENDED LIP 30%/l.2

DITTO, REAL FOWLER FLAP 30%/l.3

23012, EXTERNAL FLAP, A 6 20%/l.2

63-420, WALLS, TRANSLATING FLAP 25%/l. l


(17,a) (23,d) (18,a) (18,a) (17,c) (18,a)


an effective flap-chord ratio

<V /“c” = (Cf /c)/(l + cf /с)


c) FOR COMPARISON:

23012, WALLS, PLAIN FLAP


20%/1.0 (15,a)


ALMOST ALL THE FLAPS ARE TESTED AT Rc 2 or 3-Ю. RESULTS ARE TRANSFORMED TO THE EFFECTIVE CHORD

LENGTH "c" BY DIVIDING THROUGH THE RATIOS LISTED.


V — TRAI LING-EDGE WING FLAPSV — TRAI LING-EDGE WING FLAPS

V — TRAI LING-EDGE WING FLAPS

Figure 15. Lift increments (ACL) and maximum lift coefficients of various slotted flaps in two-dimensional flow, as function of their angle of deflection.

an effective lift coefficient

“CL ” = CL /(1 +cf/c)

(19)

V — TRAI LING-EDGE WING FLAPS

Flaps for takeoff

a) Wimpress, Short takeoff and landing for aircraft, A&A Feb. 1966

b) Title 14 – Aeronautics and Space, Code of Federal Regu­lations 1974

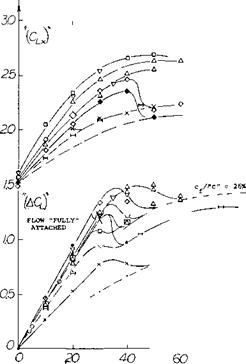
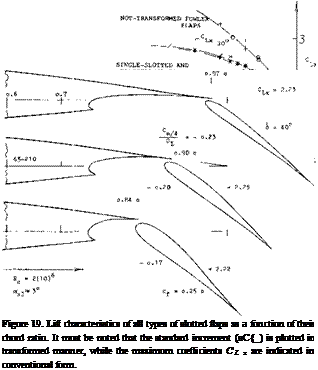
Extended Slot Lip. Fowler flaps have the disadvantage of producing large nose-down pitching moments. It is possi­ble, however, to go “half’ way, such as in the extended-lip flaps show in figure 18. Using the transformation ex­plained above, their lift coefficients are also included in figure 16; and all types of slotted flaps are evaluated in figure 19 as a function of their chord ratio. Extended-lip flaps reach a critical angle, at 6 between 30 and 45°, where flow separation takes place. There is evidence, however, to the effect that these flaps are superior to the simple type, at S = 30*. At this angle, their lift increment is some 20% higher than that of the simple flaps. It is assumed that the long and flat slot entrance, made possi­bly by translation, produces a better flow through the slot with consequent better boundary layer control on the upper side. There are similar critical angles and/or lift coefficients found in the maximum lift coefficients. After separation, the “viscous” drag is higher, but CLX resumes rising after a dip, in a manner similar to that of airfoils with plain or split flaps as in figures 3 and 6, respectively.

II. PERFORMANCE OF WINGS WITH FLAPS where 20 = 180/тґ2 = 18.2°, plus some 10% accounting for non-elliptical distribution across the span and other effects (such as round tip shape, for example). When using wing flaps, producing maximum lift coefficients above 3, at an angle of attack approaching 30°, equation 20 may no longer be adequate. First, theory shows that CL = 2ЇЇ sine* in two dimensional flow. This leads to the first term of equation 20 or 10 ~ 180/2Тґг 0.9 where 0.9 accounts for boundary-layer losses of circulation. Using the sine for o’ = 30° we find a reduction of lift by almost 5%, in two-dimensional flow. At any rate, it is clear that equa­tion (20) cannot by used for lift coefficients approaching the simple theoretical limit for plain airfoils, of CL = 2ТҐ, see Chapter IV as we can obtain for example, when using airfoils and flaps with boundary-layer control. Theoretical limits of circulation have been considered; and they are summarized in Chapter IV and (1 ,f). It is believed that the maximum (average across the span) circulation obtainable corresponds to

CL,„~ 1-9A (22)

Considering “powered” lift such as in the jet flap, the circulation component of lift (but not the jet-reaction force) may be expected to conform to this equation as discussed later in conjunction with figure 39.

V — TRAI LING-EDGE WING FLAPS

In conventional airplanes, landing flaps seldom cover the entire wing span as the wing tips have to be reserved for ailerons. As a consequence the performance of wings with flaps is somewhat different form that given for two di­mensional sections in the first section of this chapter.

LIFT CHARACTERISTICS OF SPLIT FLAPS

Split flaps have been used for many years in fighter-type airplanes as a simple device for increasing their glide-path angle and reducing landing speed.

Flow Pattern. At higher angles of deflection me pattern past split flaps is very similar to that of plain flaps. As a consequence, lift as a function of flap angle as in figure 6, is similar to that as in figure 3; that is. above 6 & 25°. In a similar manner, the lift increments m figure 7, for constant angles of deflection, are almost as high as those in figure 4. Referring to the theoretical “analysis” in the first section of this chapter, equation 3 can be applied to interpolate lift increments using &/2 and siri(6/2). Fig­ure 7 reveals, however, that split flaps are somewhat superior to plain flaps. The straight upper side of the airfoil section evidently leads the flow right to the trailing edge, while past a plain flap the flow is exposed to interference (mixing) with the highly turbulent “dead” space. Another advantage of the split type might also be a more stable wake pattern; the separation points are clearly fixed.

Zap Flap. A linkage system is shown in figure 8, through which the split flap can be moved back when deflecting, or be deflected when moving its pivot point back. The advantages are a reduction of actuation forces and an increase of effective wing chord. The corresponding incre­ment of lift may be found in figure 9, as a function of the distance of translation. Assuming that it would be correct to say that in figure 7, the increment increases as (aCl ) ~ v/c7/c, it may also be stated that

(дСц) l/c77c0 (10)

However, as we will see below, the lift-curve slope in­creases also corresponding to the effective chord length (c + лх). A more basic formulation, therefore, is necessary.
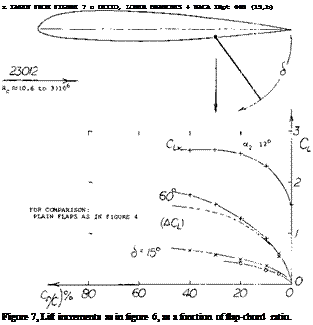
Подпись: x TAKEN FROM FIGURE 7 о DITTO, LOWER BRANCHES + NACA TRpt 668 (15,b) Figure 7, Lift increments as in figure 6, as a function of flap-chord ratio.

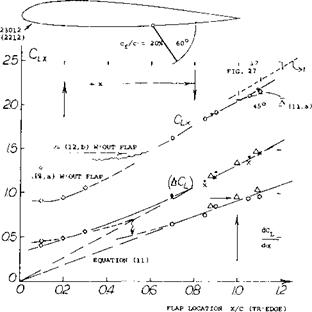
Split Flap Forward. As shown later, the nose-down pitch­ing moments due to trailing-edge wing flaps are large. To reduce them and possibly to make it practical to use split flaps as glide brakes it has been tried to locate such flaps more forward. In figure 9, lift characteristics are shown of a split flap for various flap positions “x” along the lower side of a rectangular wing. Considering the most “stable” range, say at at around 8°, extrapolation of the straight – line lift coefficients to CL = zero, leads to an approxi­mately common angle of attack. For the 20% flap, this angle corresponds to л оt ъ -15 , as measured against that for the plain foil section. Such common angles are also found in (12,b) for flap angles different from 60 and for chord ratios other than 20%.

(9) Investigation of perforated (brake) flaps:

a) Purser, Split Flaps on 23012 Wing, NACA W Rpt L-445 (1941).

b) Purser, Brake Flaps 33% Perforated, NACA W Rpt L-415 (1943).

Lift-Curve Slope. It may be argued that when moving the flap’s hinge point forward, the effective airfoil chord corresponds n( irly to that indicated by the trailing edge of the flap when folded, since the flow is fully separated from the lower side of the wing, with the flap deflected. In two-dimensional flow, thus approximately:

dCL/dof — (с + 4x) ^ (1 + (дх/с)) (11)

where x as defined in figure 9. After subtracting for the results as in (12), A(dof /dCL) = 3.5 for induced and affiliated considerations, two-dimensional lift angles doc /dCL are obtained. As shown in the illustration, the corresponding lift-curve slopes vary approximately as in equation 11. For example, for the angle of attack (in two-dimensional flow) where the lift of the plain foil section is zero, theoretical (dCL ) values are obtained for the flap arrangements in figure 9. Plotted together with values directly evaluated from 12, a variation essentially in proportion to that in equation 11 is found.

Full Scale Airplane. A systematic series of almost full-span split flaps is reported in (12,b). This investigation has the advantages that it has been conducted on a real airplane (in the NACA’s Full-Scale Wind Tunnel). We have cor­rected the results to full-span condition, using the part – span functions presented later and have reduced these results to two-dimensional conditions as explained above. For a 20% and 60° flap, the extapolated zero-lift angle is found to be displaced by Aot = —11° , and -15° respec­tively that is, after correcting for the flap cutout in the center of the parasol-type wing. Corresponding values for other flap chords and other deflection angles vary ap­proximately in proportion to the statistical functions as in figure 6 and 7, respectively. The lift-curve slopes vary in proportion to that in figure 9, or as indicated by equation 11.

(10) Characteristics of simple split flaps:

a) Goett; 0009,12,18 Wings in Full-Scale Tunnel, NACA TRpt 647 (1939).

b) Wenzinger, 23012,21,30 Wings With Various Flaps, NACA TRpt 668 (1939).

c) Fullmer, On 66-216 and 65-212 Foil Sections, NACA W Rpt L-140 (1944).

d) West, Presentation of the Characteristics, J. RAS 1940 p 338.

e) Williams, Wings in the Compressed Air Tunnel, ARC RM 1717 (1936).

f) Schrenk (AVA), Split Flaps to = 120 , ZFM 1932 p 597.

g) Wenzinger, Tapered Wing with Split Flaps, NACA TN 505(1934).

о A = 6, RECTANGULAR, 6(10)5 (12, a) / ^ • DITTO, DIRECTLY EVALUATED

X DITTO, CALCULATED (SEE TEXT)

Д PARASOL AIRPLANE AT 3(10)6 (12,b) П + DITTO, MAXIMUM LIFT IN FS TUNNEL О WALLS, 60° PERFORATED FLAPS (’ft, a ) <7

LIFT CHARACTERISTICS OF SPLIT FLAPS

Figure 9. Lift coefficients of rectangular wings with A = 6, tested with 20% split flaps in various chordwise positions.

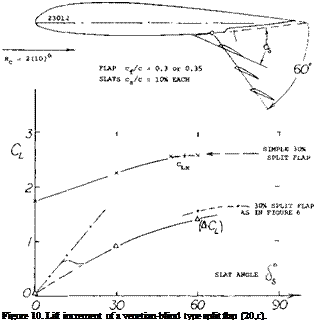
Perforated Flaps. A discontinuity in the (aCl) function is found in figure 6, at 6 between 20 and 30е5. It is suggested that below this range, a “simple” viscous wake is formed behind the split flaps tested, while above S & 25 , a Karman-type vortex street is established. This ex­planation is confirmied by a corresponding discontinuity in the section-drag coefficient, showing a step-up ACD5 # 0.01, which is ACD = 0.1 based on “base” area of the flap. The change in flow pattern is also confirmed by a step in the maximum lift coefficient as found in (16,a) for several split flaps, at some angle 6 between 15 and 30°. This step is in the order of лСих = —0.1. An up and down swinging wake can induce lift and drag fluctuations in the wing; and it can cause serious vibrations in the horizontal tail of an airplane. Figure 10 shows one of many “venetian-blind” type split flaps investigated in (20,c). Around 6s = 15°, the flow can be expected to separate from the slats. Another way of breaking up the wake into smaller vortices, is by means of perforated flaps. Characteristics of such flaps (plates) are reported in (9). Lift due to flap must be expected to reduce as a function of the solidity ratio S./Sf. For example, when removing 1/3 of the solid flap surface, flap load (normal force) and effectiveness (ziCL) are reduced roughly to 2/3.

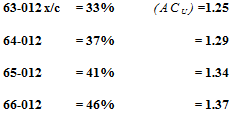
Airfoil-Section Shape. Split flaps can easily be attached to wind-tunnel models. This was evidently the inducement for testing routinely (13) various airfoil sections with a standardized 20% and 60° split flap. Such tests are con­sidered to indicate the forebody response to trailing-edge flaps in general, corresponding to thickness ratio and other shape parameters. Evaluation of (13,a) shows that camber between 0 and 4% of the chord has practically no influence on the increment (aQ_ ). One of the parameters describing shape is the location of maximum thickness. The due-to-flap increment increases as this location “x” is moved back along the chord. Thus as tested at Rc = 6(10) (with roughness strips added near the leading edge):

20%, 60° SPLIT FLAPS

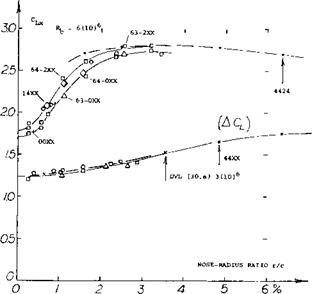
It is seen in figure 12, that when plotted against r/c, certain families of airfoil sections show approximately the sameACL, lift-due-to-flap values. The increment (ACl) increases from 1.25 for sharp-edged sections, to a possible maximum of 1.8 at radius ratios above r/c = 6%. Since the nose radius increases in proportion to the square of the section thickness, it can be argued that according to theory (see Chapter II ) that the lift-curve increases with the thickness ratio. For the maximum represented in the graph (t/c = 24%) the increment would be some 19%. The desirable effect of the high leading edge radius illustrates the importance of protecting the leading edge from sepa­ration so that high values of CLx can be obtained both with and without flaps. This is further discussed in the next chapter on leading edge devices.
Подпись: 63-012 x/c = 33% (ACU) =1.25 64-012 = 37% = 1.29 65-012 = 41% = 1.34 66-012 = 46% = 1.37

Подпись:

The nose radius of a certain foil section is indicated by r/t = К t/c

where К = 1.1 for NACA 4-Digit sections, or К = 0.76 for the 63 Series, decreasing to 0.70 for the 65 Series. The radius thus varies as

r/c = К (t/c/ (13)

(11) Discussion and characteristics of Zap flaps:

a) Weick, Split Flap Moved to Rear, NACA TN 422 (1932).

b) Joyce, Discussion of Zap Flaps, Trans ASME 1934 p 193.

c) Serby, Balancing of Flaps, Aircraft Engineering 1937 p 292.

d) Dearborn, Fairchild Airplane with Zap Flap, NACA TN 596 (1937).

e) Jones, Full-Scale Flight Tests, ARC RM 1741 (1936).

0 Practical Discussion, “Flight” Supplement 27 July and 31 Aug 1933.

(12) Characteristics of split flaps moved forward:

a) Wenzinger, 23012 Wings With Split Flaps, NACA TN 661 (1938).

b) Wallace, Fairchild Airplane With Split Flaps in Full-Scale Tunnel, also flap loads and downwash, NACA TN or TRpt 539 (1935).

c) The Schrenk flap (15,f) is also investigated in the CAT, ARC RM 1636.

(13) Influence of airfoil shape on flap effectiveness:

a) Abbott-vonDoenhoff-Stivers, Airfoil Data, NACA TRpt 824 (1945).

b) DVL, Collection of Berlin Airfoil Data, ZWB FB 1621 (1943).

c) Loftin, Modified 4-Digit Sections, NACA TN 1591 (1948).

d) Loftin, 15 Airfoil Sections, NACA TN 1945 (1949).

e) Loftin, 6A-Series Airfoil Sections, NACA TRpt 903 (1948).

(14) The flow pattern of slotted flaps:

a) Hoerner, Wing Flaps, Fieseler Water Tunnel Rpt 11

(1939) .

b) Petrikat, Landing Flaps, Fieseler Water Tunnel Rpt 19

(1940) .

LIFT CHARACTERISTICS OF SPLIT FLAPS

Figure 11. Lift increment in two-dimensional flow due to standard 20% and 60 split flap, as function of the nose-radius ratio.

Подпись: Trailing-Wedge Angle. The family of airfoil sections re-ported on in (13,b) shows variations of the nose radius without changing other parameters such as thickness and afterbody shape in (13,a). The results obtained for these variations do not correlate on the basis as in figure 11. Besides the thickness ratio, the trailing-wedge angle, see Chapters II and IX, seems to be the most important parameters. Consider a split flap deflected from the low'er side, by a certain constant angle such as 60 , the location of its trailing edge in relation to that of the airfoil, evidently changes as a function of the wedge angle. The edge of the flap moves down as the angle is increased; and its effective chord length may also be considered to be increased. In comparison with a very thin section, the 4424 airfoil included in figure 11, thus has a 27% longer effective flap chord. Based on figure 7, the lift increment might then be expected to be some 13% higher. We have used the section thickness at 80% of the chord as a measure for the trailing-wedge angle. As shown in figure 12, the lift increment due to the standard 20% and 60 split flap increases with the wedge angle, roughly from 1.2 to 1.6 and higher, depending on Reynolds number and wedge shape.
Подпись: 'Lx
LIFT CHARACTERISTICS OF SPLIT FLAPS

Figure 12. Lift increment in two-dimensional flow due to standard 20% and 60 split flap, as a function of the trailing-wedge angle (thickness ratio at 80% of the foil chord).

Plain Flaps. The influence of the trailing-wedge angle as for split flaps, does not necessarily hold for other types of flaps such as conventional plain flaps. Figure 13 presents the example of an aileron flap and a tab, attached to a 66-216 airfoil section. From what is said in Chapter IX on control devices it is clear that at small angles of deflection, the thin-edged flaps have greater effectiveness. Both the aileron and the tab show each some 25% higher (^Cu) values for the cusped section shape. Considering higher angles of deflection (tested to 25 only) where the flow is no longer attached to the back of the flap, the configura­tion as in figure 13, indicates increments higher by

17% for the aileron,

19% for the tab flap,

when using the concave shape. These variations are con­trary to those found for split flaps. There are two reasons to be considered. Plain flaps, with their hinge point lo­cated on section center line, do not grow effectively longer when deflected. Also, the geometrical angle of the flap at the lower side and near the trailing edge, is some­what larger for the cusped than for the straight-sided shape.
Подпись:

LIFT CHARACTERISTICS OF PLAIN FLAPS

Ordinary or plain flaps are similar in shape to control flaps, elevators and/or rudders as described in Chapter IX.

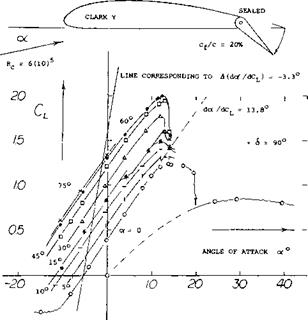
Lift Increment (aCl). Figure 2 presents the lift co­efficient of a flapped wing as a function of its angle of attack a as well as of the flap angle 6. The effect of the flap deflection is to displace the CL (o’ ) function by more or less a constant amount of ( a<x ). At constant lift coefficient, such ( aoC ) values can be considered to be independent of the wing aspect ratio. ‘The ratio (Aa1 /6) could thus be utilized to indicate the flap effectiveness. At the large deflection angles used during landing. Cu does not vary in linear proportion to the angle 6, however. A statistical evaluation is, therefore, needed. Using the angle-оf-attack displacement stated above, the lift due to flap deflection corresponds to aCu = daf (dCL/dot ), where the lift-curve slope (dCL/do( ) = 1 /(dot: /dCu) and the “lift angle” roughly:

Atf° /dCL * 10 + 20/A (6)

as discussed in Chapter III. To eliminate the second term (containing the aspect ratio A) that term is simply sub­tracted from the “lift angle” as tested. The result is a two-dimensional lift differential due to flap deflection, indicated by

(*CL) c* AcZ° /((doT° /dCL ) – (20/A)) (7)

A graphical procedure for the evaluation of this type of (ACi_) is indicated in figure 2,a. As discussed above, results from the modern “two-dimensional” closed wind – tunnel setups (2,c) have been “corrected” corresponding to A (dor’ /dCL ) = + 0.4°.

LIFT CHARACTERISTICS OF PLAIN FLAPS

LIFT CHARACTERISTICS OF PLAIN FLAPS

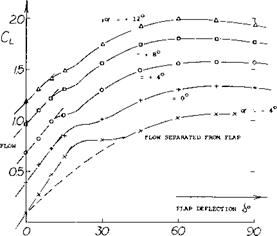
Figure. 2. Lift of a flapped rectangular model wing with A = 6, tested (10,a) in a closed wind tunnel:

Part a) as a function of the angle of attack of.

Part b) as a function of the flap angle 6.

(3) Summary and review of trailing-edge flaps:

a) Cahill; Data on Trailing-Edge Devices, with 58 references, with emphasis on slotted flaps; NACA TRpt 938 (1949).

b) Wenzinger, Summary as of 1939, SAE Journal 1939 p 161.

c) Serby, Review of Full-Scale Landing Flaps, ARC RM 1821 (1937).

d) Kruger, High Lift Devices, ZWB UM 3025 (1943) and Tech Berichte 1944 p 461.

e) See in Riegels, “Aerodynamische Profile”, Oldenbourg 1958.

f) Young, Characteristics of Flaps, ARC RM 2622 (1947), with 138 references (theory, flap types, pressure distribution, downwash, swept wings).

(4) NACA Investigation of Fairchild airplane in full-scale tunnel and in flight:

a) Dearborn, With Fowler Flaps, TN 578 (1936).

b) Dearborn, With Zap Flap and Ailerons, TN 596 (1937).

c) Reed, With External-Airfoil Flaps, TN 604 (1937).

d) Silverstein, Maximum Lift Without Flaps, NACA TRpt 618 (1938).

(5) Soule, Discussion of the Minimum Horizontal Tail Surface Required for Airplanes With Flaps; NACA TN 597 (1937).

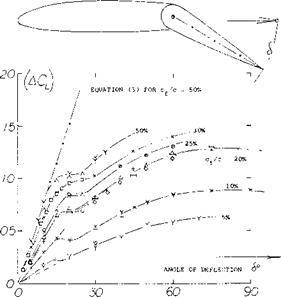
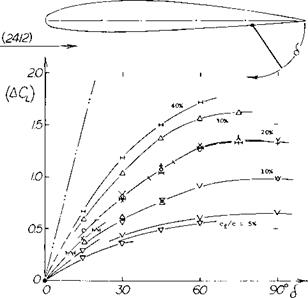
Flap Deflection. Values of (<dCL) are plotted in figure 3 as a function of the flap angle. As any plain-type flap is deflected from zero, its (aCl ) value increases first ac­cording to dot / S = f(cf /с). Between 6 := 10 and 20°

the flow will separate on the upper side of the airfoil. The actual flap angle for separation depends on the influence of Reynolds number, foil thickness ratio, flap-chord ratio, angle of attack “of ” and the size of the gap around the nose of the flap. After an interval in the order of 10°, the increment (ACl ) again increases, at a reduced and no longer linear rate, which is similar in character, to sin6. The increment (дСи) due to flaps usually reduces some­what as the angle of attack, or the basic lift coefficient is increased. We have generally evaluated flap effectiveness starting at oc =0, or at the angle of attack where the air­foil section used, see figure 2. At angles around 6 = 60°, the increment usually reaches a maximum. Any increase of the deflection angle above this limit, gives only a small increase of CL. For landing near CLX, for example a high angle of attack would becombined with a large flap angle. The increment (^CL ) will then be somewhat smaller than indicated in figure 3.

У

0009, Hor’tail,

50%,

6(10)5

(7, c)

v

0009, walls, 5 +

50%,

2(10)6

(7, d)

л

0009, walls, 25,

50%,

3(10)6

(7,e)

X

Cl-Y, A = 6, 10 +

30%,

6(10)5

(6, a)

64A010 wl’ 30%c

flap,

3(10)6

(7, f)

0

64A010, A = 3.1,

25%,

5(10)6

(23, e)

H

23012 bet’walls

20%,

3(10)6

(11,a)

Д

65-618, walls,

20%,

6(10)6

(9, a)

+

Clark Y, A = 6,

20%,

6(10)5

(6, a)

0

2412 with A= 5,

18%,

3(10)6

(6,b)

23012 bet’walls

10%,

2(lO)6

(11, b)

0009 with a 6%

tab,

2(10)6

(7,d)

— C. p

LIFT CHARACTERISTICS OF PLAIN FLAPS

Figure 3. Lift increments (ACL ) in two-dimensional flow, of plain flaps deflected from conventional foil sections, at F^eynolds num­bers between 6(10)b~ and 6(10)6.

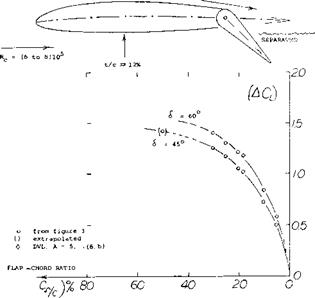
Flap-Chord Ratio. The effectiveness of plain flaps in­creases as a function of the cf /с ratio. As shown in figure 4, this increase is similar to

(4CL)~V^ (8)

Referred to the flap area indicated by the flap chord Cf effectiveness is highest in small chord ratios, and decreases rapidly as the ratio is increased. In the design of airplanes, chord ratios in the order of 20% for plain flaps have evidently been found to be most economical or practical, producing a comparatively large increment of lift with a limited structural penalty.

LIFT CHARACTERISTICS OF PLAIN FLAPS

Figure 4. Lift increments of plain flaps (as in figure 3) as a function of their flap-chord ratio.

(6) Wind-tunnel investigation of simple wing flaps:

a) Wenziner, Ordinary and Split Flaps on Various Wings Having A = 6, at Rc = 6(10) NACA TRpt 554 (1936).

b) Bausch-Doetsch, Rectangular 2412 Wing With Flap and Tab in DVL Open-Jet Wind Tunnel, Yearbk D Lufo 1940 p 1-182.

(7) Investigations of plain control flaps:

a) Dods, Nine Related Straight and Swept Horizontal Tails, NACA TN 3497 (1955).

b) Bryant, Evaluation of Control-Flap Characteristics for Small Deflections, with 19 references; ARC RM 2730 (1955).

c) Gothert, Two Series of Airfoils With Flaps and Tabs Tested to 6 = 40° in Open-Jet Tunnel, Yearbk D Lufo 1940 p 1-542.

d) NACA, 0009 Foil Section Between Walls With 30,50, 80% Flaps and With Tabs, TNotes 759, 734, 761 (1939/1940).

e) Spearman, 0009 Section with 25 and 50% Control Flaps, NACA TN 1517 (1948).

f) Crane, 66-216 Airfoil With Flap and Tab, NACA TRpt 803 (1944).

LIFT CHARACTERISTICS OF PLAIN FLAPS

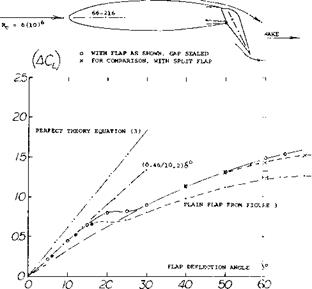
Figure 5. Lift increment of a plain flap (18,a) providing a well rounded shape when deflected.

Round Comer. With the larger radius made possible with the hinge located on the lower side as in figure 5, it would be expected that the flow would go further around the corner without separation than in a conventional plain flap, such as in figure 2 for example. Direct evidence for an improvement at deflections between 30 and 60 is not available. Two things can be seen however, in figure 5, the angle of incipient separation is raised from $ == 15 to 20°; and the lift increment (ACU ) keeps rising above b = 60°. Other factors contributing to the increase of lift over that of plain control-type flaps such as in figure 3, are:

a) the internal seal, preventing flow through the gap,

b) the thickness ratio t/c = 16%, in comparison to a 12%,

c) the 66-series section, in comparison to “old” shapes.

At any rate, the high effectiveness of the flap in figure 5 at larger angles of deflection is due to several factors as well as the greater radius.

(8) Influence of stream turbulence:

a) Abbott, 23012 Rectangular Wing With Plain and Split Flaps in the Variable-Density Tunnel, NACA TRpt 661

(1939) .

b) Morris, Flight Investigation Regarding the Effect of Vor­

tex Generators on Flap Effectiveness, NACA TN 3536 (1955). — 1

Stream Turbulence. The NACA’s Variable-Density Wind Tunnel is known to have a very turbulent stream of air, see Chapter IV. Results obtained for a 20% chord plain flap (8,a) are interesting in regard to the influence of turbulence upon the effectiveness of that type of flap. For <$=60 , the lift increment is:

(zlCL ) = 1.42 for the plain flap

= 1.27 for a same-size split flap

Comparison with the results in figure 3 shows that the lift is some 25% higher with plain flaps. The fact that the split flap does not exhibit an increased increment (see figure 6) proves that the phenomenon is not the result of tunnel interference. Thus, the conclusion is that stream turbu­lence helps the flow somewhat go around the bend of the plain flap. A reduction of turbulent separation, by way of “mixing” can also be produced by means of so-called turbulence generators small pieces of sheetmetal set at an angle of yaw on the upper side of wings, ahead of trailing – edge flaps. Flight tests (8,b) indicate the following:

a) Generators do not have a detectable effect at larger angles of flap deflection.

b) In climbing flight, with a flap angle of 19*, perform­ance is slightly improved.

H

23012,

WALLS,

20 +

40*,

3 <10)6

(10,b)

Д

23012,

WALLS,

10 +

30*,

3(10)6

(10,b)

Л

23012,

BET’WALLS,

20*,

3(10)6

(11 ,a)

+

23012,

WITH A

= 6,

20*,

8(10)6

(8, a)

X

23012,

WITH A

= 6,

20*,

6(10)5

(6, a)

65-212

, BET WALLS

20*,

6(10)6

(10 / c)

о

0012, ‘

WITH A

= 6,

20*,

3(10)6

(10,a)

V

23012,

WALLS,

5 &

10*,

3(10)6

(15«,b)

V

AVA GOTTINGEN,

5,10,204

1932

(-10, f)

LIFT CHARACTERISTICS OF PLAIN FLAPS

Figure 6. Lift increments (dC^) of split flaps deflected from conventional foil sections with t/c around 12%, at Reynolds num­bers between 6(10f and 6(10)6.

CHAPTER V – CHARACTERISTICS OF. TRAILING-EDGE WING FLAPS

Flaps deflected downward from the tailing edges of wings, are primarily used to increase lift so that the landing speed can be reduced. They may also be used to improve per­formance during takeoff and when climbing. Available information on high-lift flaps is essentially statistical in nature. It is attempted in the following, to present the trailing edge flap characteristics as a function of pertinent parameters and to find methods of evaluation, beginning with two-dimensional sections and ending with configura­tions as they are used in operational airplanes.

I. LIFT CHARACTERISTICS IN TWO-DIMENSIONAL FLOW

Wing flaps as used in airplanes, are three-dimensional devices, limited in span, usually interrupted by the fuse­lage and interfered with by nacelles and propeller slip­streams (if any). The two-dimensional flow characteristics of flaps are the basis, however, from which more com­plicated configurations can be understood.

1. GENERAL

The problems connected with the design and analysis of trailing-edge flaps, in two-dimensional flow, are as fol­lows:

• lack of, or complexity of theoretical methods,

• the amount of lift added by deflection of flaps,

• pitching moments affecting longitudinal trim,

• load distribution and hinge moments,

• stalling characteristics of flaps and airfoils,

• influence of Reynolds number on maximum lift,

• drag associated with the production of lift.

Analysis. The lift of thin airfoil sections correspond to CL = 2 tt sinor. Maximum lift is thus “expected” at ok = 90°, where practically all of that lift would be generated “at” the leading edge, by way of suction. The maximum lift coefficient would be in the order of CLX = 6. Deflection of a trailing-edge flap has two advantages: it reduces the need for higher angles of attack, and it gives the airfoil section “camber”, thus postponing flow separation from the upper side. Disregarding boundary-layer control (such as by suction) flow separation is evidently so strong at the larger angles of deflection needed that analytical efforts have been considered to be useless (l, e). However, with the use of high speed computation it is expected that methods will be developed to Find the performance of wings with flaps (2,g). Lift is generated in a wing, by deflecting a “tube” of the oncoming stream. To under­stand the mechanism of a trailing-edge flap, one may assume that the deflection corresponds to the direction into which the tail of the air foil section is pointing, or to which a not-too-small flap is deflected. Referring to Chap­ter IX, it may be said that (taking into account boundary layer effects) roughly:

dor /d6 =CJCLa = (cJcf ; 8<15° (1)

where n decreases from 0.7 at c^ /с = 0.1, to 0.6 at cf /с =

0. 3. This means that at a chord ratio c^/c = 0.2, for example, a deflection of the flap by 10f, produces almost the same lift increment as the airfoil or wing at an angle of attack of 5°. Equation 1 can only be used at small angles of flap deflection (say, up to 15°) as they may be used during takeoff and climbing of airplanes. Sub­stantially to increase the maximum lift of a wing, much larger flap angles are required. Replacing the deflection angle 6 by its sine, and dot /d6 by sinS, we tentatively obtain

A Cl, =2тґsin(or +8(d(sincY )/d(sin&))) (2)

For (X = 0, it may then be true that

(aCl ) := 2 тґ sin (6" (sinb/SXdor /d6)) (3)

Tentatively again, it is assumed that d(sinot )/d(sinS) = dot /d6 as plotted in figure 2 of Chapter IX. For example, for do( /d6 = 0.5, as for cf/с = 0.20 or 0.25, we thus obtain a maximum

(лСи )x* 0.9 (2 tr) Sin(0.5 0.64 90)* = 2.7

These equations produce a flat maximum at 5 = 90° which seems to be compatible with experimental results on flaps with boundary-layer control by suction. How­ever, flow separation (on plain and split flaps), boundary – layer and circulation losses (on slotted flaps) and in­creased or “super-circulation” (in particular when blowing over flaps) are bound to bring about negative or postive deviations from any simple theoretical formulation.

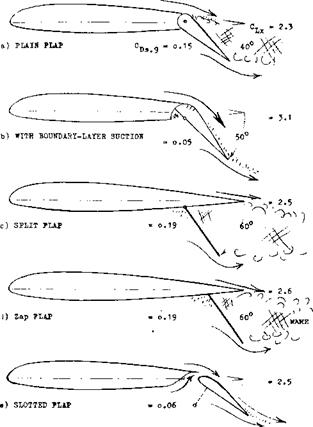
Types of Flaps. As illustrated in figure 1, a number of trailing-edge flaps have been developed, tested and used:

a) The ordinary or plain type (similar to control flaps) is rarely used as a landing flap. As mentioned above, the flow separates easily from the suction side. Maximum lift is not spectacular, drag is high because of separation and the wake is not necessarily stable.

b) Through the use of boundary layer control (suction) the separation from the plain flap can be eliminated. Characteristics would then be similar to those under (e).

c) The split flap was for many years used in the design of airplanes, particularly of fighters. This type is considered structurally simple. In terms of performance the lift is comparatively high and the drag connected with the “dead” space behind the flap, is evidently tolerable or even desirable during the landing operation.

d) The Zap flap (named after its inventor E. F. Zap) is a kinematic variation of the split type. Forces (moments) required for deflection are reduced, and maximum lift is increased (on account of an effective increase of wing chord).

e) The simple slotted flap (first or predominantly pro­moted by Handley Page) postpones separation to some 45° of deflection. Lift is increased, and drag is reduced.

f) The “external” flap (developed and used at one time by Junkers) can be considered to be a slotted flap, with a very long and flat entrance.

g) The supply of “fresh” air through a slot can be replaced and considerably increased by blowing over the deflected flap.

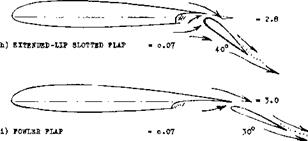
h) Shape of and flow through a slot are improved when extending the upper lip and translating the flap according­ly.

i) The Fowler flap (named after H. D. Fowler), combines the slotted feature as in (e) with an increase of the effective geometric airfoil chord; similar to (h).

j) The ultimate in variable geometry are double-, triple-, or multiple-slotted devices, combining and fully utilizing the characteristics as under (e) and (i).

All of these types of trailing-edge flaps (and some similar devices) are discussed in this chapter.

Experimental Results. Wind-tunnel tests are usually car­ried out between Rc = 4(10) and possibly 6(10) . For a landing speed, say of 120 knots, and an assumed wing chord of 10 ft, the Reynolds number is in the order of Rc = 10 . Realistic simulation of full-scale conditions in wind tunnels thus seems to be possible. However, because of the particularly high lift coefficients tested, tunnel cor­rections are comparatively large; and it seems that these corrections (developed for lift coefficients, say up to unity) are no longer sufficient. It is shown in Chapter II that pitching moments due to camber as tested in the NACA two-dimensional setup (between walls in a closed test section) are evidently out of line. Although the pro­cedure for correction lift-curve slope (2,b) includes a term corresponding to C™, it is suspected that this term is no longer adequate considering the extreme amounts of “camber” introduced by trailing-edge flap deflection. Another reason for the high lift increments observed in closed-type tunnels seems to be blockage by larger flap deflections and by the comparatively very large wakes (2,d) trailing from certain types of flaps. Corrected ex­perimental results obtained in open-jet wind tunnels, ex­hibit, on the other hand, comparatively smaller lift in­crements due to flaps. This is possibly because of the curved deflection of the tunnel stream. We have corrected (2,c) some of the data evaluated and presented in this chapter to levels believed to be realistic.

Forces and Moments. When using trailing-edge flaps (at modest angles of deflection) during takeoff and when climbing, their performance efficiency (in terms of D/L or L/D) is most important. We will see what can be accom­plished when using trailing-edge flaps for this purpose. — Loads due to flaps and on flaps are a justified concern of structural engineering. Pressure or load distributions, and the magnitude of the hinge moments due to deflection, will be presented. — Pitching moments due to flaps are a necessary evil connected with any successful type of trail­ing-edge flaps. It will be seen what their magnitude is, and how it can be reduced by three-dimensional “tailoring” of a wing.

CHAPTER V - CHARACTERISTICS OF. TRAILING-EDGE WING FLAPSFigure 1. Principal types of trailing-edge flaps, at an angle of deflection considered suitable in the landing operation of air­planes. The force and moment coefficients are estimated average values in two-dimensional flow, for 25% flap-chord ratio.

(1) Theoretical analysis of wing flaps:

a) Theoretical analysis applies primarily to small angles of deflection, and is as such treated in the “control-devices” chapter.

b) For some extension of analysis to higher angles of de­flection, see (13,b).

c) Walz, Pressure Distribution Including Wake, Ybk D Lufo 1940 p 1-265.

d) Walz, Analysis of CLma)( German ZWB FB 1769 (1943); Cornell Trans 1951.

e) Some results of (c) and (d) are shown by Reigels in “Aerodymanische Profile”, Oldenbourg Munich 1958. As­suming wake or dead space behind a sufficiently deflected flap to have a certain size and shape, it is possible (c) to “predict” pressure distribution, forces and moments using potential theory. Of course, these characteristics have to be known first from experiments, before the agreement as shown can be obtained.

f) Davenport, Limits of Circulation in Three-Dimensional Flow, J A’Space Sci 1960 p 959. Earlier work on the subject by Helmbold & McCormick is referenced.

g) Stevens Mathematical Model for 2D Multi-Component Airfoils NASA CR-1843.

(2) Подпись: Plgare 1 - continued. CDe>g - D'coefficient at o.9 Cj^ . CHAPTER V - CHARACTERISTICS OF. TRAILING-EDGE WING FLAPSCHAPTER V - CHARACTERISTICS OF. TRAILING-EDGE WING FLAPSCHAPTER V - CHARACTERISTICS OF. TRAILING-EDGE WING FLAPSCorrection of wind-tunnel results:

a) It is not the purpose of this text to investigate wind-tunnel techniques. There is some difference, however, in the lift – curve slopes as reported for the two-dimensional setup (be­tween walls) as in (13,a) and as derived from wings tested at A = 5 or 6 in open-jet tunnels such as in (13,b).

b) Procedures for correcting closed-tunnel results are re­ported in (13,a); see also Allen, Wall Inteference NACA TRpt 782 (1944).

c) As shown in Chapter II, the lift-curve slope depends upon parameters such as thickness ratio and skin friction (Rey­nolds number). Restricting ourselves to moderately thick and “conventional” airfoil sections, statistical experience seems to indicate that increments (ACU ) as tested in the NACA two-dimensional tunnels are too high (possibly by 4%), while those evaluated from the DVL open-jet tunnel are too low (possibly by 4%). Results in the various graphs of this chapter have been corrected accordingly.

d) Consider that the section-drag coefficient of an airfoil with 60 split flap is in the order of С^^ = 0.15, in comparison to less than 0.01 for the plain foil. As a consequence, blocking should have an effect upon lift due to flaps.

e) An example for blocking is NACA TN 3797 where an airfoil with 4.5 ft chord is tested between the walls of a closed tunnel which is 10 ft high, with a 30% plain flap deflected up to 70 . The increment for that angle is stated to be (дС|_) = 1.8, which is some 25% more than we would expect according to Figure 3.

STALLING OF STRAIGHT WINGS

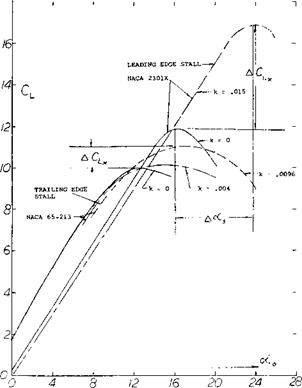
The stalling of a wing occurs when the more or less linear function of lift with angle of attack comes ultimately to an end. At this angle where the lift is no longer linear, the flow of the air separates from the suction side and the wing stalls. The stalling of a three dimensional wing is dependent on all the factors discussed in this chapter including the section shape, angle of attack, Reynolds number, Mach number and the planform shape. The stall­ing of the wing is dependent on the local angle of attack of the sections as effected by both geometrical and in­duced flow characteristics. Thus, the aspect ratio and shape of the planform are of primary importance. The stalling characteristics of low aspect ratio, delta, and swept wings are complex and, therefore, are covered in separate chapters.

Plan Form. As mentioned in Chapter III, the local lift coefficient of a rectangular wing is highest at the center; stalling, therefore, begins here. On the other hand, in a highly tapered wing, stalling is bound to start at and near the wing tips. Since it is desirable to have a wing display a gradual stall and maintain lateral control, a wing that stalls inboard first is desired. For this reason, reduction of wing-tip stalling is often attempted by twisting the wing so that the effective angle of attack is smaller at the tip than the root. This procedure (“washout”) is often sup­plemented by the use of slots, etc., see Chapter VIII.

STALLING OF STRAIGHT WINGS

Figure 38. Lift coefficient and angle of attack overshoot from static stall due to dynamic effects (32,d).

M0 = .23, Rc = 6.9(10)6 NACA 23016 ROOT NACA 23009 TIP A = 6

TAPER RATIO = 2:1 SMOOTH ‘

WASHOUT = 4°

TN – 1299

A typical flow pattern for a tapered wing showing the progression of stall with increasing angle is shown on figure 39. It will be noted that the aspect ratio 6 wing using NACA 23 xxx series airfoils (33,a) develops stall near the trailing edge, and that there is a cross flow from the wing tip. Also, after the maximum lift coefficient has been exceeded the wing tips are still not completely stalled. For the aspect ratio 10 wing with the same type of sections (33,b) stall proceeds in the same manner as the AR = 6 wing. The stall pattern shown would be expected since both wings are built with the tips washed out to obtain this pattern.

In both cases the wings with NACA 23 xxx section exhibited an abrupt stall even though the stall appears to start at the trailing edge. Sharp stall would not be pre­dicted from figure 8, but appears to be a characteristic of the 23 xxx airfoils and is seen in the two dimensional airfoil data (1 l, b). For wings using NACA 64 and the four digit series the stall is more gradual and of the type that would be predicted using figure 8. The prediction of these characteristics of plane wings is accurate using two – dimensional airfoil data for the proper operating condi­tion of Mach number and Reynolds number and the lifting line theory (30).

(33) Straight & Taper Wing Stall:

a) Mach and Reynolds No. Effects, NACA TN 1299.

b) High-Aspect-Ratio Tapered Wings, NACA TN 1677.

c) Compressibility Effects, NACA TN 1877.

d) Tapered Wings, NACA WR L-311.

(34) Influence of surface roughness on maximum lift:

a) Williams, Thick Sections in CAT, ARC RM 2457 (1951).

b) Hoerner, Survey, Ringbuc|t. vLufo Rpt IA9 (1937).

c) Jones, 0012 and RAF-34 in CAT, ARC RM 1708 (1936).

d) AVA Gottingen, Ergebnisse III*(1927) p 112.

e) Hooker, Airfoils w’Roughness, NACA TN 457 (1933). 0 See also references under (28).

(35) Characteristics of sharp-nosed sections:

a) Daley, 6% Thick Sections, NACA TN 3424 (1955).

b) DVL, Double-Arc Sections, see (8,c) or (19).

c) Solomon, Double Wedge, NACA RM A6G24.

d) Polhamus, Drag Due to Lift, NACA TN 3324 (1955).

DYNAMIC EFFECTS

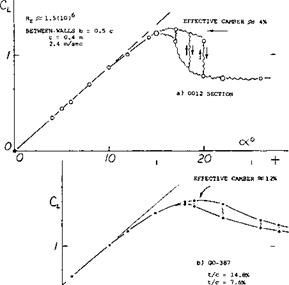
Fluctuations of Lift. Lifting characteristics as obtained from wind-tunnel tests, and in the form as presented in tunnel reports, are misleading insofar as the lift at and around CLX is sometimes not as steady as it appears. Speeds in air are so high, and the inertia and the damping of the wind-tunnel balances are large enough, so that a time-averaged values of lift and other forces and moments are recorded. A particular characteristic of fluid-dynamic testing in water (in a water tunnel or towing tank) is, on the other hand, the fact that the speeds required to obtain a certain Reynolds number are but a fraction (possibly a few percent) of those in wind tunnels. As a consequence, fluctuations of lift can “easily” be read from the balance. Lift as a function of the angle of attack from a water tunnel test at 2.4 m/sec = 6 ft/sec is plotted in figure 35 for two foil sections. Quoting from (31), the lift of the NACA 0012 section fluctuates “at” C^ , irregularly up and down as indicated in the illustration. The cambered and round-nosed section Go-387, displays similar (if less­er) fluctuations at angles of attack beyond CLX, over an extended range of that angle. The frequency “f” of these fluctuations as tested, is between 0.2 and 1.0 per second which, at a speed of 2.4 m/sec, leads to the non- dimensional value of

f c/V = between 0.03 and 0.16 (19)

DYNAMIC EFFECTS

_______ u_L___________ і_____________ і____

/ О 10 20

Figure 35. Lift as tested in a water tunnel (31) showing fluctua­tions in the vicinity of the maximum coefficient.

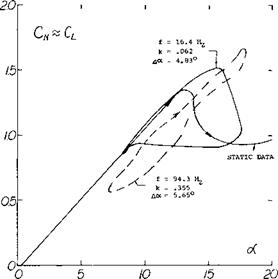
Dynamic Lift Stall. When a wing or a two-dimensional airfoil approaches the stall angle at a significant rate, such as might be encountered with a sudden pull-up of the airplane, the angle of attack for stall and the maximum lift coefficient are increased (32,a) as compared to the steady state flow case. When the dynamic change of angle of attack reverses the flow on the airfoil the lift does not revert to the value encountered at the lower angles, but will fall below these values. This results in lift coefficients below the values for the steady state case and causes a hysteresis loop as illustrated in figure 36. This tendency for a lift overshoot and a hysteresis loop is encountered in almost any dynamic situation of airfoils, and is especially important in the designs of helicopter, propeller and com­pressor blades as it may lead to stall flutter. Stall flutter of a blade can result in very high values of torsional stress as well as undesirable vibrations.

The dynamic lift overshoot is also important in the opera­tion of an aircraft, since a sudden pull-up can produce an effective sudden stall even if the wing is one which dis­plays a gentle type stall under steady state conditions. This may cause difficulties, especially under emergency conditions.

DYNAMIC EFFECTS

Figure 36. Frequency effect on hysteresis loop for oscillation airfoil (32,i).

(31) Investigation of foil sections in a water tunnel.

a) Hoerner, 0012 and Go-387, Fieseler W’Tunnel Rpt 3 (1939).

The dynamic lift overshoot is caused by a delay of the adverse pressure gradient, allowing the airfoil to support greater lift than during the steady state case. The oscillat­ing airfoil derives lift from the frequency induced normal velocity and the effects of the change in the rate of angle of attack (32,b). The frequency induced velocity normal to the airfoil effectively results in an increase in the section camber as ot increases and a corresponding de­crease as or is reduced. Thus, the rate of change of angle of attack, o’ , effectively increases and decreases the angle of attack compared to the static case. Since a certain amount of time is required for the boundary layer to build up, separation is delayed and the airfoil responds to the dynamic angle of attack change without stall, also contributing to the lift overshoot (32,c).

The combination of the q and the o’ effects influences the shape of the hysteresis loop which is a function of the reduced frequency defined by (32,d)

к = сш/V or = c lu/V0 (20)

where ш is the oscillation frequency, c is the mean aero­dynamic chord and c is the 2-dimensional chord length. The reduced frequency is thus a measure of the rate of change of oscillation with respect to the free stream velocity. The reduced frequency given in equation (20) is normally considered applicable only for incompressible flow cases. For the compressible flow case at Mach num­bers below the critical the reduced frequency will be

к = с ш/V0 >|T”— M (21)

where M is the free stream Mach number.

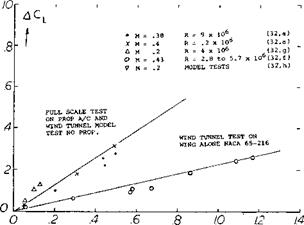
The maximum lift coefficient overshoot, ACLxd, due to the dynamic condition at which it occurs, iWxd, is a function of the section shape, Reynolds number, type of stall and the reduced frequency. Test data (32,f) indicates that for a given level of reduced frequency AC|_xd reduces with increasing camber and, although CLX under static conditions changes with Reynolds and Mach numbers, the lift overshoot is not effected. Under dynamic conditions, however, the level of turbulence increases with the re­duced frequency which could give higher values of LCLx6 than would beq>redicted by dynamic effects alone. This, along with the turbulence in the propeller slipstream may explain the large difference between the test data of (32,a) and (32,g), figure 37.

The basic shape of the dynamic lift curve through stall is dependent on the type of stall in the same way as airfoils operating at steady state conditions, figure (38). Thus, trailing edge stall will tend to yield a more rounded stall shape than leading edge stall. The reduced frequency and the type of motion effect the stalling, and it appears the stall becomes sharper as the frequency increases figure 38.

DYNAMIC EFFECTS

C/VQ — ^ DEGREES dt

Figure 37. Lift increase due to dynamic change of angle of attack.

The shape of the lift hysteresis curve, figure 36, depends on the airfoil shape, reduced frequency, the initial angle and angle of attack range of the test. If the initial angle of attack and change is below the static stall angle the hysteresis loop will be very small and on the static lift curve slope. However, if the initial angle and increment allow the static stall angle to be exceeded the loop can be large as shown on figure 36.

From figure 37 the lift overshoot can be estimated as a function of the pitch rate velocity and mean aerodynamic chord. The considerable scatter in the test data is caused by changes in section, turbulence and Reynolds number which influence the basic maximum lift of the section.

Although many experimental investigations of dynamic lift stall have been undertaken (32), it is desirable to have a means for predicting the angle overshoot and the shape of the hysteresis loop as a function of the instantaneous angle of attack from the available static airfoil data. An approximate method based on the concept of induced camber, attached flow phase lag and reduced frequency (32,d) appears to give a good first approximation.

(32) Dynamic Lift Stall:

a) Gadeberg, JB. L., Dynamic Aircraft Stall, NACA TN 2525.

b) Ericsson, L. E., J of Aircraft, Vol 4 No. 5, 1967.

c) Moore, F. K., Lift Hysteresis – Boundary Layer, NACA TN 1291.

d) Ericsson, L. E. & Reding, J. P., J. A/C, Vol 8 No. 8 & Vol 8 No. 7.

e) Halfman, R. L., Johnson, H. C. & Haley, S. M., NACA TN 2533.

f) Conner, F., Willey, C. and Twomey, W., NASA CR 321.

g) Davis and Sweberg, NACA TN 1639.

h) Harper, P., Rate Change on CLX, NACA TN 2061.

i) Liiva, Jaan, Unsteady Lift, J. Aircraft, Vol. 6, No. 1.

AIRFOIL CHARACTERISTICS ABOVE STALL

The characteristics of airfoils operating at angles of attack above stall are of importance in analyzing airplane off – design conditions and helicopter rotors operating at high forward speeds where reverse flow can be encountered. Normally airfoils operate in the range of angle of attack from near zero at zero CL to angles 10 to 20 degrees above that, and produce a maximum lift coefficient in the range of 1.0 to 1.6 plus. Upon increasing the angle of attack above CLX , The flow detaches (separates), more or less suddenly, from the suction or upper side of the airfoil. After reaching its maximum CL will drop to a value of 0.8 to 1.0 and then increases again as the angle of attack is further increased. This latter increase in lift is caused by a combination of the impact pressure on the lower surface together with some scavenging effect of the outer flow along the boundaries of the wake originating from the upper side. The scavenging results in a negative pressure differential, or suction, on the upper surface. Finally, the whole aggregate will result in some circula­tion. All this amounts to the fact that lift is derived from changes in momentum in the fluid flow, both in the direction of motion (drag) and in a direction normal to that motion.

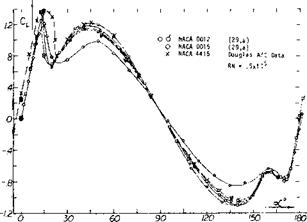
The two dimensional characteristics of airfoils in the angle of attack range of 0 to 180 degrees are given in figure 33 for NACA 0012, 0015 and 63A-012 airfoils (29,a, c). The results for all the 12% thick airfoils agree closely. Above an angle of 20 degrees indicating that shape has little effect on the lift variation at high angle. The results given in figure 33 also indicate that:

(a) After stalling, the resultant force acting on the airfoil section is essentially normal to the chord line.

(b) Lift reaches a second maximum at oc^45° with a value on the order of CL = 1.0.

(c) Together with the drag at 45° (corresponding to CD ~1.0) the normal force at that angle amounts to Сы ~ГГ~1А.

(d) At oc = 90° CN = CD ^1.8. The normal force thus reaches a maximum at this angle of attack, in a manner similar to the theoretical lift coefficient.

(e) Lift is approximately zero at 90°; and the drag co­efficient is 1.8, which is similar to that of a flat plate (CD ^ 1.95).

(0 At angles of attack between 90°and 180°, the sharp trailing edge becomes a leading edge, while the round leading edge has to perform as a trailing edge. The varia­tion of the drag and lift coefficients in this region is similar to that between 0 and 90 .

The two dimensional airfoil data presented on figure 33 was obtained primarily for use in helicopter rotor analysis. However, definition of the flow conditions required for correcting these data for their use in rotor analysis are not yet available. Testing of various airfoils on actual rotors is recommended (29) to account for all the variables, since the effects of three dimensional flow are of great impor­tance. Three dimensional flow due to leakage may ac­count for the difference between the NACA 0015 and 0012 airfoil data of figure 33.
AIRFOIL CHARACTERISTICS ABOVE STALL

Figure 33. Variation of lift coefficient for angles of attack 0 to 180 degrees.

Correlation of Theory*. Analysis of the experimental re­sults presented in figure 33 is as follows. First, multiply the theoretical lift function (30) given as equation (15) by cos or

CL =271′ sin oc (15)

to account for the loss of suction around the round leading edge of the section. We must next reduce the constant term 2тг, to account for the loss of circulation due to separation. The test lift coefficients are thus ap­proximately represented by

Cl = (1.8 to 2.0) sin oc cos <x (16) [50]

from the geometry, we also obtain

CD = (1.8 to 2.0) sin2 oc

(17)

СДІ = (1.8 to 2.0) sin oc

(18)

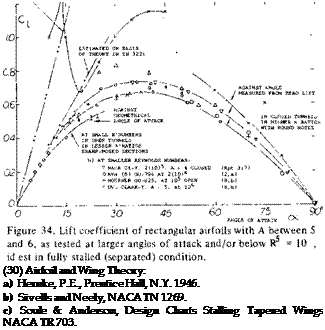
Fully Stalled Wings. In the range of small Reynolds num­bers (roughly below Rc= 10*) the boundary layer flow past rounded section noses stays completely laminar; sepa­ration follows at zero angle of attack from a theoretically traceable point on the upper side of the section, the location of which is independent of the Reynolds number, but dependent upon the angle of attack. As a conse­quence, the flow completely separates from the suction side and the lift is mainly due to the pressure forces on the lower side. This type of lift also reaches a maximum as the angle of attack is sufficiently increased; and the maxi­mum lift coefficient is essentially independent of Rey­nolds number.

Experimental points representing fully stalled (separated) conditions are plotted in figure 34. The maximum lift coefficient is between 0.6 and 0.7, at an angle of attack (for airfoils with A = 5 or 6) in the vicinity of 40°. It seems that the influence of Reynolds number in the range below 105 to above 10is small in this range of fully stalled flow. At angles of attack below 60°, the highest values tested belong to cambered and round-nosed sec­tions, while the lowest values are formed at negative angles of attack (simulating negative camber). Also, the stalled values of lift coefficients measured in closed wind tunnels are somewhat higher, and lower in open-jet-type tunnels.

a) AT HIGHER REYNOLDS NUMBERS:

О 00-420 (18.7/4.5)% AVA 4(10) , A = 5 (17,a)

r AVA, A = 5 FLAT PLATE 4(10)5 (17,a)

A DITTO, 10% CAMBERED PLATE, OPEN TUNNEL(I7,a)

7 NACA Cl-Y, A = 6 CLOSED 6(10)5 (TN-443/451)

Г DVL SY»*ffiTRICAL 3(10)6, A = 5 (8,b)

* DVL Cl-Y, 3U0)6, A = 5, OPEN (8,b)

A = 6 USUAL Д VDT, GO-398 ( /4.9)% CLOSED (TN 397,412.’

Подпись: (30) Airfoil and Wing Theory: a) Hernke, P.E., Prentice Hall, N.Y. 1946. b) Sivells and Neely, NACA TN 1269. c) Soule & Anderson, Design Charts Stalling Tapered Wings NACA TR 703. LIFT-CURVE SLOPE „ □ NACA USA-27, A = 6, CLOSED (TN 397,412)