In Section 3.14, the concept of vortex flow was introduced; refer to Figure 3.31 for a schematic of the flow induced by a point vortex of strength Г located at a given point О. (Recall that Figure 3.31, with its counterclockwise flow, corresponds to a negative value of Г. By convention, a positive Г induces a clockwise flow.) Let us now expand our concept of a point vortex. Referring to Figure 3.31, imagine a straight line perpendicular to the page, going through point O, and extending to infinity both out of and into the page. This line is a straight vortex filament of strength Г. A straight vortex filament is drawn in perspective in Figure 4.7. (Here, we show a clockwise
flow, which corresponds to a positive value of Г.) The flow induced in any plane perpendicular to the straight vortex filament by the filament itself is identical to that induced by a point vortex of strength Г; that is, in Figure 4.7, the flows in the planes perpendicular to the vortex filament at О and O’ are identical to each other and are identical to the flow induced by a point vortex of strength Г. Indeed, the point vortex described in Section 3.14 is simply a section of a straight vortex filament.
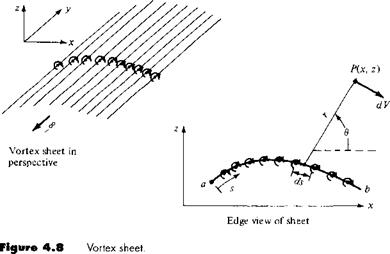
In Section 3.17, we introduced the concept of a source sheet, which is an infinite number of line sources side by side, with the strength of each line source being infinitesimally small. For vortex flow, consider an analogous situation. Imagine an infinite number of straight vortex filaments side by side, where the strength of each filament is infinitesimally small. These side-by-side vortex filaments form a vortex sheet, as shown in perspective in the upper left of Figure 4.8. If we look along the series of vortex filaments (looking along the у axis in Figure 4.8), the vortex sheet will appear as sketched at the lower right of Figure 4.8. Here, we are looking at an edge view of the sheet; the vortex filaments are all perpendicular to the page. Let і be the distance measured along the vortex sheet in the edge view. Define у = y(s) as the strength of the vortex sheet, per unit length along s. Thus, the strength of an infinitesimal portion ds of the sheet is у ds. This small section of the vortex sheet can be treated as a distinct vortex of strength у ds. Now consider point P in the flow,
|
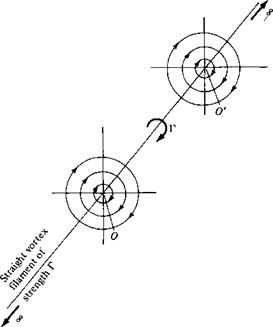
Figure 4.7 Vortex filament.
|
A
located a distance r from ds; the Cartesian coordinates of P are (x, z). The small section of the vortex sheet of strength у ds induces an infinitesimally small velocity dV at point P. From Equation (3.105), dV is given by
and is in a direction perpendicular to r, as shown in Figure 4.8. The velocity at P induced by the entire vortex sheet is the summation of Equation (4.1) from point a to point b. Note that dV, which is perpendicular to r, changes direction at point P as we sum from a to b; hence, the incremental velocities induced at P by different sections of the vortex sheet must be added vectorally. Because of this, it is sometimes more convenient to deal with the velocity potential. Again referring to Figure 4.8, the increment in velocity potential d<p induced at point P by the elemental vortex у ds is, from Equation (3.112),
In turn, the velocity potential at P due to the entire vortex sheet from a to b is
   [4.3] [4.3]
Equation (4.1) is particularly useful for our discussion of classical thin airfoil theory, whereas Equation (4.3) is important for the numerical vortex panel method.
Recall from Section 3.14 that the circulation Г around a point vortex is equal to the strength of the vortex. Similarly, the circulation around the vortex sheet in
Figure 4.8 is the sum of the strengths of the elemental vortices; that is

 [4.4] [4.4]
Recall that the source sheet introduced in Section 3.17 has a discontinuous change in the direction of the normal component of velocity across the sheet (from Figure 3.38, note that the normal component of velocity changes direction by 180° in crossing the sheet), whereas the tangential component of velocity is the same immediately above and below the source sheet. In contrast, for a vortex sheet, there is a discontinuous change in the tangential component of velocity across the sheet, whereas the normal component of velocity is preserved across the sheet. This change in tangential velocity across the vortex sheet is related to the strength of the sheet as follows. Consider a vortex sheet as sketched in Figure 4.9. Consider the rectangular dashed path enclosing a section of the sheet of length ds. The velocity components tangential to the top and bottom of this rectangular path are u and иг, respectively, and the velocity components tangential to the left and right sides are r j and i>2, respectively. The top and bottom of the path are separated by the distance dn. From the definition of circulation given by Equation (2.36), the circulation around the dashed path is
Г = — (v2 dn — uds — i>i dn + иг ds)
or Г = (иі — иг) ds + (i>i — иг) dn [4.5]
However, since the strength of the vortex sheet contained inside the dashed path is у ds, we also have
Г = у ds [4.6]
Therefore, from Equations (4.5) and (4.6),
у ds = (u — иг) ds + (uj — і>г) dn [4.7]
Let the top and bottom of the dashed line approach the vortex sheet; that is, let dn —»• 0. In the limit, и i and иг become the velocity components tangential to the
vortex sheet immediately above and below the sheet, respectively, and Equation (4.7) becomes
у ds = (u і — и 2 ) ds
Equation (4.8) is important; it states that the local jump in tangential velocity across the vortex sheet is equal to the local sheet strength.
We have now defined and discussed the properties of a vortex sheet. The concept of a vortex sheet is instrumental in the analysis of the low-speed characteristics of an airfoil. A philosophy of airfoil theory of inviscid, incompressible flow is as follows. Consider an airfoil of arbitrary shape and thickness in a freestream with velocity Vx, as sketched in Figure 4.10. Replace the airfoil surface with a vortex sheet of variable strength y(x), as also shown in Figure 4.10. Calculate the variation of у as a function of і such that the induced velocity field from the vortex sheet when added to the uniform velocity of magnitude Vж will make the vortex sheet (hence the airfoil surface) a streamline of the flow. In turn, the circulation around the airfoil will be given by
where the integral is taken around the complete surface of the airfoil. Finally, the resulting lift is given by the Kutta-Joukowski theorem:
L’ = Рос Too Г
This philosophy is not new. It was first espoused by Ludwig Prandtl and his colleagues at Gottingen, Germany, during the period 1912-1922. However, no general analytical solution for у = у (s) exists for an airfoil of arbitrary shape and thickness. Rather, the strength of the vortex sheet must be found numerically, and the practical implementation of the above philosophy had to wait until the 1960s with the advent of large digital computers. Today, the above philosophy is the foundation of the modern vortex panel method, to be discussed in Section 4.9.
The concept of replacing the airfoil surface in Figure 4.10 with a vortex sheet is more than just a mathematical device; it also has physical significance. In real life, there is a thin boundary layer on the surface, due to the action of friction between
  Airfoil of arbitrary shape and thickness Airfoil of arbitrary shape and thickness
Figure 4.10 Simulation of an arbitrary airfoil by distributing a vortex sheet over the airfoil surface.

|
Vortex sheet on camber line
|
|
|
|
|
|
|
|
|
|


the surface and the airflow (see Figure 1.35). This boundary layer is a highly viscous region in which the large velocity gradients produce substantial vorticity; that is, V x V is finite within the boundary layer. (Review Section 2.12 for a discussion of vorticity.) Hence, in real life, there is a distribution of vorticity along the airfoil surface due to viscous effects, and our philosophy of replacing the airfoil surface with a vortex sheet (such as in Figure 4.10) can be construed as a way of modeling this effect in an inviscid flow.3
Imagine that the airfoil in Figure 4.10 is made very thin. If you were to stand back and look at such a thin airfoil from a distance, the portions of the vortex sheet on the top and bottom surface of the airfoil would almost coincide. This gives rise to a method of approximating a thin airfoil by replacing it with a single vortex sheet distributed over the camber line of the airfoil, as sketched in Figure 4.11. The strength of this vortex sheet у (s) is calculated such that, in combination with the freestream, the camber line becomes a streamline of the flow. Although the approach shown in Figure 4.11 is approximate in comparison with the case shown in Figure 4.10, it has the advantage of yielding a closed-form analytical solution. This philosophy of thin airfoil theory was first developed by Max Munk, a colleague of Prandtl, in 1922 (see Reference 12). It is discussed in Sections 4.7 and 4.8.
Consider an individual molecule of a gas, say, an O2 molecule in air. This molecule is moving through space in a random fashion, occasionally colliding with a neighboring molecule. Because of its velocity through space, the molecule has translational kinetic energy. In addition, the molecule is made up of individual atoms which we can visualize as connected to each other along various axes; for example, we can visualize the O2 molecule as a “dumbbell” shape, with an О atom at each end of a connecting axis. In addition to its translational motion, such a molecule can execute a rotational motion in space; the kinetic energy of this rotation contributes to the net energy of the molecule. Also, the atoms of a given molecule can vibrate back and forth along and across the molecular axis, thus contributing a potential and kinetic energy of vibration to the molecule. Finally, the motion of the electrons around each of the nuclei of the molecule contributes an “electronic” energy to the molecule. Hence, the energy of a given molecule is the sum of its translational, rotational, vibrational, and electronic energies.
Now consider a finite volume of gas consisting of a large number of molecules. The sum of the energies of all the molecules in this volume is defined as the internal energy of the gas. The internal energy per unit mass of gas is defined as the specific internal energy, denoted by e. A related quantity is the specific enthalpy, denoted by h and defined as
h = e + pv [7.3]
For a perfect gas, both e and h are functions of temperature only:
e = e(T) [7.4a]
h=h(T) [7.4b]
Let de and dh represent differentials of e and h, respectively. Then, for a perfect gas,
de = cvdT [7.5a]
dh=cpdT [7.5b]
where cv and cp are the specific heats at constant volume and constant pressure, respectively. In Equations (7.5a and b), cv and cp can themselves be functions of T. However, for moderate temperatures (for air, for T < 1000 K), the specific heats are reasonably constant. A perfect gas where cv and cp are constants is defined as a calorically perfect gas, for which Equations (1.5a and b) becomes
 [7.6 a] [7.6b] [7.6 a] [7.6b]
For a large number of practical compressible flow problems, the temperatures are moderate; for this reason, in this book we always treat the gas as calorically perfect; that is, we assume that the specific heats are constant. For a discussion of compressible flow problems where the specific heats are not constant (such as the high-temperature chemically reacting flow over a high-speed atmospheric entry vehicle, that is, the space shuttle), see Reference 21.
Note that e and h in Equations (7.3) through (7.6) are thermodynamic state variables—they depend only on the state of the gas and are independent of any process. Although cv and cp appear in these equations, there is no restriction to just a constant volume or a constant pressure process. Rather, Equations (1.5a and b) and (1.6a and b) are relations for thermodynamic state variables, namely, e and h as functions of /’. and have nothing to do with the process that may be taking place.
For a specific gas, cp and cv are related through the equation
cp – cv = R [7.7]
Dividing Equation (7.7) by cp, we obtain
![Internal Energy and Enthalpy Подпись: [7.8]](/img/3128/image1048.gif) , cv R , cv R
Define у = cp/cv. For air at standard conditions, у = 1.4. Then Equation (7.8) becomes


Similarly, dividing Equation (7.7) by c„, we obtain
Equations (7.9) and (7.10) are particularly useful in our subsequent discussion of compressible flow.
Aerodynamics is full of quantities that have both magnitude and direction, such as force and velocity. These are vector quantities, and as such, the mathematics of aerodynamics is most conveniently expressed in vector notation. The purpose of this section is to set forth the basic relations we need from vector algebra and vector calculus. If you are familiar with vector analysis, this section will serve as a concise review. If you are not conversant with vector analysis, this section will help you establish some vector notation, and will serve as a skeleton from which you can fill in more information from the many existing texts on vector analysis (see, e. g., References 4 to 6).
2.2.1 Some Vector Algebra
Consider a vector quantity A; both its magnitude and direction are given by the arrow labeled A in Figure 2.2. The absolute magnitude of A is |A|, and is a scalar quantity. The unit vector n, defined by n = A/|A|, has a magnitude of unity and a direction equal to that of A. Let В represent another vector. The vector addition of A and В yields a third vector C,
![Review of Vector Relations Подпись: [2.1]](/img/3128/image155.gif) A + B = C A + B = C
which is formed by connecting the tail of A with the head of B, as shown in Figure 2.2. Now consider —B, which is equal in magnitude to B, but opposite in direction. The vector subtraction of В and A yields vector D,
![Review of Vector Relations Подпись: [2.2]](/img/3128/image156.gif) A – В = D A – В = D
|
|
|
|
|
|
|
|

Scalar product
|
|
|
|
|
|
 
Figure 2.2 Vector diagrams.
which is formed by connecting the tail of A with the head of —B, as shown in Figure 2.2.
There are two forms of vector multiplication. Consider two vectors A and В at an angle в to each other, as shown in Figure 2.2. The scalar product (dot product) of the two vectors A and В is defined as
A • В = IAI |B I cos0 [2.3]
= magnitude of A x magnitude of the component of В along the direction of A
Note that the scalar product of two vectors is a scalar. In contrast, the vector product (cross product) of the two vectors A and В is defined as
A x В = (|A||B| sin0)e = G [2.4]
where G is perpendicular to the plane of A and В and in a direction which obeys the “right-hand rule.” (Rotate A into B, as shown in Figure 2.2. Now curl the fingers of your right hand in the direction of the rotation. Your right thumb will be pointing in the direction of G.) In Equation (2.4), e is a unit vector in the direction of G, as also shown in Figure 2.2. Note that the vector product of two vectors is a vector.
In 1732, the Frenchman Henri Pitot was busy trying to measure the flow velocity of the Seine River in Paris. One of the instruments he used was his own invention—a strange-looking tube bent into an L shape, as shown in Figure 3.11. Pitot oriented one of the open ends of the tube so that it faced directly into the flow. In turn, he used the pressure inside this tube to measure the water flow velocity. This was the first time in history that a proper measurement of fluid velocity was made, and Pitot’s invention has carried through to the present day as the Pitot tube—one of the most common and frequently used instruments in any modern aerodynamic laboratory. Moreover, a Pitot tube is the most common device for measuring flight velocities of airplanes. The purpose of this section is to describe the basic principle of the Pitot tube.5
Consider a flow with pressure p moving with velocity V. as sketched at the left of Figure 3.11. Let us consider the significance of the pressure p more closely. In Section 1.4, the pressure is associated with the time rate of change of momentum of the gas molecules impacting on or crossing a surface; that is, pressure is clearly related to the motion of the molecules. This motion is very random, with molecules moving in all directions with various velocities. Now imagine that you hop on a fluid
5 See chapter 4 of Reference 2 for a detailed discussion of the history of the Pitot tube, how Pitot used it to overturn о basic theory in civil engineering, how it created some controversy in engineering, and how it finally found application in aeronautics.

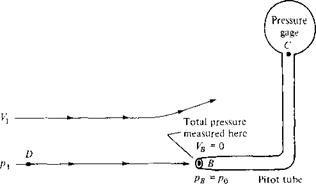
Static pressure A /measured here
yy>//777;77^ " 7^7777777^
Figure 3.1 1 Pitot tube and a static pressure orifice.
element of the flow and ride with it at the velocity V. The gas molecules, because of their random motion, will still bump into you, and you will feel the pressure p of the gas. We now give this pressure a specific name: the static pressure. Static pressure is a measure of the purely random motion of molecules in the gas; it is the pressure you feel when you ride along with the gas at the local flow velocity. All pressures used in this book so far have been static pressures; the pressure p appearing in all our previous equations has been the static pressure. In engineering, whenever a reference is made to “pressure” without further qualification, that pressure is always interpreted as the static pressure. Furthermore, consider a boundary of the flow, such as a wall, where a small hole is drilled perpendicular to the surface. The plane of the hole is parallel to the flow, as shown at point A in Figure 3.11. Because the flow moves over the opening, the pressure felt at point A is due only to the random motion of the molecules; that is, at point A, the static pressure is measured. Such a small hole in the surface is called a static pressure orifice, or a static pressure tap.
In contrast, consider that a Pitot tube is now inserted into the flow, with an open end facing directly into the flow. That is, the plane of the opening of the tube is perpendicular to the flow, as shown at point В in Figure 3.11. The other end of the Pitot tube is connected to a pressure gage, such as point C in Figure 3.11 (i. e., the Pitot tube is closed at point C). For the first few milliseconds after the Pitot tube is inserted into the flow, the gas will rush into the open end and will fill the tube. However, the tube is closed at point C; there is no place for the gas to go, and hence after a brief period of adjustment, the gas inside the tube will stagnate; that is, the gas velocity inside the tube will go to zero. Indeed, the gas will eventually pile up
and stagnate everywhere inside the tube, including at the open mouth at point B. As a result, the streamline of the flow that impinges directly at the open face of the tube (streamline DB in Figure 3.11) sees this face as an obstruction to the flow. The fluid elements along streamline DB slow down as they get closer to the Pitot tube and go to zero velocity right at point B. Any point in a flow where V = 0 is called a stagnation point of the flow; hence, point В at the open face of the Pitot tube is a stagnation point, where VB = 0. In turn, from Bernoulli’s equation we know the pressure increases as the velocity decreases. Hence, pB > p. The pressure at a stagnation point is called the stagnation pressure, or total pressure, denoted by po- Hence, at point В, рв = po-
From the above discussion, we see that two types of pressure can be defined for a given flow: static pressure, which is the pressure you feel by moving with the flow at its local velocity Vj, and total pressure, which is the pressure that the flow achieves when the velocity is reduced to zero. In aerodynamics, the distinction between total and static pressure is important; we have discussed this distinction at some length, and you should make yourself comfortable with the above paragraphs before proceeding further. (Further elaboration on the meaning and significance of total and static pressure will be made in Chapter 7.)
How is the Pitot tube used to measure flow velocity? To answer this question, first note that the total pressure po exerted by the flow at the tube inlet (point В) is impressed throughout the tube (there is no flow inside the tube; hence, the pressure everywhere inside the tube is po). Therefore, the pressure gage at point C reads Po – This measurement, in conjunction with a measurement of the static pressure p at point A, yields the difference between total and static pressure, po — Pi, and it is this pressure difference that allows the calculation of Vj via Bernoulli’s equation. In particular, apply Bernoulli’s equation between point A, where the pressure and velocity are p and V, respectively, and point B, where the pressure and velocity are po and V = 0, respectively:
Solving Equation (3.33) for Vj, we have
 [3.34] [3.34]
Equation (3.34) allows the calculation of velocity simply from the measured difference between total and static pressure. The total pressure po is obtained from the Pitot tube, and the static pressure p is obtained from a suitably placed static pressure tap.
It is possible to combine the measurement of both total and static pressure in one instrument, a Pitot-static probe, as sketched in Figure 3.12. A Pitot-static probe measures po at the nose of the probe and p at a suitably placed static pressure tap on the probe surface downstream of the nose.
In Equation (3.33), the term Vj2 is called the dynamic pressure and is denoted by the symbol q. The grouping pV2 is called the dynamic pressure by definition
|

Figure 3.12 Pitot-static probe.
|
|
and is used in all flows, incompressible to hypersonic:
q = pV2
However, for incompressible flow, the dynamic pressure has special meaning; it is precisely the difference between total and static pressure. Repeating Equation (3.33), we obtain
|
P +
|
pVi =
|
Po
|
|
static
|
dynamic
|
total
|
|
pressure
|
pressure
|
pressure
|
|
or
|
pi
|
+ q – po
|
|
[3.35]
It is important to keep in mind that Equation (3.35) comes from Bernoulli’s equation, and thus holds for incompressible flow only. For compressible flow, where Bernoulli’s equation is not valid, the pressure difference p0 — p is not equal to q. Moreover, Equation (3.34) is valid for incompressible flow only. The velocities of compressible flows, both subsonic and supersonic, can be measured by means of a Pitot tube, but the equations are different from Equation (3.34). (Velocity measurements in subsonic and supersonic compressible flows are discussed in Chapter 8.)
At this stage, it is important to repeat that Bernoulli’s equation holds for incompressible flow only, and therefore any result derived from Bernoulli’s equation also holds for incompressible flow only, such as Equations (3.26), (3.32), and (3.34). Experience has shown that some students when first introduced to aerodynamics seem to adopt Bernoulli’s equation as the gospel and tend to use it for all applications, including many cases where it is not valid. Hopefully, the repetitive warnings given above will squelch such tendencies.
 An airplane is flying at standard sea level. The measurement obtained from a Pitot tube mounted on the wing tip reads 2190 lb/ft2. What is the velocity of the airplane? An airplane is flying at standard sea level. The measurement obtained from a Pitot tube mounted on the wing tip reads 2190 lb/ft2. What is the velocity of the airplane?
Solution
Standard sea level pressure is 2116 lb/ft2. From Equation (3.34), we have
  2(po-Pi) = /2(2190 — 21167 p V 0.002377 2(po-Pi) = /2(2190 — 21167 p V 0.002377
In the wind-tunnel flow described in Example 3.4, a small Pitot tube is mounted in the flow just upstream of the model. Calculate the pressure measured by the Pitot tube for the same flow conditions as in Example 3.4.
 Solution Solution
From Equation (3.35),
Po — Poo “Ь Чоо — Poo “h 2 Poo
= 2116+ 4(0.002377)(328.4)2
 = 2116+ 128.2 = = 2116+ 128.2 =
Note in this example that the dynamic pressure is ^Дх> = 128.2 lb/ft2. This is only 8 percent larger than the pressure difference (p — /+), calculated in Example 3.4, that is required to produce the test-section velocity in the wind tunnel. Why is (pi — po) so close to the test-section dynamic pressure? Answer: Because the velocity in the settling chamber Vi is so small that p is close to the total pressure of the flow. Indeed, from Equation (3.22),
v’ = J[Vl = (їг) (328’4) = 213 ft/s
Compared to the test-section velocity of 328.4 ft/s, V is seen to be small. In regions of a flow where the velocity is finite but small, the local static pressure is close to the total pressure. (Indeed, in the limiting case of a fluid with zero velocity, the local static pressure is the same as the total pressure; here, the concepts of static pressure and total pressure are redundant. For example, consider the air in the room around you. Assuming the air is motionless, and assuming standard sea level conditions, the pressure is 2116 lb/ft2, namely, 1 atm. Is this pressure a static pressure or a total pressure? Answer: It is both. By the definition of total pressure given in the present section, when the local flow velocity is itself zero, then the local static pressure and the local total pressure are exactly the same.)
|
Design Box
The configuration of the Pitot-static probe shown in Figure 3.12 is a schematic only. The design of an actual Pitot-static probe is an example of careful engineering, intended to provide as accurate an instrument as possible. Let us examine some of the overall features of Pitot-static probe design.
Above all, the probe should be a long, streamlined shape such that the surface pressure over a substantial portion of the probe is essentially equal to the free stream static pressure. Such a shape is given in Figure 3.13a. The head of the probe, the nose at which the total pressure is measured, is usually a smooth hemispherical shape in order to encourage smooth, streamlined flow downstream of the nose. The diameter of the tube is denoted by d. A number of static pressure taps are arrayed radially around the circumference of the tube at a station that should be from 8d to 16d downstream of the nose, and at least 16<з? ahead of the downstream support stem. The reason for
|
|
|
|
|
 |
|
Stagnation point Total pressure measured here
|
|
|
(«)
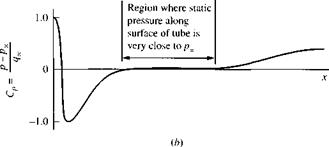
Figure 3.13 (a) Pitot-static tube, (b) Schematic of the pressure distribution along
the outer surface of the tube.
|
|
|
this is shown in Figure 3.13b, which gives the axial distribution of the pressure coefficient along the surface of the tube. From the definition of pressure coefficient given in Section 1.5, and from Bernoulli’s equation in the form of Equation (3.35), the pressure coefficient at a stagnation point for incompressible flow is given by
C, = = ^ = 1.0
с Цэc
Hence, in Figure 3.13b the Cp distribution starts out at the value of 1.0 at the nose, and rapidly drops as the flow expands around the nose. The pressure decreases below px, yielding a minimum value of Cp ~ —1.25 just downstream of the nose. Further downstream the pressure tries to recover and approaches a value nearly equal to px at some distance (typically about 8d) from the nose. There follows a region where the static pressure along the surface of the tube is very close to px, illustrated by the region where Cp = 0 in Figure 3.13b. This is the region where the static pressure taps should be located, because the surface pressure measured at these taps will be essentially equal to the freestream static pressure px. Further downstream, as the flow approaches the support stem, the pressure starts to increase above px. This starts at a distance of about 16d ahead of the support stem. In Figure 3.13a, the static pressure taps are shown at a station 14d downstream of the nose and 20d ahead of the support stem.
The design of the static pressure taps themselves is critical. The surface around the taps should be smooth to insure that the pressure sensed inside the tap is indeed the surface pressure along the tube. Examples of poor design as well as the proper design of the pressure taps are shown in Figure 3.14. In Figure 3.14a, the surface has a burr on the upstream side; the local flow will expand around this burr, causing the pressure sensed at point a inside the tap to be less than px. In 3.14 b, the surface has a burr on the downstream side; the local flow will be
|
|


|
|
|
slowed in this region, causing the pressure sensed at point b inside the tap to be greater than p^. The correct design is shown in Figure 3.14c; here, the opening of the tap is exactly flush with the surface, allowing the pressure sensed at point c inside the tap to be equal to p
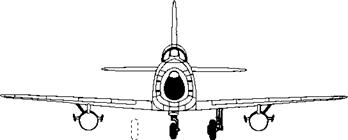
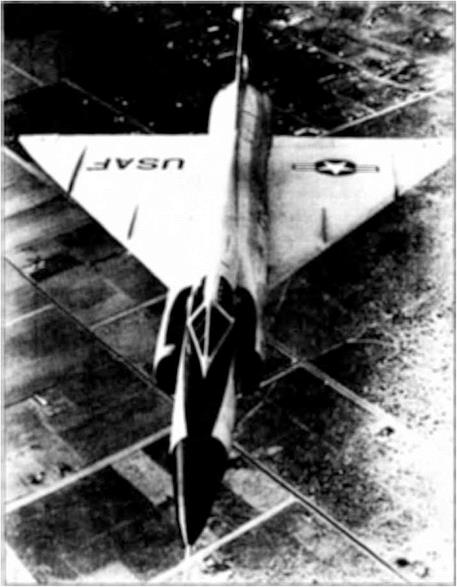
When a Pitot-static tube is used to measure the speed of an airplane, it should be located on the airplane in a position where it is essentially immersed in the freestream flow, away from any major influence of the local flow field around the airplane itself. An example of this can be seen in Figure 3.2, where a Pitot-static probe can be seen mounted near the right wing tip of the P-35, extending into the freestream ahead of the wing. A similar wing-mounted probe is shown in the planview (top view) of the North American F-86 in Figure 3.15.
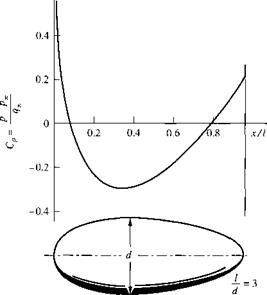
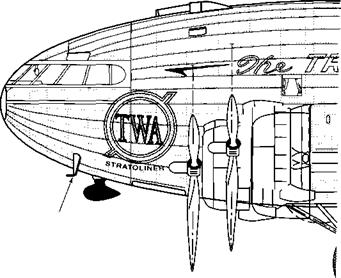
Today, many modem airplanes have a Pitot tube mounted at some location on the fuselage, and the measurement of poo is obtained independently from a properly placed static pressure tap somewhere else on the fuselage. Figure 3.16 illustrates a fuselage-mounted Pitot tube in the nose region of the Boeing Stratoliner, a 1940s vintage airliner. When only a Pitot measurement is required, the probe can be much shorter than a Pitot-static tube, as can be seen in Figure 3.16. In this type of arrangement, the location of the static pressure tap on the surface of the fuselage is critical; it must be located in a region where the surface pressure on the fuselage is equal to pa0. We have a pretty good idea where to locate the static pressure taps on a Pitot-static tube, as shown in Figure 3.13a. But the proper location on the fuselage of a given airplane must be found experimentally, and it is different for different airplanes. However, the basic idea is illustrated in Figure 3.17, which shows the measured pressure coefficient distribution over a streamlined body at zero angle of attack. There are two axial stations where Cp = 0 (i. e., where the surface pressure on the body equals p~,_). If this body were an airplane fuselage, the static pressure tap should be placed at one of these two locations. In practice, the forward location, near the nose, is usually chosen.
Finally, we must be aware that none of these instruments, no matter where they are located, are perfectly accurate. In particular, misalignment of the probe with respect to the freestream direction causes an error which must be assessed for each particular case. Fortunately, the measurement of the total pressure by means of a Pitot tube is relatively insensitive to misalignment. Pitot tubes with hemispherical noses, such as shown in Figure 3.13a, are insensitive to the mean flow direction up to a few degrees. Pitot tubes with flat faces, such as illustrated in Figure 3.12, are least sensitive. For these tubes, the total pressure measurement varies only 1 percent for misalignment as large as 20°. For more details on this matter, see Reference 65.
|
|
|
|
|
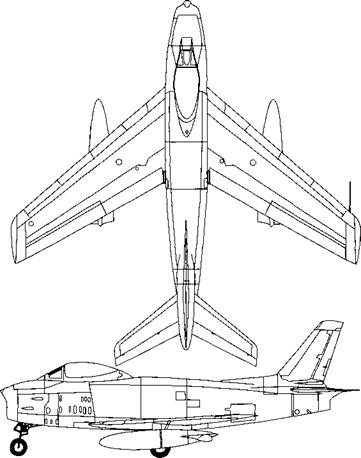
Figure 3.15 Three-view of the North American F-86H. Note the wing-mounted Pitot-static tube.
|
|
|
|
Figure 3.16 Nose-mounted Pitot tube on the Boeing Stratoliner. (Stratoliner detail
courtesy of Paul Matt, Alan and Drina Abel, and Aviation Heritage, Inc., with permission.)
|
|
|
Experimentally measured pressure coefficient distribution over a streamlined body with a fineness ratio (length-to-diameter ratio) of 3. Zero angle of attack. Low-speed flow.
|
|
|
|
In 1804, the first modem configuration aircraft was conceived and built by Sir George Cayley in England—it was an elementary hand-launched glider, about a meter in length, and with a kitelike shape for a wing as shown in Figure 4.44. (For the pivotal role played by George Cayley in the development of the airplane, see the extensive historical discussion in chapter 1 of Reference 2.) Note that right from the beginning of the modem configuration aircraft, the wing sections were very thin— whatever thickness was present, it was strictly for structural stiffness of the wing. Extremely thin airfoil sections were perpetuated by the work of Horatio Phillips in England. Phillips carried out the first serious wind-tunnel experiments in which the aerodynamic characteristics of a number of different airfoil shapes were measured. (See section 5.20 of Reference 2 for a presentation of the historical development of airfoils.) Some of Phillips airfoil sections are shown in Figure 4.45—note that they are the epitome of exceptionally thin airfoils. The early pioneers of aviation such as Otto Lilienthal in Germany and Samuel Pierpont Langley in America (see
|

Figure 4.44 The first modern configuration airplane in history: George Cayley’s model glider of 1804.
|
|
|
|
|
|
|
|
|
|
|
|
|
No. 5
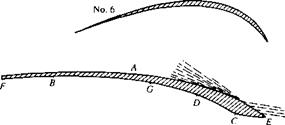
Figure 4.45 Double-surface airfoil sections by Horatio Phillips. The six upper shapes were patented by Phillips in 1 884; the lower airfoil was patented in 1891. Note the thin profile shapes.
|
|

chapter 1 of Reference 2) continued this thin airfoil tradition. This was especially true of the Wright brothers, who in the period of 1901-1902 tested hundreds of different wing sections and planform shapes in their wind tunnel in Dayton, Ohio (recall our discussion in Section 1.1 and the models shown in Figure 1.2). A sketch of some of the Wrights’ airfoil sections is given in Figure 4.46—for the most part, very thin sections. Indeed, such a thin airfoil section was used on the 1903 Wright Flyer, as can be readily seen in the side view of the Flyer shown in Figure 4.47. The important point here is that all of the early pioneering aircraft, and especially the Wright Flyer, incorporated very thin airfoil sections—airfoil sections that performed essentially like the flat plate results discussed in Section 4.12, and as shown in Figure 4.36 (the dashed curve) and by the streamline pictures in Figure 4.37. Conclusion: These early airfoil sections suffered flow-field separation at small angles of attack and, consequently, had low values of c; max. By the standards we apply today, these were simply very poor airfoil sections for the production of high lift.
-VZV77777,
|
Figure 4.46 Some typical airfoil shapes tested by the Wright brothers in their wind tunnel during 1902-1903.

|
|
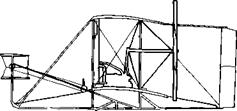
Figure 4.47 Front and side views of the 1903 Wright Flyer. Note the thin airfoil sections. ICourtesy of the National Air and Space Museum.)
|
This situation carried into the early part of World War I. In Figure 4.48, we see four airfoil sections that were employed on World War I aircraft. The top three sections had thickness ratios of about 4 to 5 percent and are representative of the type of sections used on all aircraft until 1917. For example, the SPAD XIII (shown in Figure 3.50),
|

RAF 14, British
|
|
|
|
|
Some examples of different airfoil shapes used on World War I aircraft, jSource: Loftin, Reference 48.)
|
|
|
|
  
the fastest of all World War I fighters, had a thin airfoil section like the Eiffel section shown in Figure 4.48. Why were such thin airfoil sections considered to be the best by most designers of World War I aircraft? The historical tradition described above might be part of the answer—a tradition that started with Cayley. Also, there was quite clearly a mistaken notion at that time that thick airfoils would produce high drag. Of course, today we know the opposite to be true; review our discussion of streamlined shapes in Section 1.11 for this fact. Laurence Loftin in Reference 48 surmises that the mistaken notion might have been fostered by early wind-tunnel tests. By the nature of the early wind tunnels in use—small sizes and very low speeds—the data were obtained at very low Reynolds numbers, less than 100,000 based on the airfoil-chord length. These Reynolds numbers are to be compared with typical values in the millions for actual airplane flight. Modem studies of low Reynolds number flows over conventional thick airfoils (e. g., see Reference 51) clearly show high-drag coefficients, in contrast to the lower values that occur for the high Reynolds number associated with the flight of full-scale aircraft. Also, the reason for the World War I airplane designer’s preference for thin airfoils might be as simple as the tendency to follow the example of the wings of birds, which are quite thin. In any event, the design of all English, French, and American World War I aircraft incorporated thin airfoils and, consequently, suffered from poor high-lift performance. The fundamentals of airfoil aerodynamics as we know them today (and as being presented in this book) were simply not sufficiently understood by the designers during World War I. In turn, they never appreciated what they were losing.
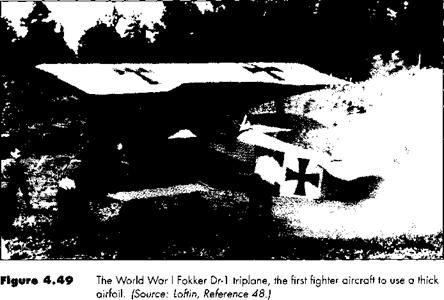
This situation changed dramatically in 1917. Work carried out in Germany at the famous Gottingen aerodynamic laboratory of Ludwig Prandtl (see Section 5.8 for a biographical sketch of Prandtl) demonstrated the superiority of a thick airfoil section, such as the Gottingen 298 section shown at the bottom of Figure 4.48. This revolutionary development was immediately picked up by the famous designer Anthony Fokker, who incorporated the 13-percent-thick Gottingen 298 profile in his new Fokker Dr-1—the famous triplane flown by the “Red Baron,” Rittmeister Manfred Freiher von Richthofen. A photograph of the Fokker Dr-1 is shown in Figure 4.49. The major benefits derived from Fokker’s use of the thick airfoil were:
1. The wing structure could be completely internal; that is the wings of the Dr – 1 were a cantilever design, which removed the need for the conventional wire bracing that was used in other aircraft. This, in turn, eliminated the high drag associated with these interwing wires, as discussed at the end of Section 1.11. For this reason, the Dr-1 had a zero-lift drag coefficient of 0.032, among the lowest of World War I airplanes. (By comparison the zero-lift drag coefficient of the French SPAD XIII was 0.037.)
2. The thick airfoil provided the Fokker Dr-1 with a high maximum lift coefficient. Its performance was analogous to the upper curves shown in Figure 4.36. This in turn, provided the Dr-1 with an exceptionally high rate-of-climb as well as enhanced maneuverability—characteristics that were dominant in dog-fighting combat.
Anthony Fokker continued the use of a thick airfoil in his design of the D-VII, as shown in Figure 4.50. This gave the D-VII a much greater rate-of-climb than its two principal opponents at the end of the war—the English Sopwith Camel and the
|
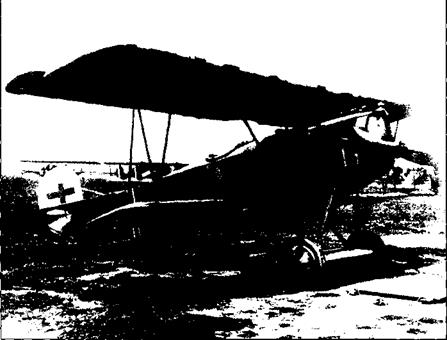
Figure 4.50 The World War I Fokker D-VII, one of the most effective fighters of the war, due in part to its superior aerodynamic performance allowed by a thick airfoil section.
|
French SPAD XIII, both of which still used very thin airfoil sections. This rate-of – climb performance, as well as its excellent handling characteristics, singled out the Fokker D-VII as the most effective of all German World War I fighters. The respect given by the Allies to this machine is no more clearly indicated than by a paragraph in article IV of the armistice agreement, which lists war material to be handed over to the Allies by Germany. In this article, the Fokker D-VII is specifically listed—the only airplane of any type to be explicitly mentioned in the armistice. To this author’s knowledge, this is the one and only time where a breakthrough in airfoil technology is essentially reflected in any major political document, though somewhat implicitly.
In this section, we elaborate upon the energy equation for adiabatic flow, as originally given by Equation (7.44). In Section 7.5, we obtained for a steady, adiabatic, inviscid flow the result that
where V and VA are velocities at any two points along a three-dimensional streamline. For the sake of consistency in our current discussion of one-dimensional flow, let us use и і and м2 in Equation (8.28):
2 2
MT ui, „
hi + – j – = h2 + у [8.39]
However, keep in mind that all the subsequent results in this section hold in general
along a streamline and are by no means limited to just one-dimensional flows.
Specializing Equation (8.29) to a calorically perfect gas, where h = cpT, we
have
From Equation (7.9), Equation (8.30) becomes
![Special Forms of the Energy Equation Подпись: [8.31]](/img/3128/image1126.gif) yRTi _ yRT2 и| y-l+2~y-l+2 yRTi _ yRT2 и| y-l+2~y-l+2
Since a = л/уТТГ, Equation (8.31) can be written as
If we consider point 2 in Equation (8.32) to be a stagnation point, where the stagnation speed of sound is denoted by ao, then, with u2 = 0, Equation (8.32) yields (dropping the subscript 1)
In Equation (8.33), a and и are the speed of sound and flow velocity, respectively, at any given point in the flow, and ao is the stagnation (or total) speed of sound associated with that same point. Equivalently, if we have any two points along a streamline, Equation (8.33) states that
Recalling the definition of a* given at the end of Section 7.5, let point 2 in Equation (8.32) represent sonic flow, where и = a*. Then
In Equation (8.35), a and и are the speed of sound and flow velocity, respectively, at any given point in the flow, and a* is a characteristic value associated with that same point. Equivalently, if we have any two points along a streamline, Equation (8.35) states that
Comparing the right-hand sides of Equations (8.34) and (8.36), the two properties a0 and a* associated with the flow are related by
V + 1 *2 flQ r ,
——— – a*2 = —5— = const Ї8.37І
2(y – 1) У – 1
Clearly, these defined quantities, a0 and a*, are both constants along a given streamline in a steady, adiabatic, inviscid flow. If all the streamlines emanate from the same uniform freestream conditions, then a(l and a* are constants throughout the entire flow field.
Recall the definition of total temperature To, as discussed in Section 7.5. In Equation (8.30), let u2 = 0; hence T2 = 70. Dropping the subscript 1, we have
Equation (8.38) provides a formula from which the defined total temperature TQ can be calculated from the given actual conditions of T and и at any given point in a general flow field. Equivalently, if we have any two points along a streamline in a steady, adiabatic, inviscid flow, Equation (8.38) states that
2 2
CPT + Y = cpT2 + Y = CpTo = const [8.39]
If all the streamlines emanate from the same uniform freestream, then Equation (8.39) holds throughout the entire flow, not just along a streamline.
For a calorically perfect gas, the ratio of total temperature to static temperature То/T is a function of Mach number only, as follows. From Equations (8.38) and
(7.9) , we have
To і і и2 1 i и2 1 | и2
7 = 1 + 2c~^T = 1 + lyRT/iy – О = 1 + 2a2/(у – 1)
  
= 1 +
Equation (8.40) is very important; it states that only M (and, of course, the value of y) dictates the ratio of total temperature to static temperature.
Recall the definition of total pressure po and total density p0, as discussed in Section 7.5. These definitions involve an isentropic compression of the flow to zero velocity. From Equation (7.32), we have

Combining Equations (8.40) and (8.41), we obtain
 [8.42] [8.42]
[8.43]
Similar to the case of Tq/T, we see from Equations (8.42) and (8.43) that the total – to-static ratios po/p and po/p are determined by M and у only. Hence, for a given gas (i. e., given y), the ratios T0/T, po/p, and po/p depend only on Mach number.
Equations (8.40), (8.42), and (8.43) are very important; they should be branded on your mind. They provide formulas from which the defined quantities 7b, po, and Po can be calculated from the actual conditions of M, T, p, and p at a given point in a general flow field (assuming a calorically perfect gas). They are so important that values of T0/T, p0/p, and po/p obtained from Equations (8.40), (8.42), and (8.43), respectively, are tabulated as functions of M in Appendix A for у = 1.4 (which corresponds to air at standard conditions).
Consider a point in a general flow where the velocity is exactly sonic (i. e., where M = 1). Denote the static temperature, pressure, and density at this sonic condition as T*, p*, and p*, respectively. Inserting M = 1 into Equations (8.40), (8.42), and
(8.43) , we obtain
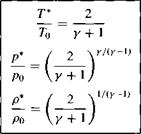 [8.44] [8.44]
[8.45]
[8.48]
For у = 1.4, these ratios are
|
у *
— = 0.833
|
p*
— = 0.528
|
P*
— = 0.634
|
|
To
|
Po
|
Po
|
which are useful numbers to keep in mind for subsequent discussions.
We have one final item of business in this section. In Chapter 1, we defined the Mach number as M = V/a (or, following the one-dimensional notation in this chapter, M = и/a). In turn, this allowed us to define several regimes of flow, among them being
M < 1 (subsonic flow)
M = 1 (sonic flow)
M > 1 (supersonic flow)
In the definition of M, a is the local speed of sound, a = л/yRT. In the theory of supersonic flow, it is sometimes convenient to introduce a “characteristic” Mach number M* defined as
 и и
a* where a* is the value of the speed of sound at sonic conditions, not the actual local value. This is the same a* introduced at the end of Section 7.5 and used in Equation
(8.35) . The value of a* is given by a* = *JyRT*. Let us now obtain a relation between the actual Mach number M and this defined characteristic Mach number M*. Dividing Equation (8.35) by u2, we have
(a/u)2 1 _ у + 1 / a*2
у – 1 2 “ 2(y – 1) V и )
(1/M)2 = y + 1 /J_2 _ 1
у – 1 2(y – 1) M*/ 2
 2 2 2 2
M2 = —————— Z————-
(у + 1 )/M*2 – (у – 1)
Equation (8.47) gives M as a function of M*. Solving Equation (8.47) for M*2, we have
which gives M* as a function of M. As can be shown by inserting numbers into Equation (8.48) (try some yourself),
|
M* = 1
|
if M = 1
|
|
M* < 1
|
if M < 1
|
|
M* > 1
|
if M > 1
|
|
Iy + 1
|
|
|
M* It———– r
|
if M —>■ oo
|
Therefore, M* acts qualitatively in the same fashion as M except that M* approaches a finite value when the actual Mach number approaches infinity.
In summary, a number of equations have been derived in this section, all of which stem in one fashion or another from the basic energy equation for steady, inviscid, adiabatic flow. Make certain that you understand these equations and become very
2 Foe
[1] Strictly speaking, dA can never achieve the limit of zero, because there would be no molecules at point В in that case. The above limit should be interpreted as dA approaching a very small value, near zero in
terms of our macroscopic thinking, but sufficiently larger than the average spacing between molecules on a microscopic basis.
[3] The specific heat of a fluid is defined as the amount of heat added to a system, Sq, per unit increase in temperature; cv = Sq/dT if Sq is added at constant volume, and similarly, for cp if Sq is added at constant pressure. Specific heats are discussed in detail in Section 7.2. The thermo! conductivity relates heat flux to temperature gradients in the fluid. For example, if qx is the heat transferred in the x direction per second per unit area and aT/ax is the temperature gradient in the x direction, then thermal conductivity к is defined by qx = —k(a = T/ax). Thermal conductivity is discussed in detail in Section 15.3.
[4] Some books do not use the minus sign in the definition of circulation. In such cases, the positive sense of both the line integral and Г is in the same direction. This causes no problem as long as the reader is aware of the convention used in a particular book or paper.
[5] An inviscid, incompressible fluid is sometimes called an ideal fluid, or perfect fluid. This terminology will not be used here because of the confusion it sometimes causes with "ideal gases" or "perfect gases" from thermodynamics. This author prefers to use the more precise descriptor "inviscid, incompressible flow," rother than ideal fluid or perfect fluid.
[6] For a simpler, more rudimentary derivation of Equation (3.21), see chapter 4 of Reference 2. In the present discussion, we have established a more rigorous derivation of Equation (3.21), consistent with the general integral form of the continuity equation.
The above example illustrates two aspects of such a flow, as follows:
[8] Consider a given point on the airfoil surface. The Cp is given at this point and, from the statement of the problem. Cp is obviously unchanged when the velocity is increased from 80 to 300 ft/s. Why? The answer underscores part of our discussion on dimensional analysis in Section 1.7, namely, Cp should depend only on the Mach number, Reynolds number, shape and orientation of the body, and location on the body. For the low-speed inviscid flow considered here, the Mach number and Reynolds number are not in the picture. For this type of flow, the variation of Cp is a function only of location on the surface of the body, and the body shape and orientation. Hence, Cp will not change with or p^ as long as the flow can be considered inviscid and incompressible. For such a flow, once the Cp distribution over the body has been determined by some means, the same Cp distribution will exist for all freestream values of and
[9] In part ib) of Example 3.8, the velocity at the point where Cp is a peak (negative) value is a large value, namely, 753 ft/s. Is Equation (3.38) valid for this case? The answer is essentially no. Equation (3.38) assumes incompressible flow. The
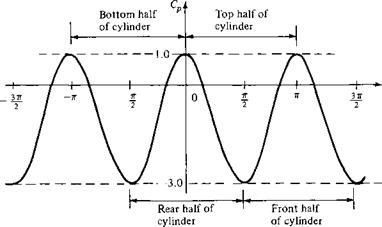
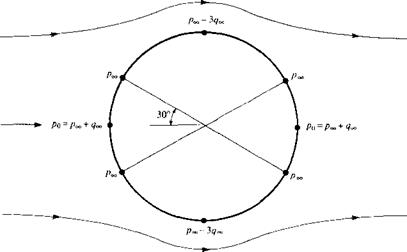
Consider the nonlifting flow over a circular cylinder. Calculate the locations on the surface of the cylinder where the surface pressure equals the freestream pressure.
Solution
When p = pco, then Cp = 0. From Equation (3.101),
Cp = 0 = 1 — 4 sin2 в
Hence, sin# =
Aerodynamics, The Science of Air in Motion, McGraw-Hill, New York, 1982.
[12] For more details, see the interesting discussion on forest aerodynamics in the book by John E. Allen entitled
[13] The design lift coefficient is the theoretical lift coefficient for the airfoil when the angle of attack is such that the slope of the mean camber line at the leading edge is parallel to the freestream velocity.
[14] In many references, such as Reference 1 1, if is common to plot versus С/, rather than versus a. A plot of versus Cj is called a drag polar. For the sake of consistency with Figure 4.5, we choose to plot versus a here.
[15] Kelvin’s theorem also holds for an inviscid compressible flow in the special case where p — p[p); that is, the density is some single-valued function of pressure. Such is the case for isentropic flow, to be treated in later chapters.
[16] fh!2
CDJ = -—- r(y)oCj(y)dy
vcoJ J-b/2
| |
![]()
 [3.92]
![]()


 [3.94]
![]()
![]() [3.95]
[3.95] [3.98]
![]()





 [2.137]


 [4.4]
[4.4]

 Airfoil of arbitrary shape and thickness


 [3.34]



 [8.42]
 [8.44]