Category HELICOPTER FLIGHT DYNAMICS

The general trim problem

Подпись: (4.23) (4.24) (4.25) (4.26) (4.27) (4.28)

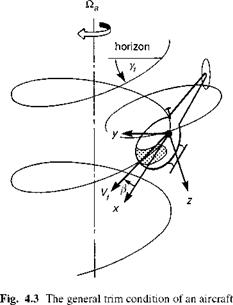
The elementary analysis outlined above illustrates the primary mechanisms of trim and provides some insight into the required pilot trim strategy, but is too crude to be of any real practical use. The most general trim condition resembles a spin mode illustrated in Fig. 4.3. The spin axis is always directed vertically in the trim, thus ensuring that the rates of change of the Euler angles 9 and ф are both zero, and hence the gravitational force components are constant. The aircraft can be climbing or descending and flying out of lateral balance with sideslip. The general condition requires that the rate of change of magnitude of the velocity vector is identically zero. Considering eqns 3.1-3.6 from Chapter 3, we see that the trim forms reduce to

where the reader is reminded that the subscript e refers to the equilibrium condition. For the case where the turn rate is zero, the applied aerodynamic loads, Xe, Ye and Ze, balance the gravitational force components and the applied moments Le, Me and Ne are zero. For a non-zero turn rate, the non-zero inertial forces and moments (centrifugal, Coriolis, gyroscopic) are included in the trim balance. For our first-order approximation, we assume that the applied forces and moments are functions of the translational velocities (u, v, w), the angular velocities (p, q, r) and the rotor controls ($0, в1s, $ic, $0T). The Euler angles are given by the relationship between the body axis angular rates and the rate of change of Euler angle Ф, the turn rate about the vertical axis, given in eqn 3A.42, i. e.,

Pe = -‘І/e sin &e (4.29)

Qe = Фe sin Фє cos ®e (4.30)

Re = vpe cos Фє cos &e (4.31)

The combination of 13 unknowns and 9 equations means that to define a unique solution, four of the variables may be viewed as arbitrary and must be prescribed. The prescription is itself somewhat arbitrary, although particular groupings have become more popular and convenient than others. We shall concern ourselves with the classic case where the four prescribed trim states are defined as in Fig. 4.3, i. e.,

Vfe

flight speed

Yfe

flight path angle

fae =

turn rate

Pe

sideslip

In Appendix 4C, the relationships between the prescribed trim conditions and the body axis aerodynamic velocities are derived. In particular, an expression for the track angle between the projection of the fuselage x-axis and the projection of the flight velocity
vector, both onto the horizontal plane, is given by the numerical solution of a nonlinear equation. Since the trim eqns 4.23-4.28 are nonlinear, and are usually solved iteratively, initial values of some of the unknown flight states need to be estimated before they are calculated. In the following sequence of calculations, initial values are estimated for the Euler pitch and roll angles 0e and Фє, the rotorspeed Q r, the main and tail rotor uniform downwash components Xo and Лот and the main rotor lateral flapping angle ви.

The solution of the trim problem can be found by using a number of different techniques, many of which are available as closed software packages, that find the minimum of a set of nonlinear equations within defined constraints. The sequential process outlined below and summarized in Fig. 4.4 is recognized as rather inefficient in view of the multiple iteration loops – one for pitch, one for roll, one for rotorspeed and one for each of the downwash components – but it does enable us to describe a sequence of partial trims, provides some physical insight into the trim process and can assist in identifying ‘trim locks’, or regions of the flight envelope where it becomes difficult or even impossible to find a trim solution. The process is expanded as a sequence in Fig. 4.5. The first stage is the computation of the aerodynamic velocities, enabling the fuselage forces and moments to be calculated, using the initial estimates of aerodynamic incidence angles. The three iteration loops can then be cycled.

Trim Analysis

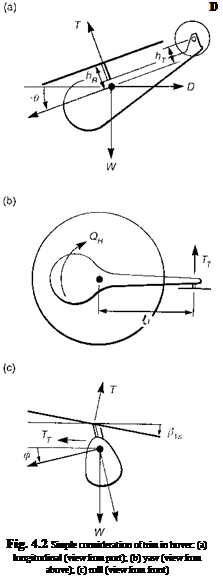
The simplest trim concept is portrayed in Figs 4.2(a)-(c). The helicopter, flying forward in straight trimmed flight, is assumed to consist of a main and tail rotor with a fuselage experiencing only a drag force. The rotor is assumed to be teetering in flap, with no moments transmitted through the hub to the fuselage, and the centre of mass lies on the shaft, below the rotor. Assuming the fuselage pitch and roll attitudes are small, the following elementary model of trim can be constructed.

The balance of forces in the vertical direction gives the thrust approximately equal to the weight

(4.18)

Подпись: (4.19)

This condition actually holds true up to moderate forward speeds for most helicopters. Balancing the forces along forward fuselage axis gives the approximate pitch angle as the ratio of drag to thrust

Since the thrust remains essentially constant in trimmed straight flight, the pitch angle follows the drag and varies as the square of forward speed. In our simple model, the absence of any aerodynamic pitching moment from the fuselage or tail requires that the hub moment is zero, or that the disc has zero longitudinal flapping.

From Fig. 4.2(b), the tail rotor thrust can be written as the main rotor torque divided by the tail arm

Qr

Tt (4.20)

lT

Подпись: ft* Подпись: hjTj ~HRT Подпись: (4.21)

The tail rotor thrust therefore has the same form as the main rotor torque, with the bucket at minimum main rotor power. In practice, the vertical fin is usually designed to produce a sideforce in forward flight, hence reducing the thrust required from the tail rotor. Figure 4.2(c) then shows the balance of rolling moment from the main and tail rotors, to give the lateral disc flapping

Thus, the disc tilts to port, for anticlockwise rotors, and the disc tilt varies as the tail rotor thrust.

The balance of sideforce gives the bank angle

Подпись:tt h _ %

Mag hR

If the tail rotor is located at the same height above the fuselage reference line as the main rotor, then the required bank angle is zero, for this simple helicopter design. In practice, the two terms in the numerator of eqn 4.22 are of the same order and the neglected in-plane lift forces have a significant influence on the resulting bank angle.

From the force and moment balance can be derived the required control angles – main/tail rotor collectives producing the required thrusts and the lateral cyclic from the lateral disc tilt.

Modelling helicopter flight dynamics: trim and stability analysis

Подпись: 4The challenge and responsibility of modern engineering practice demand a high level of creative activity which, in turn, requires the support of strong analytical capability. The primary focus should be on the engineering significance of physical quantities with the mathematical structure acting in a supporting role.

(Meriam 1966)

4.1 Introduction and Scope

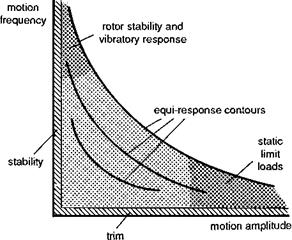
Meriam’s words of advice at the head of this chapter should act as a guiding light for engineers wishing to strengthen their skills in flight dynamics (Ref. 4.1). In Chapter 3 we sought to describe the physics and mathematics required for building a simulation model of helicopter flight behaviour. This chapter takes the products of this work and develops various forms of analysis to gain insight into how helicopters behave the way they do, hence establishing the engineering significance of the physics. Within the framework illustrated in our reference Fig. 4.1, the mechanics of helicopter flight can be described in terms of three aspects – trim, stability and response – as shown by the regions highlighted in the figure. The trim problem concerns the control positions required to hold the helicopter in equilibrium. The aircraft may be climbing, turning and may be at large angles of incidence and sideslip, but if the three translational velocity components are constant with the controls fixed, then the aircraft is in trim. Strictly, climbing and diving flight cannot be described as trim conditions, because the changing air density will require continual corrections to the controls. Provided the rates of climb or descent are relatively small, however, the helicopter will be, practically speaking, in trim. Stability is concerned with the behaviour of the aircraft following a disturbance from trim. Classically, static stability is determined by the initial tendency (i. e., will the aircraft tend to return to, or depart from, the initial trim?), while dynamic stability concerns longer term effects. These are useful physical concepts and will be embraced within the more general theory of the stability of the natural modes of motion, developed from the linear theory of flight mechanics. Response to pilot control inputs and to atmospheric disturbances are essentially nonlinear problems, but some insight can be gained from extending the linear approximations to finite amplitude motion. We shall return to response in Chapter 5. Trim, stability and response make up the flying characteristics. Later in Chapters 6 and 7, the reader will find that these flying characteristics are part of the domain of flying qualities. These later chapters will be concerned with how to quantify and measure flying quality, while here in Chapters 4 and 5 we are more interested in the physical mechanisms that generate the response.

Fig. 4.1 The territory of helicopter flight mechanics

Typical problems tackled by the flight dynamicist through mathematical mod­elling include

(1) determination of the control margins at the operational flight envelope (OFE) and safe flight envelope (SFE);

(2) design of flight control laws that confer Level 1 handling qualities throughout the OFE;

(3) simulation of the effects of tail rotor drive failure in forward flight – establish the pitch, roll and yaw excursions after 3 s;

(4) derivation of the sensitivity of roll attitude bandwidth to rotor flapping stiffness;

(5) establishing the tailplane size required to ensure natural pitch stability at high speed;

(6) determination of the effects of main rotor blade twist on power required for various missions;

(7) establishing the maximum take-off weight, hence payload, of a twin-engine heli­copter while conforming to the civil certification requirements for fly-away capa­bility following a single engine failure;

(8) assessment and comparison of various candidate aircraft’s ability to meet the flying qualities standard – ADS-33.

Of course, we could continue adding more tasks, but the range of problems has, hope­fully, been adequately demonstrated with the above list. Setting down this ‘short list’ of activities, some of which the author has been intimately involved with over the past 20 years, serves as a reminder of the importance of modelling in aircraft design and development – relying on experiment to tackle these problems would be prohibitively expensive. This is, of course, not to devalue or diminish the importance of flight testing.

Подпись: (4.1) (4.2)

Before we engage the supporting mathematics for describing the trim and stability problems, it may be useful for the reader to explore how all three are encapsulated in the relatively simple problem of heave motion in vertical flight. The key equations taken from Chapter 3 relate to the thrust coefficient Ct and uniform component of inflow Л0 through the rotor (eqns 3.91, 3.139):

This approximation of uniform rotor inflow is strictly applicable only when the blade twist has the ideal variation, inversely proportional to radius, giving constant circulation across the rotor and minimum induced drag. Linear blade washout of 10° or more generally gives a reasonably good approximation to the ideal loading.

Подпись: 0 3 R = 00 + 7 0tw = 3 4R 4 Подпись: 2CT 1 a0s 2 Подпись: (4.3)

In its simplest form, the trim problem amounts to determining the collective pitch 00 required to hold a hover, which is often written in terms of the equivalent pitch at the three-quarter radius, rather than at the rotor hub; i. e., from eqns 4.1 and 4.2, we can write

For moderate values of thrust coefficient (Ct — 0.007) and typical values of solidity (s = Nbc/пR ~ 0.09), the collective required to hover is approximately doubled by the presence of the induced velocity. The rotor torque required is then the sum of the induced and profile contributions (eqn 3.116)

C15

ce = cQi + cQp = ^Д + cQp (4.4)

showing the nonlinear relationship between torque and thrust in hover.

The trim problem is generally formulated as a set of nonlinear algebraic equations. In the case examined, the unique solution was obtained by simple rearrangement. In a more general trim, when the relevant equations are coupled, this will not be as straightforward and recourse to numerical solutions will be necessary.

Analysis of the dynamic stability and response problems requires the formulation of the equation of motion relating the normal acceleration to the applied thrust

Подпись: (4.5)Z _ T Ma =—M

Stability and response characteristics may be assessed (in the first approximation) by analysis of the linearized form of the nonlinear eqn 4.5. We write the normal velocity (w = Й Rhz in hover) as the sum of a trim or equilibrium value (subscript e) and a perturbation value

Подпись:w = We + &w


If we assume that the Z force acting on the helicopter in the hover is an analytic function of the control во and normal velocity w, together with their time rates of change, then the force can be expanded as a Taylor series about the trim value (Ref. 4.2), in the form

Подпись: (4.7)9 Z 9 Z 1 92 Z 2 9 Z

Z = Ze +– Sw +– 8во +— ~ w2 + ••• + Sw + ■

9w 9в0 0 2 9w2 9w

In the simple form of thrust equation given by eqn 4.5, there are no unsteady aerody­namic effects and hence there are no explicit acceleration derivatives. For small and slow changes in w (i. e., Sw) and во (i. e., Seo), the first two (linear) perturbation terms in eqn 4.7 will approximate the changes in the applied force, i. e.,

Подпись:Подпись: (4.8)9Z 9Z

Ze + — Sw +—————– Seo

e 9 w 9в0 0

The stability problem concerns the nature of the solution of the homogeneous equation

Подпись: (4.9)w — Zww = 0

Подпись: Zw Ma Подпись: (4.10)

where we have subsumed the aircraft mass Ma within the heave damping derivative Zw without any dressing, which is normal practice in helicopter flight dynamics, i. e.,

In eqn 4.9, we have used lowercase w for the perturbation in heave velocity away from the trim condition (cf. eqn 4.8 Sw ^ w, assumed small). This will be the general practice throughout this book, lowercase u, v and w, p, q and r denoting either total or perturbation velocities, depending upon the context. It is clear that the solution of eqn 4.9 will be stable if and only if Zw is strictly negative, as then the solution will be a simple exponential subsidence.

The heave damping derivative can be estimated from the derivative of thrust coefficient with rotor heave velocity

Подпись: (4.11)Подпись:9 Ct 1 / 9^0 2a0sk0

9^z 2 у 9^z J I6A0 + a0s

giving the result

Z 2a0 AbP(Q R)k0

(І6Л0 + a0s)Ma

which ensures stability. The damping derivative, or the heave eigenvalue (see Appendix 4B), typically has a value of between —0.25 and —0.4 (1/s) and, from eqn 4.12, is a linear function of lift curve slope, a0, and is inversely proportional to blade loading (Ma /Ab). The natural time constant of helicopter vertical motion in hover is therefore relatively large, falling between 4 and 2.5 s.

The response to small collective control inputs is governed by the inhomogeneous linear differential equation

where the thrust derivative

Подпись: (4.14)d Ct 8 / aosko

BOq 3 16ko + aos )

Подпись: Z0o Подпись: 8 aoAbp(QR)2ko 3 (16ko + aos)Ma Подпись: (4.15)

is used to determine the control derivative

Подпись: wss Подпись: R 00 Подпись: (4.16)

The ratio of the control derivative to the heave damping gives the steady-state response in heave velocity to a step change in collective pitch as

The rate sensitivity, or the steady-state rate per degree of collective, is seen to be a function of tip speed only. The rate of climb following a step input in collective is therefore independent of disc loading, lift curve slope, air density and solidity according to the simplifying assumptions of momentum theory. These assumptions, of which uniform inflow and constant lift curve slope are probably the most significant, were discussed at the beginning of Chapter 3.

The nature of the response to a vertical gust was described in some detail in Chapter 2, the equation of motion taking the form

W — Zww = Zwwg (t) (4.17)

The initial vertical acceleration is given by the product of the heave damping and the gust strength. A vertical gust of 5 m/s gives rise to a bump of about o.2 g for the higher levels of vertical damping. Reducing the blade loading has a powerful effect on the sensitivity to vertical gusts according to eqn 4.12, although overall, the helicopter is relatively insensitive to vertical gusts in the hover.

Helicopter vertical motion in hover is probably the simplest to analyse, but even here our simplifying approximations break down at higher frequencies and amplitudes, as unsteady aerodynamics, blade stall and rotor dynamic effects alter the details of the motion considerably. We shall return to this example later in Chapter 5. More general helicopter motions, in both hover and forward flight, tend to be coupled, and adequate single degree of freedom (DoF) descriptions are a rarity. As we progress through Chapters 4 and 5 however, the approach outlined above will form the pattern – that is, taking the basic nonlinear equations from Chapter 3 for trim and then linearizing for stability, control and small perturbation response analysis.

Chapter 4 is structured as follows. The techniques for describing and analysing trim and stability are set down in Sections 4.2 and 4.3 respectively. The expressions for the general trim problem will be derived, i. e., a turning, climbing/descending, sideslipping manoeuvre. Stability analysis requires linearization about a trim point and an examination of the eigenvalues and eigenvectors of the system. The key, 6 DoF, stability and control derivatives will be highlighted and their physical significance described. The natural modes of motion predicted from 6 DoF theory are also described. One of the major aids to physical interpretation of helicopter dynamic behaviour comes from the various approximations to the full equations of motion. Section 4.3 deals with

this topic, principally with linear, narrow range approximations that highlight how the various aerodynamic effects interact to shape the natural modes of helicopter motion. Working with modelling approximations is at the heart of a flight dynamics engineer’s practice, and we aim to give this area ample attention in both Chapters 4 and 5 to help the serious reader develop the required skills. The underlying mathematical methods used draw heavily on the theory of finite dimensional vector spaces, and Appendix 4A presents a summary of the key results required to gain maximum value from this chapter.

The theory of the stability of helicopter motion will be continued in Chapter 5, with special emphasis on constrained motion. The response problem is inherently nonlinear and typical behaviour will also be described in Chapter 5, with solutions from forward and inverse simulation. Discussion on some of the important differences between results using quasi-steady and higher order rotor models is also deferred until Chapter 5.

In order that some of the fundamental physical concepts of helicopter flight me­chanics can be discussed in terms of analytical expressions, it is necessary to make gross approximations regarding the rotor dynamic and aerodynamic behaviour. We include all the assumptions associated with Level 1 modelling as discussed at the be­ginning of Chapter 3, and then go further to assume a simple trapezoidal downwash field and ignore the in-plane lift loads in the calculation of rotor forces and moments. These latter effects can be important, but assuming that the lift forces are normal to the disc plane leads to a significant simplification in the trim and stability analyses. In most cases, this assumption leads to results that are 80% or more of the answer derived from considerably more complex rotor modelling and the resulting approximate theory can be used to gain the first-order insight into flight dynamics, which is particularly useful for the prediction of trends and in preliminary design.

We have already referred to Appendix 4A, containing the background theory of vector-matrix mechanics; two additional appendices complete the Chapter 4 series. Appendix Section 4B.1 presents the configuration datasets, including aerodynamic, structural, mass and geometric properties, for the three aircraft used in this book – the Lynx, Puma and Bo105. Appendix Section 4B.2 presents, in graphical form, the complete set of stability and control derivatives for the three aircraft predicted from two­sided numerical perturbations applied to the full Helisim nonlinear equations of motion. In the second edition of the book, a new Appendix Section 4B.3, presenting these derivatives and associated eigenvalues, is included. An analysis of the trim orientation problem is given in Appendix 4C.

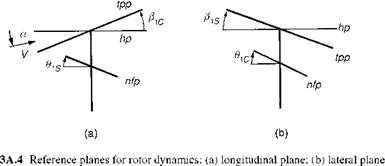
Rotor reference planes – hub, tip path and no-feathering

In rotor dynamics analysis, three natural reference axes systems have found application in various texts and reports – the hub (or shaft) system, the tip-path plane (or no­flapping) system and the no-feathering system. These are illustrated in Fig. 3A.4, where the hub plane has been drawn horizontal for convenience. In this book we consistently use the hub system but it is useful to compare expressions for key rotor quantities in the three systems. The motivation for adopting the rotor-oriented no-flapping or no­feathering systems is that they greatly simplify the expressions for the rotor X and Y forces, as shown in Ref. 3A.1 The no-feathering axes are equivalent to the, so-called, control axes when the rotor pitch/flap coupling is zero. The control axis is aligned along the swash plate.

Assuming small angles, the normalized velocities in the rotor systems are related to those in the hub system by the approximate relationships

Htp — Hh + Hzh p1 Hztp = Hzh – Hh p1

Fig.

and

pnf — ph №zh @1s

pznf — pzh + №h 8s (3A.58)

Similarly, the disc incidences are given by the expressions

atp — ah Pic

anf — ah + 6is (3A.59)

and the non-rotating rotor forces are given as

Xnf — Xh – T 9is

Xtp — Xh + T Pic (3A-60)

Ytp — Yh – TPis

Ynf — Yh – T9ic (3A.61)

where it is assumed that the rotor thrust T and Z forces in the three systems have the same magnitude and opposite directions.

In hover, the alignment of the tip-path plane and the no-feathering plane highlights the equivalence of flapping and feathering. These expressions are valid only for rotors with flap articulation at the centre of rotation. Elastic motion of hingeless rotors and flapping of articulated rotors with offset flap hinges cannot be described with these rotor axes systems. It should also be noted that the induced inflow discussed earlier in this chapter, X, is strictly referred to the tip-path plane, giving the inflow normal to the hub plane as

Xh — Xtp – p-Pic (3A.62)

This effect is taken into account in the derivation of the rotor torque given in this chapter (eqn 3.116), but not in the iterative calculation of X. The small flap angle approximation will give negligible errors for trim flight, but could be more significant during manoeuvres when the flapping angles are large.


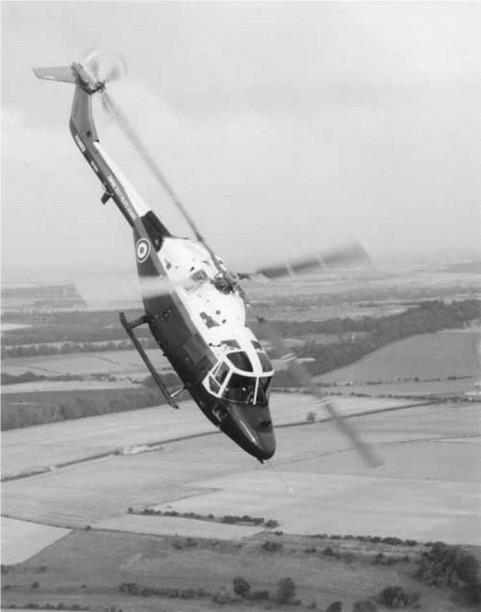
The Empire Test Pilot School’s Lynx in an agile pitch manoeuvre complementary to the cover picture (Photograph courtesy of DTEO Boscombe Down and the Controller HMSO)

Appendix 3A Frames of Reference and Coordinate Transformations

3A.1 The inertial motion of the aircraft

In this section we shall derive the equations of translational and rotational motion of a helicopter assumed to be a rigid body, referred to an axes system fixed at the centre of

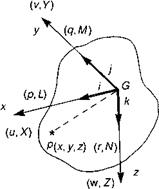
Fig. 3A.1 The fuselage-fixed reference axes system


mass of the aircraft (assumed to be fixed in the aircraft). The axes, illustrated in Fig. 3A.1, move with time-varying velocity components u, v, w and p, q, r, under the action of applied forces X, Y, Z and L, M, N.

The evolutionary equations of motion can be derived by equating the rates of change of the linear and angular momentum to the applied forces and moments. Assum­ing constant mass, the equations are conveniently constructed by selecting an arbitrary material point, P, inside the fuselage and by deriving the expression for the absolute acceleration of this point. The acceleration can then be integrated over the fuselage volume to derive the effective change in angular momentum and hence the total inertia force. A similar process leads to the angular acceleration and corresponding inertial moment. The centre of the moving axes is located at the helicopter’s centre of mass, G. As the helicopter translates and rotates, the axes therefore remain fixed to material points in the fuselage. This is an approximation since the flapping and lagging motion of the rotor cause its centre of mass to shift and wobble about some mean position, but we shall neglect this effect, the mass of the blades being typically <5% of the total mass of the helicopter. In Fig 3A.1, i, j, k are unit vectors along the x, y andz axes respectively.

We can derive the expression for the absolute acceleration of the material point P by summing together the acceleration of P relative to G and the acceleration of G relative to fixed earth. The process is initiated by considering the position vector of the point P relative to G, namely

r p/g = x i + yj + zk (3A.1)

The velocity can then be written as

v p/g = Г p/g = (x i + yj + zk) + (xi + yj + zk) (3A.2)

Since the reference axes system is moving, the unit vectors change direction and therefore have time derivatives; these can be derived by considering small changes in the angles 80, about each axis. Hence

Подпись: (3A.3)8i = j80z — k80y


Подпись: (3A.4)di d9z d0y

d =i = j dT – k IT =rj – q k

Defining the angular velocity vector as

Mg = pi + q j + r k (3A.5)

we note from eqn 3A.4 that the unit vector derivatives can be written as the vector product

Подпись: (3A.6)

Подпись: and

i = Mg л i

with similar forms about the j and k axes.

Since the fuselage is assumed to be rigid, the distance of the material point P from the centre of mass is fixed and the velocity of P relative to G can be written as

vp/g = Mg л rp (3A.7)

or in expanded form as

vp/g = (qz – ry)i + (rx – pz)j + (py – qx)k = Up/gi + Vp/gj + Wp/gk (3A.8)

Similarly, the acceleration of P relative to G can be written as

a p/g = v p/g = (up/gi + vp/gj + wp/gk) + (up/gi + vp/gj + wp/gkk)

= ap/grel + Mg л vp (3A.9)

or, in expanded form, as

ap/g = (up/g – rvp/g + qwp/g)i +(v p/g – pwp/g + rup/g)j

+ (wp/g – qup/g + pvp/g)k (3A.10)

Writing the inertial velocity (relative to fixed earth) of the aircraft centre of mass, G, in component form as

Vg = ui + vj + w k (3A.11)

we can write the velocity of P relative to the earth reference as

vp = (u – ry + qz)i + (v – pz + rx)j + (w – qx + py)k (3A.12)

Similarly, the acceleration of P takes the form

ap = aprel + Mg л Vp (3A.13)

or

with components

ax = u – rv + qw – x(q2 + r2) + y(pq – r) + z(pr + q) (3A.15)

ay = v – pw + ru – y(p2 + r2) + z(qr – p) + x(pq + r) (3A.16)

az = w – qu + pv – z(p2 + r2) + x(pr – q) + y(qr + p) (3A.17)

These are the components of acceleration of a point distance x, y, z from the centre of mass when the velocity components of the axes are given by u(t), v(t), w(t) and p(t), q(t), r(t).

We now assume that the sum of the external forces acting on the aircraft can be written in component form acting at the centre of mass, i. e.,

Fg = X i + Yj + Z k (3A.18)

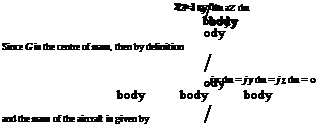
If the material point, P, consists of an element of mass dm, then the total inertia force acting on the fuselage is the sum of all elemental forces; the equations of motion thus take the component forms

Подпись: (3A.23)Ma = j dm

body

The translational equations of motion of the aircraft are therefore given by the relatively simple equations

X = Ma(u – rv + qw)

Y = Ma(v – pw + ru)

Z = Ma(w – qu + pv) (3A.24)

Thus, in addition to the linear acceleration of the centre of mass, the inertial loading is composed of the centrifugal terms when the aircraft is manoeuvring with rotational
motion. For the rotational motion itself, the external moment vector about the centre of mass can be written in the form

Подпись: (3A.25)
Mg = L i + Mj + N к

Considering the component of rolling motion about the fuselage x-axis, we have

Подпись: (3A.27)L = j (yaz — zay) dm

body

and substituting for ay and az we obtain

L = p (y2 + z2) dm —

qr / (z2 — y2) dm + (r2

— q2) 1 yz dm

J

body

J

body

J

body

— (pq + r) 1 xz dm + (pr — q) 1 xy dm

(3A.28)

body

body

Defining the moments and product (Ixz) of inertia as

x-axis:

hx = f (y2 + z2) dm

(3A.29)

J

body

y-axis:

Iyy = 1 (x2 + z2) dm

(3A.30)

J

body

z-axis :

hz = f (x2 + y2) dm

(3A.31)

J

body

xz

-axes: Ixz = 1 xz dm

(3A.32)

body

we note that the external moments can finally be equated to the inertial moments in the form

The product of inertia, Ixz, is retained because of the characteristic asymmetry of the fuselage shape in the xz plane, giving typical values of Ixz comparable to Ixx.

3A.2 The orientation problem – angular coordinates of the aircraft

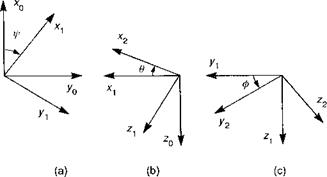
The helicopter fuselage can take up a new position by rotations about three independent directions. The new position is not unique, since the finite orientations are not vector quantities, and the rotation sequence is not permutable. The standard sequence used in flight dynamics is yaw, ф, pitch, 9, and roll, ф, as illustrated in Fig. 3A.2. We can consider the initial position as a quite general one and the fuselage is first rotated about the z-axis (unit vector k0) through the angle ф (yaw). The unit vectors in the rotated frame can be related to those in the original frame by the transformation Ф, i. e.,

i1

cosф

sinф

0

io "

j1

=

—sinф

cosф

0

jo

or {b} = W{a}

(3A.34)

k)_

0

0

1_

_ko_

Next, the fuselage is rotated about the new y-axis (unit vector j1) through the (pitch) angle 9, i. e.,

i2

cos 9

0

— sin 9

i1

j1

=

0

1

0

j1

or {c} = 0{b}

(3A.35)

k1

sin 9

0

cos 9

_ko_

Finally, the rotation is about the x-axis (roll), through the angle ф, i. e.,

i2

1

0

0

i2

j2

k2

=

0

0

cos ф — sin ф

sin ф

cos ф

1——–

1_____

or {d} = Ф{с}

(3A.36)

Any vector, d, in the new axes system can therefore be related to the components in the original system by the relationship

{d} = Ф0Ф {a} = Г {a} (3A.37)

Fig. 3A.2 The fuselage Euler angles: (a) yaw; (b) pitch; (c) roll

Since all the transformation matrices are themselves orthogonal, i. e.,

фт = ф-1 , etc. (3A.38)

the product is also orthogonal, hence

rT = Г-1 (3A.39)

where

cos 9 cos f

cos 9 sin f

— sin 9

sin ф sin 9 cos f—

sin ф sin 9 sin f+

sin ф cos 9

cos ф sin f

cos фcos f

(3A.40)

cos ф sin 9 cos f+

cos ф sin 9 sin f —

cos ф cos 9

sin ф sin f

sin ф cos f

Of particular interest is the relationship between the time rate of change of the orien­tation angles and the fuselage angular velocities in the body axes system, i. e.,

Mg = ph + qji + r k2

= f ko + 9ji + ф І2 (3A.41)

Using eqns 3A.34-3A.36, we can derive

p = ф — f sin 9 q = 9 cos ф + f sin ф cos 9

r = —9 sin ф + f cos ф cos 9 (3A.42)

3A.3 Components of gravitational acceleration along the aircraft axes

The relationships derived in Appendix Section 3A.2 are particularly important in flight dynamics as the gravitational components appear in the equations of motion in terms of the so-called Euler angles, 9, ф, f, while the aerodynamic forces are referenced directly to the fuselage angular motion. We assume for helicopter flight dynamics that the gravitational force always acts in the vertical sense and the components in the fuselage-fixed axes are therefore easily obtained with reference to the transforma­tion matrix given in eqn 3A.40. The gravitational acceleration components along the fuselage x, y and z axes can therefore be written in terms of the Euler roll and pitch angles as

axg = ~g sin 9 ayg = g cos 9 sin ф aZg = g cos 9 cos ф

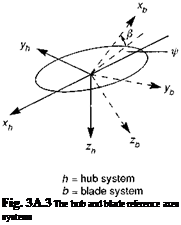
Подпись: Fig. 3A.3 The hub and blade reference axes systems

3A.4 The rotor system – kinematics of a blade element

The components of velocity and acceleration of a blade element relative to the air through which it is travelling, and the inertial axes system, are important for calculating the blade dynamics and loads. When the hub is fixed, the only accelerations experienced by a flapping blade are due to the centrifugal force and out-of-plane motion. When the hub is free to translate and rotate, then the velocities and accelerations of the hub contribute to the accelerations at a blade element. We begin with an analysis of the transformation between vectors in the non-rotating hub reference system and vectors in the blade axes system.

Figure 3A.3 illustrates the hub reference axes, with the x and y directions oriented parallel to the fuselage axes centred at the centre of mass. The z direction is directed downwards along the rotor shaft, which, in turn, is tilted forward relative to the fuselage z-axis by an angle ys. The blade referenced axes system has the positive x direction along the blade quarter chord line. The zero azimuth position is conventionally at the rear of the disc as shown in the figure, with the positive rotation anticlockwise when viewed from above, i. e., in the negative sense about the z-axis. Positive flapping is upwards. The positive y and z directions are such that the blade and hub systems align when the flapping is zero and the azimuth angle is 180°.

We shall derive the relationship between components in the rotating and non­rotating systems by considering the unit vectors. The orientation sequence is first azimuth, then flap. Translational and angular velocities and accelerations in the hub system can be related to the blade system by the transformation

ih

— cos ф

— sin ф

0

cos в

0

sin в

ib

jh

=

sin ф

— cos ф

0

0

1

0

jb

_ kh _

0

0

1

— sin в

0

cos в

_ kb _

(3A.44)

or, in expanded form

ih

— cos ф cos в

— sin ф

— cos ф sin в

ib

jh

=

sin ф cos в

— cos ф

sin ф sin в

jb

kh

— sin в

0

cos в

kb

The hub velocity components in the hub reference system are related to the velocities of the centre of mass, u, v and w through the transformation

uh

cos Ys

0

sin Ys

u — qhg

vh

0

1

0

v + phR + rxcg

(3A.46)

wh

_- sin Ys

0

cos Ys

_ w — qxcg

where ys is the forward tilt of the rotor shaft, and h r and xcg are the distances of the rotor hub relative to the aircraft centre of mass, along the negative z direction and forward x direction (fuselage reference axes) respectively.

It is more convenient, in the derivation of rotor kinematics and loads, to refer to a non-rotating hub axes system which is aligned with the resultant velocity in the plane of the rotor disc; we refer to this system as the hub-wind system, with subscript hw. The translational velocity vector of the hub can therefore be written with just two components, i. e.,

Подпись:Подпись: (3A.48)Подпись: (3A.49)vhw — uhw ihw + whw khw

The angular velocity of the hub takes the form

&hw — phw ihw + qhw jhw + rhw khw

The hub-wind velocities are given by the relationships

/ 2 2 1/2

uhw — uh cos фw + vh sin фw — [uh + vh)

vhw — 0

whw — wh

lul + v2

lul + v2

Подпись: 1 £ Ci, cos -ф'w sin фw p qhw — sin фw cos фw q

(3A.50)

We now write the angular velocity components transformed to the rotating system as

Подпись:(3A.53)

station rb, in the blade axes system, may be written as

ub = uhw cos f whw p

vb = – uhw sin f – rb (fi – rhw + P&x)

wb = – uhwв cos f + whw + rb {<j)y – p) (3A.54)

Similarly, the blade accelerations can be derived, but in this case the number of terms increases considerably. The dominant effects are due to the acceleration of the blade element relative to the hub, with the centrifugal and Coriolis inertia forces giving values typically greater than 500 g at the blade tip. Blade normal accelerations are an order of magnitude smaller than this, but are still an order of magnitude greater than the mean accelerations of the aircraft centre of mass and rotor hub. We shall therefore neglect the translational accelerations of the hub and many of the smaller nonlinear terms due to products of hub and blade velocities. The approximate acceleration components at the blade station are then given by the expressions

axb = rb(- (fi rhw) + 2p^y 2 (fi rhw) P^x’j

ayb = rb (-(fi – rhw) – P(qhw sin f – phw cos f) + rhw P^y)

azb = rb(^2Qo)x + (qhw cos f + phw sin f – rhw&x – (fi – rhw)2p – pj

(3A.55)

The underscored components are the primary effects due to centrifugal and Coriolis forces and the angular accelerations of the hub, although the latter are also quite small in most cases. For practical purposes, we can usually make the additional assumption that the rotorspeed is much higher than the fuselage yaw rate, so that

(fi – rhw) ~ fi (3A.56)

Interactional aerodynamics

The helicopter is characterized by an abundance of interactional aerodynamic effects, often unseen in design but powerful in their, usually adverse, effects in flight. A principal source of interactions is the main rotor wake as it descends over the fuselage, empennage and through the tail rotor disc. The main rotor wake also interacts with the ground and with itself, in vortex-ring conditions. The modelling problem is therefore largely an extension of the problem of predicting the wake effects at the rotor disc; for interactional aerodynamics we are interested in the development of the wake within approximately one rotor diameter of the rotor. In this space-time frame, the wake is in unsteady transition between its early form as identifiable vorticity and fully developed rolled-up form, and presents a formidable modelling problem.

In recent times a number of factors have combined to increase the significance of interactional aerodynamics – higher disc loadings resulting in stronger downwash, more compact configurations often with relatively large fuselage and empennage areas and the increased use of helicopters in low level, nap-of-the-earth operations. From a design perspective, the most useful information relating to interactional aerodynamics is located in the reports of full and model scale testing. In Ref. 3.44, Prouty discusses a number of datasets showing the effects of rotor downwash on the empennage. A review of test results from a period of activity at Boeing helicopters is reported by Sheridan in Ref. 3.70. In this reference, interactions are classified into downstream (e. g., rotor/empennage upset loads, tail rotor/loss of effectiveness), localized (e. g., rotor/fuselage download, tail rotor/fin blockage), ground proximity (e. g., trim power, unsteady loads from ground vortex) and external interaction (e. g., helicopter/helicopter upset loads, ground winds) categories. One problem that has received considerable at­tention through testing is the interaction of the rotor downwash with the rear fuselage (tailboom) at low speed. In Ref. 3.71, Brocklehurst describes the successful implemen­tation of fuselage strakes to control the separation of the circulatory flow caused by the downwash flowing over the tailboom in sideways flight. Reference 3.72 discusses a number of similar test programmes on US helicopters. In all these cases the use of the strakes reduced the tail rotor control and power requirements, hence recovering the flight envelope from the restrictions caused by the high tailboom sideforces.

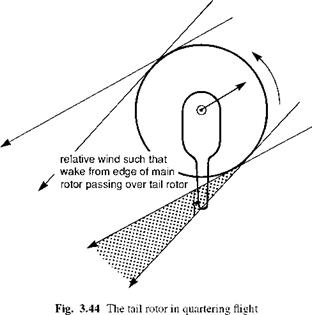
The interaction of the main rotor wake with the tail rotor has been the subject of an extensive test programme at the DRA Bedford (Refs 3.73, 3.74), aimed at providing data for interactional modelling developments. In Ref. 3.73, from an analysis of Lynx flight test data with an instrumented tail rotor, Ellin identified a number of regions of the flight envelope where the interactional aerodynamics could be categorized. Particular attention was paid to the so-called quartering-flight problem, where the tail rotor control requirements for trim can be considerably different from calculations based on an essentially isolated tail rotor. Figure 3.44 shows a plan view of the helicopter in quartering flight – hovering with a wind from about 45° to starboard. There exists a fairly narrow range of wind directions when the tail rotor is exposed to the powerful effect of the advancing blade tip vortices as they are swept downstream. A similar situation will arise in quartering flight from the left, although the tail rotor control margins are considerably greater for this lower (tail rotor) power condition. From a detailed study of tail rotor pressure data, Ellin was able to identify the passage of individual main rotor tip vortices through the tail rotor disc. Based on this evidence, Ellin constructed a Beddoes main rotor wake (Ref. 3.75) and was able to model, in a semi-empirical manner, the effect of the main rotor vortices on the tail rotor control

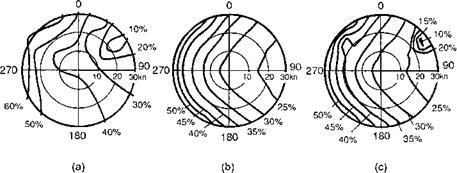
margin. Effectively the advancing blade tip vortices introduce a powerful in-plane velocity component at the tail rotor disc. For the case of the Lynx Mk 5, with its ‘top – forward’ tail rotor rotation direction, this leads to a reduction in dynamic pressure and an increase in control angle and power to achieve the same rotor thrust. Tail rotors with ‘top-aft’ rotations (e. g., Lynx Mk 7) do not suffer from this problem, and the control requirements, at least in right quartering flight, can actually be improved in some circumstances, although interactions with the aerodynamics of the vertical fin are also an important ingredient of this complex problem. Figure 3.45 shows the pedal control margin for Lynx Mk 5 hovering in a wind from all directions ‘around the clock’ out to 30 knots. Figure 3.45(a) presents Ellin’s flight measurements. The limiting condition corresponding to right quartering flight is shown as the 10% margin contour. The

Fig. 3.45 Comparison of the tail rotor pedal margin measured on the DRA research Lynx with theory: (a) flight; (b) Helisim; (c) Helisim corrected (Ref. 3.73)

situation in left quartering flight manifests itself in a drawing out of the 60% contour as shown, although the situation is further complicated in left flight by the tail rotor experiencing vortex-ring flow states. Figure 3.45(b) shows the same result predicted by Helisim with an isolated tail rotor; clearly none of the non-uniformities caused by the interactions with the main rotor wake and fin is present. In comparison, Fig. 3.45(c) shows the Helisimpedal margin results after correction of the dynamic pressure experienced by the tail rotor, using the Beddoes main rotor wake. The non-uniformities in quartering flight are now well predicted, although in flight to the left, the predicted margin is still 10-15% greater than in flight. The results of Ellin’s research point towards the direction of improved modelling for main rotor wake/tail rotor interactions, although achieving real-time operation with the kind of prescribed wake used remains a significant task.

A similar investigation into the effects of main rotor wake/tail rotor interaction on yaw control effectiveness is reported in Ref. 3.76, using the University of Maryland Advanced Rotor Code (UMARC). For predicting the distribution of main rotor wake velocity perturbations behind the rotor, a free wake model was used and correlated against wind-tunnel test data. In general, a good comparison was found, except for the critical positions close to the main rotor tip vortices where peak velocities some 100% greater than predicted were measured. Correlation of predicted tail rotor control margin at the critical quartering flight azimuths was reasonable, although theory typically underestimated the control margins by about 10-15%. The UMARC analysis was conducted on an SH-2 helicopter with top-forward tail rotor rotation and the positive effects of main rotor wake/tail rotor interaction were predicted to be much stronger in theory than measured in flight. The Maryland research in this area represents one of the first applications of comprehensive rotor modelling to wake/tail interactions and their effects on flying qualities.

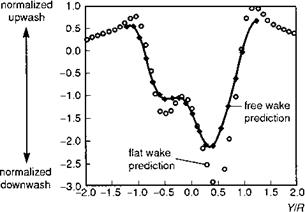
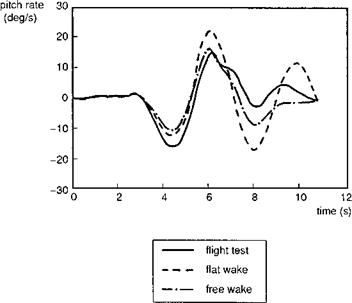
The series of papers by Curtiss and his co-workers at Princeton University report another important set of findings in the area of interactional aerodynamics; in this case, special attention was paid to the effect of the main rotor wake on the empennage (Refs 3.55, 3.77, 3.78). Reference 3.78 compares results using a ‘flat’ prescribed wake (Ref. 3.79) with a free wake (Ref. 3.80) for predicting the induced velocity distribution at the location of the horizontal stabilizer for a UH-60 helicopter. Comparison of the non­dimensional downwash (normalized by momentum value of uniform downwash at the disc) predicted by the two methods, as a function of lateral displacement at the tail surface, is shown in Fig. 3.46. The UH-60 tailplane has a full span of about 0.5R. The simpler flat wake captures most of the features in the considerably more complex free wake model, although the peak velocities from the rolled-up wake on the advancing and retreating sides are overestimated by about 30% with the flat wake. The much stronger induced flow on the advancing side of the disc is clearly predicted by both models. The upwash outside the rotor disc (y /R > 1.0) is also predicted by both models. One of the applications studied in Ref. 3.78 involved the prediction of cross-coupling from sideslip into pitch, a characteristic known to feature quite large on the UH-60. From Figure 3.46, we can deduce that sideslip will give rise to significant variations in the levels of downwash at the horizontal stabilizer – a sideslip of 15°, for example, will cause a shift in the downwash pattern by about 0.25R, to left or right. Figure 3.47 compares the pitch rate response to a pedal doublet input at 100 knots; the flight test results are also plotted for comparison (Ref. 3.78). It can be seen that the powerful pitching moment, developing during the first second of the manoeuvre, is reasonably

Fig. 3.46 Comparison of flat and free wake predictions for normalized downwash at the horizontal stabilizer location; UH-60, p = 0.2 (Ref. 3.78)

Fig. 3.47 Comparison of pitch rate response to pedal input; UH-60, 100 knots (Ref. 3.78)

well predicted by both interactional aerodynamic models. As an aside, we would not expect to see any pitch response from the Helisim model until the yawing and rolling motions had developed. The free wake model appears to match flight test fairly well until the motion has decayed after about 10 s, while the flat wake underpredicts the oscillatory damping.

Ultimately, the value of interactional aerodynamic modelling will be measured by its effectiveness at predicting the degrading or enhancing effects on operational

performance. To reiterate, the motivation for developing an increased modelling capa­bility for use in design and requirements capture, in terms of the potential pay-off, is very high. Much of the redesign effort on helicopters over the last 30 years has been driven by the unexpected negative impact of interactional problems (Ref. 3.81), and there is a real need for renewed efforts to improve the predictive capability of modelling. This must, of course, be matched by the gathering of appropriate validation test data.

At the time of writing, ‘operational’ simulation models with a comprehensive treatment of nonlinear, unsteady rotor and interactional aerodynamics are becoming commonplace in industry, government research laboratories and in academia. Some of these have been referred to above. The computational power to run blade-element rotor models, with elastic modes and quite sophisticated aerodynamic effects, in real time, is now available and affordable. The domain of flight dynamics is rapidly overlapping with the prediction of loads, vibration, rotor aeroelastic stability and aeroacoustics. Yet the overall effects on our understanding of helicopter flight dynamics, stemming from the vigorous developments in recent years, does not appear to have been cumulative. This is partly because of the human factor – the reservoirs of knowledge are people rather than reports and journal papers – but there is another important issue. In the author’s view, the pace associated with our ability to computer-model detailed fluid and structural dynamics has far outpaced our ability to understand the underlying causal physics. Even if the ‘perfect’ simulation model existed, its effective use in requirements capture, design and development would need to be underpinned by our ability to interpret the outputs meaningfully. While the perfect model does not yet exist, it is the vision of many rotorcraft engineers, but the achievement of this goal will need to be accompanied by two companion activities in the author’s view, or not realized at all. First, recalling how important the interplay between theory and experiment has been in the development of rotorcraft, confidence in simulation modelling will increase only through validation against test data. High-quality measurements of surface and flowfield aerodynamics and component loads are difficult and expensive to make and are often available only for commercially sensitive programmes. The focus needs to be on ‘generic’ test data, with an emphasis on manoeuvring flight and into areas at flight envelope boundaries where nonlinearities govern dynamic behaviour. Second, there needs to be renewed emphasis on the development of narrow range approximations that truly expose cause and effect and, just like the critical missing jigsaw piece, provide significant insight and understanding. However, the skills required to build a simulation model and those required to derive analytic approximations, while complementary, are quite different, and it is a mistake to assume that the former begets the latter. The importance of these integrated modelling skills needs to be recognized in university courses and industrial training programmes or there is a real danger that the analytical skills will be lost in favour of computational skills. Chapters 4 and 5 are concerned with working with simulation models, where validation and analytic approximation feature strongly.

Rotor dynamics

Several of the important components of local blade incidence stem from the motion and shape of the blade relative to the hub. A characteristic of Level 1 (flight dynamics) modelling is the approximation of rigid blade motion for flap, lag and torsion. We have seen how the CSER can be used to represent the different types of flap retention system – teetering, articulated or bearingless. In MBC form, the dynamics of one – per-rev disc tilting are apparently well represented. Since the hub moments of interest are produced by the one-per-rev flapping, this level of approximation would appear to be adequate for problems in the frequency range of interest to the flight dynamicist. However, a significant simplification in the centre-spring approximation involves the relationship between the disc tilt and the hub moment. We have suggested earlier that the linear relationship is a powerful attribute of the centre-spring model; if we look more closely at the potential effects of elastic blade motion, we see that what appears to be a strength of the approximation in many cases is actually a weakness in others. With the centre-spring model, it can easily be shown that the moment computed from the disc tilt and the hub moment computed from the integrated aerodynamic loads are always in balance, and hence always in phase. More generally, for both articulated and hingeless rotor approximate models, this is not the case. Consider the blade flap moment (in rotating axes) at the hub, given by eqn 3.15, but expanded to show how the time-dependent generalized (modal) coordinates can be written as a summation of harmonics with coefficients am and bm, as in eqn 3.301:

CO R /со

M(r)(0, t) = Q2 (^n – 1) / mrSn(r)dr £ am cos mty + bm sin mty

n=1 л m=1

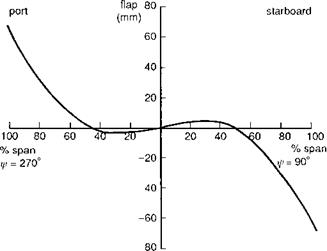
(3.301)

Fig. 3.43 Rotor blade shape at the advancing (90°) and retreating (270°) azimuth angles for

Lynx at 150 knots

Each mode will contribute to the rotating hub moment through the different harmonics, but only the first harmonic contribution to each will be transmitted through to result in quasi-steady fuselage motions. The extent of the contribution of higher modes to the hub moment depends entirely on the character of the aerodynamic forcing; the stronger the radial nonlinearity in the one-per-rev aerodynamic forces, the greater will be the excitation of the higher modes. Of course, the higher the frequency of the mode, the more attentuated will be its one-per-rev tip response, but equally, the hub moment for a given tip deflection will be greater for the higher modes. An il­lustration of the potential magnitude of contributions to the hub moment from higher elastic modes is provided by Fig. 3.43. The blade bending at azimuth stations 90° and 270° are shown for the Lynx rotor in trim at 150 knots, derived from the DRA aeroelastic rotor model. The rotor model used to compute the results shown includes first and second flap modes, first torsion and first lead-lag. The shape of the blade highlights the strong contribution from the second flap mode in the trim condition, with the ‘node’ (zero displacement) at about 50% radius. In fact, the hub moment, defined by the curvature of the blade at the hub, has an opposite sign to the tilt of the disc. The total hub rolling moment (in fuselage axes), computed from either the modal curvature or integrated aerodynamics, is about —1000 N m (to port), clearly in oppo­sition to the disc tilt to starboard. For the case with only the fundamental flap mode retained, the hub moment derived from the first mode curvature is about +2000 N m (to starboard), while the aerodynamic moment integrates to about —600 N m (cf. Fig. 3.43). This result argues strongly for a harmony in the model between aerodynamic and dynamic formulations, particularly for high-speed flight (д > 0.3) when nonlin­ear aerodynamics and hence the effects of higher modes are likely to become more pronounced.

Shupe, in Ref. 3.36, presents results on the effect of the second flap mode over a wide range of conditions, supporting the above conclusion that the influence of the loading on the shape of the hingeless blade at high speed is significant, and higher order modes need to be included in simulation modelling for flight dynamics. Shupe also noted the powerful effects of blade twist on the distribution of out-of-plane bend­ing between the first and second flap modes; twist tends to pull the blade loading inboard, hence leading to a radial aerodynamic distribution with a shape more like the second flap mode. A subtle effect that should be noted here is that the response of the second flap mode to one-per-rev aerodynamic loads will not feature the 90° phase shift associated with the first flap mode. The natural frequency of mode ‘flap 2’ is an order of magnitude higher than that for mode ‘flap 1’ and the phase lag at one-per-rev will be very small. Hence, lateral cyclic (9c) will lead primarily to longitudinal disc tilt (fic) in mode ‘flap 2’, thus having a stronger effect on cross­coupling than the direct response. The influence of the second flap mode in flight dynamics is yet to be fully explored and remains a research topic worthy of further investigation.

Blade dynamic twist will clearly have a major effect on local blade incidence, flapping and hub moments and can arise from a number of sources. Any offset of the blade chordwise centre of mass or elastic axis from the quarter chord will result in a coupling of the flap and torsion DoFs in the elastic modes. The shift of the chordwise aerodynamic centre due to compressibility, stall or by design through swept tip planforms will also be a source of torsional moments from the section aerodynamic pitching moment. References 3.66-3.68 report results of flight dynamics simulation models that incorporate elastic modes, paying particular attention to the effect of elastic torsion. For the cases studied in both Ref. 3.67, using the FLIGHTLAB simulation model, and Ref. 3.68, using the UM-GENHEL simulation model, elastic torsion was shown to have a negligible effect on aircraft trim, stability and dynamic response; comparisons were made with test data for the articulated rotor UH-60 helicopter in hover and forward flight. Articulated rotor helicopters are normally designed so that the blade pitch control is positioned outboard of the flap and lag hinges, thereby reducing kinematic couplings. On hingeless rotors, combined flap and lag bending outboard of the pitch control will produce torsional moments leading to elastic twist of the whole blade or flexing of the control system. This feature was described in the context of the design of the Westland Lynx helicopter in Ref. 3.69. The combination of an inboard flapping element with high lag stiffness and a circular section element with matched flap and lag stiffnesses outboard of the feathering hinge resulted in a minimization of torsion-flap-lag coupling on Lynx. For both articulated and hingeless rotors, it should be clear that the potential for elastic couplings and/or forced torsional response is quite high, and even with designs that have emphasized the reduction of the sources of coupled torsional moments, we can expect the combination of many small elastic and particularly unsteady aerodynamic effects to lead to both transient and steady-state elastic twist.

Aeroelastic effects clearly complicate rotor dynamics but are likely to be an im­portant ingredient and a common feature of future high-fidelity rotorcraft simulations. It will be clear to the serious student of the subject that most of the approximations lie in the formulation of the aerodynamic theory, particularly the dynamic inflow, but the degree of ‘aeroelastic’ modelling required to complete the feedback loop correctly is not well researched. As new rotor designs with tailored elastic properties and ‘flexible’ surfaces become mature enough for application, we should expect an associated in­crease in the motivation for understanding and developing more general and definitive rules for the effects of aeroelastics on flight stability and control.

Modelling local incidence

The local incidence at azimuth station ф and radial station r can be expanded as a linear combination of contributions from a number of sources, as indicated by eqn 3.300:

r; t) = apitch + atwist + aflap + aWh + ainflow (3.3°°)

The component apitch is the contribution from the physical pitch of the blade applied through the swash plate and pitch control system. The atwist component includes con­tributions from both static and dynamic twist; the latter will be discussed below in the Rotor dynamics subsection. The aflap component due to rigid blade motion has been fully modelled within the Level 1 framework; again we shall return to the elastic flap contribution below. The aWh component corresponds to the inclination of incident flow at the hub. Within the body of this chapter, the modelling of ainflow has been limited to momentum theory, which although very effective, is a gross simplification of the real helical vortex wake of a rotor. Downwash, in the form of vorticity, is shed from a rotor blade in two ways, one associated with the shedding of a (spanwise) vortex wake due to the time-varying lift on the blade, the other associated with the trailing vorticity due to the spanwise variation in blade lift. We have already discussed the inflow component associated with the near (shed) vortex wake due to unsteady motion; it was implicit in the indicial theory of Beddoes and Leishman. Modelling the trailing vortex system and its effect on the inflow at the rotor disc has been the subject of research since the early days of rotor development. Bramwell (Ref. 3.6) presents a comprehensive review of activities up to the early 1970s, when the emphasis was on what can be described as ‘prescribed’ wakes, i. e., the position of the vortex lines or sheets are prescribed in space and the induced velocity at the disc derived using the Biot-Savart law. The strength of the vorticity is a function of the lift when the vorticity was shed from the rotor, which is itself a function of the inflow.

Solving the prescribed wake problem thus requires an iterative procedure. Free wake analysis allows the wake vorticity to interact with itself and hence the posi­tion of the wake becomes a third unknown in the problem; a free wake will tend to roll-up with time and hence gives a more realistic picture of the flowfield downstream of the rotor. Whether prescribed or free, vortex wakes are computationally intensive to model and have not, to date, found application in flight simulation. As distributed flowfield singularities, they also represent only approximate solutions to the underlying equations of fluid dynamics. In recent years, comprehensive rotor analysis models are beginning to adopt more extensive solutions to the three-dimensional flowfield, using so-called computational fluid dynamics techniques (Ref. 3.3). The complexity of such tools and the potential of the achievable accuracy may be somewhat bewildering to the flight dynamicist, and a real need remains for simpler approximations that have more tractable forms with the facility for deriving linearized perturbations for stability analy­sis. Earlier, in Section 3.2.1, we referred to the recent development of wake models that exhibit these features (Refs 3.28, 3.29), the so-called finite-state wake structures. Here, the inflow at the rotor is modelled as a series of modal functions in space-time, each satisfying the rotor boundary conditions and the underlying continuity and momentum equations, through the relationship with the blade lift distribution. The theory results in a series of ordinary differential equations for the coupled inflow/lift which can be appended to the rotor dynamic model. Comparison with test results for rotor inflow in trimmed flight (Ref. 3.29) shows good agreement and encourage further development and application with this class of rotor aerodynamic model.

Modelling section lift, drag and pitching moment

The rotor blade section loading actions of interest are the lift, drag and pitching moment. All three are important and all three can signal limiting effects in terms of blade flap, lag and torsion response. A common approximation to real flow effects assumes two­dimensional, quasi-steady variations with local incidence and Mach number uniquely determining the blade loading. In Ref. 3.58, Prouty gives an account of empirical findings based on analysis of a wide range of two-dimensional aerofoil test data. Key parameters defining the performance and behaviour of an aerofoil section are the maximum achievable lift coefficient CLmax and the drag divergence Mach number Md. Both depend critically on the geometry of the aerofoil, as expected, and hence on the type of rotor stall. Prouty identifies three types of stall to which rotor blades are prone – thin aerofoil, leading edge and trailing edge stall.

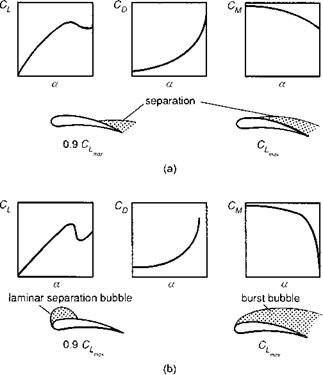
Prouty’s findings suggest that aerofoil sections with thickness-to-chord ratios greater than about 8% will normally experience trailing edge stall and, at their best, achieve values of CLmax up to about 1.6. For thinner aerofoils, leading edge stall is more likely, with a CLmax that increases with thickness/chord up to about 1.8. The general effects of trailing and leading edge stall on lift, drag and moment coef­ficients are sketched in Fig. 3.41, where these are shown as functions of incidence.

Fig. 3.41 Types of aerofoil stall: (a) trailing edge stall; (b) leading edge stall

Trailing edge stall is characterized by a gradual increase in the region of separated flow moving forward from the trailing edge. Leading edge stall is triggered by the bursting of a laminar separation bubble over the nose of the aerofoil giving rise to sharp changes in lift, drag and pitching moment. Generally, thin aerofoils are favoured for their performance (high Md) at high Mach number on the advancing side of the disc, and thicker aerofoils are favoured for their performance (high C^max) at low Mach number and high incidence on the retreating side. Most helicopter blades are therefore designed as a compromise between these two conflicting requirements and may experience both types of stall within the operating envelope. Reference 3.59 de­scribes the evolution of the cambered aerofoil sections adopted for the Lynx helicopter, showing a favourable all-round comparison with the thicker, symmetrical NACA 0012 section. The latter was typical of aerofoil sections used on helicopter rotors before the 1970s.

In blade element rotor simulation models, the lift, drag and pitching moment co­efficients are usually stored in table look-up form as nonlinear functions of incidence and Mach number, with the data tables derived from either wind tunnel tests or the­oretical predictions. In Ref. 3.6, Bramwell reports on the effects of swirl and other three-dimensional, in-plane effects on section characteristics with significant changes in Cimax particularly at the higher Mach numbers. Also, in Ref. 3.60, Leishman draws attention to the powerful effects of sweep angle on CLmax. Generally, however, for a large extent of the rotor radius, the two-dimensional approximation is relatively ac­curate. An exception is close to the tip, where three-dimensional effects due to the interaction of the upper and lower surface flows result in marked changes in the chord – wise pressure distribution for a given incidence and Mach number. Accurate modelling of the tip aerodynamics is still the subject of intense research and renewed impetus with the advent of novel tip sections and planforms.

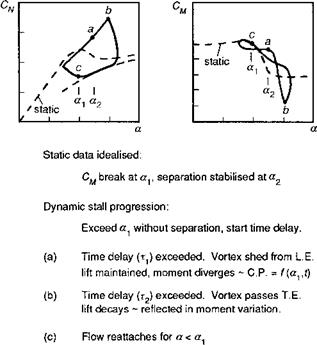
In forward flight and manoeuvres, the section incidence and Mach number are changing continuously and we need to consider the effects of aerodynamic unsteadiness on the section characteristics. In a series of papers (e. g., Refs 3.61 – 3.64) Beddoes and Leishman have reported the development of an indicial theory for unsteady compress­ible aerodynamics applicable to both attached and separated flow, for the computation of section lift, drag and pitching moment. In attached flow, the shed wake in the vicin­ity of the aerofoil induces a time-dependent circulatory force on the section, with a transient growth corresponding to about five chord lengths. A non-circulatory lift also develops (due to the airfoil virtual mass) and decays to zero in approximately the same spatial scale. Both effects are approximated in the Beddoes model by combinations of exponential functions (Ref. 3.63) responding to arbitrary motions of an aerofoil in pitch and heave. To account for the response of the aerofoil to its passage through the wake and individual vortices of other blades, the method also models the loading actions due to arbitrary variations in the incidence of the airflow (Ref. 3.64). A special feature of these developments has been the extension to the modelling of separated flow and the prediction of dynamic stall (see earlier paper by Johnson and Ham for discussion of the physics of dynamic stall, Ref. 3.65). In unsteady motion, the passage of shed vorticity over the aerofoil upper surface following leading edge stall gives rise to a delay in both lift and moment ‘break’, resulting in an overshoot of lift to well beyond the normal quasi-steady value of Cimax. Beddoes has encapsulated this effect in a semi-empirical model, summarized in Fig. 3.42, taken from Ref. 3.62. To quote from Ref. 3.62

Fig. 3.42 Time delay model for dynamic stall (Ref. 3.62) (T. E., trailing edge; L. E., leading edge; C. P., centre of pressure)

For each Mach number the angle of attack (a1) which delimits attached flow is deter­mined by the break in pitching moment and a further angle (a2) is used to represent the condition where flow separation and hence centre of pressure is stabilised. In application, when the local value of angle of attack exceeds a1 the onset of separation is assumed to be delayed for a finite period of time (t1) during which the lift and moment behave as appropriate for attached flow. When this time delay is exceeded, flow separation is assumed to be initiated by the shedding of a vortex from the surface of the aerofoil and after a period of time (t2), during which the vortex traverses the chord, it passes free of the surface. In this interval, lift is generated by the vortex and the overall level maintained equivalent to that for fully attached flow but the centre ofpressure moves aft as a function ofboth angle ofattack and time. When the vortex passes free of the surface, the lift decays rapidly to a value appropriate to fully sepa­rated flow assuming that the angle of attack is still sufficiently high. Ifand when the angle of attack reduces below the value a1 re-attachment of the flow is represented by the attached flow model, re-initialised to account for the current lift deficiency.

Beddoes goes on to suggest ways that the method can be extended to account for trail­ing edge stall and also in compressible conditions, when stall is more often triggered by shock wave-boundary layer interaction (Ref. 3.62). Unsteady aerodynamic effects are essential ingredients to understanding many rotor characteristics at high speed and in manoeuvres, and have found practical application in current-generation loads, vibration and aeroelastic stability prediction models. The impact on flight dynamics is less well explored, but two important considerations provide evidence that for some problems, unsteady aerodynamic effects may need to be simulated in real-time applications. First, we consider the azimuthal extent of the development of unsteady lift and moment. The linear potential theory discussed above predicts a time to reach steady-state lift follow­ing a step change in incidence of about 5-10 chord lengths, equating to between 10° and 20° azimuth. Even the lower frequency one-per-rev incidence changes associated with cyclic pitch will lead to a not-insignificant phase lag, depending on the rotorspeed. Phase lags as low as 5° between control inputs and lift change can have a significant effect on pitch to roll cross-coupling. Second, modelling the trigger to blade stall cor­rectly is important for simulating flight in gross manoeuvres, when the azimuthal/radial location of initial stall can determine the evolution of the separated flow and hence the effect on pitch and roll hub moments particularly. Dynamic, rather than quasi-steady stall, is, of course, the norm in forward flight and manoeuvring conditions.

With two-dimensional test data tables, three-dimensional and low-frequency un­steady corrections and an empirical stall model, deriving the section forces and pitching moment is a relatively straightforward computational task. A much more significant task is involved in estimating the local incidence.

Rotor aerodynamics and dynamics Rotor aerodynamics

The linear aerodynamic theory used in Level 1 rotor modelling is a crude approximation to reality and, while quite effective at predicting trends and gross effects, has an air of sterility when compared with the rich and varied content of the fluid dynamics of the real flow through rotors. Compressibility, unsteadiness, three-dimensional and viscous effects have captured the attention of several generations of helicopter engineers; they are vital ingredients for rotor design, but the extent of the more ‘academic’ interest in real aerodynamic effects is a measure of the scientific challenge intrinsic to rotor modelling. It is convenient to frame the following discussion into two parts – the prediction of the local rotor blade angle of incidence and the prediction of the local rotor blade lift, drag and pitching moment. While the two problems are part of the same feedback system, e. g., the incidence depends on the lift and the lift depends
on the incidence, separating the discussion provides the opportunity to distinguish between some of the critical issues in both topics.