Category Principles of Helicopter Aerodynamics Second Edition

Comparison of Aeroacoustic Methods

There are no measurements for the oblique BVI case of the model problem previ­ously discussed, but results have been computed using two different aeroacoustic methods; one based on FW-H/linear unsteady aerodynamics approach and the other based on CFD – see Strawn (1997). The latter method consists of a CFD solution on and near the rotor blades, followed by an interpolation onto a surface that encloses the rotor. An acoustics integration scheme propagates the acoustic signal to the far-field. This integration scheme is based on a Kirchhoff Ffowcs Williams-Hawkings (KFWH) acoustics formulation. An Euler flow solver (Section 14.2.2) computes the near-blade CFD solution. All nonlinear effects on the acoustic propagation are accurately modeled within the framework of the

Euler equations. The KFWH formulation is used to propagate the acoustics signal to the far field. The KFWH formulation begins with a derivation of the FW-H equation for the radiated noise from a surface with arbitrary motion. The resulting integral equation reduces to the classic FW-H equation when the chosen surface coincides with the surface of the rotor blades. It reproduces the classic Kirchhoff formulation when the KFWH surface is far from the rotor blades. In this particular case, the CFD grid consisted of 135-by-50-by-35 points in the chordwise, spanwise, and normal directions to the blade surface, respectively. The grid had a C-H topology (refer to Fig. 14.1), and extended approximately 1.5 blade radii above, below, and beyond the blade tip in the spanwise direction. A constant time-step of 0.25 degrees of blade azimuthal motion was used. The KFWH surface consisted of a total of 86,400 mesh points distributed over a top, bottom, and side grid. The linear method used 50 spanwise elements along the blade and an azimuthal step of 0.5°.
Comparison of Aeroacoustic Methods Comparison of Aeroacoustic Methods

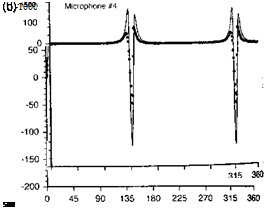
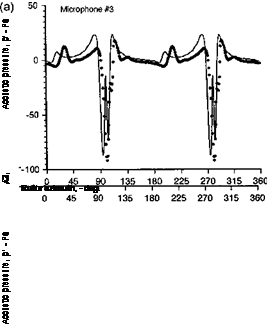
The results are shown Fig. 8.52 for an oblique (y,, = 0.5) case. Results for four reference microphones are shown, three of which lie upstream and below the rotor, with the fourth microphone upstream and in the plane of the rotor. Figure 8.52 shows that the agreement obtained between the FW-H/linear and the CFD/KFWH methods is very good at all of the

Подпись: ШШFigure 8.52 Comparison of sound pressures using FW-H/linear aerodynamics method and a Kirchhoff/CFD method for an oblique (y,. = 0.5) ВVI case, (a) Microphone 1. (b) Microphone 2. (c) Microphone 3. (d) Microphone 4. See Fig. 8.49 for microphone locations. Vortex at z/c = —0.25, tip Mach number = 0.76, vortex strength Г, = 0.406.

microphone locations. For the out-of-plane locations, the sound pressure is comprised of contributions from both “loading” and “thickness” sound waves. The in-plane microphone (Microphone 4) receives only the thickness wave, which is exactly the same in both cases (both positive and negative signs of the vortex strength). The agreement between the two computational methods is very good, but the simple source-sink displacement model used in the FW-H/linear method slightly overpredicts the intensity of the thickness sound wave. The out-of-plane microphones receive sound waves from both thickness and loading sources, which results in somewhat more complicated waveforms. In some cases, the sound waves from the various sources arrive just in-phase, and this can result in either constructive or destructive interference depending on the sign (compression or rarefaction) of the BVI wave front. An example of this is shown in Figs. 8.52(b) and (c). This will affect the net directivity in the acoustic field and shows the difficulties in considering just BVI sources alone as contributors to the noise field.

Overall, this type of simple model problem demonstrates the enormous complexity of predicting accurately the noise from an actual helicopter rotor with its plethora of possible BVI locations. However, it seems that if the structure, strength, and location of the tip vortices relative to the blades are known, then aeroacoustic methods have matured to the point where good noise predictions are possible. Of course, on an actual helicopter predicting the spatial and temporal locations of the tip vortices relative to the dynamically flapping and deflecting blades is really the greatest challenge, and one that is still technically beyond the state of the art. This wake problem is considered in detail in Chapter 10. It would seem that until the more thorough and complete integration of more physically representative wake models and tip vortex models into aeroacoustic analyses is completed, the accurate quantitative prediction of rotor noise will always remain an elusive goal.

BVI Acoustic Model Problem

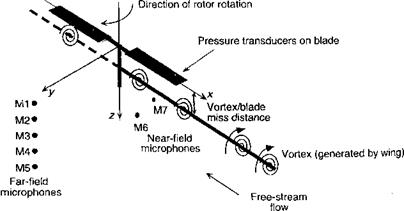
Acoustic results for an idealized BVI problem is now considered, the problem of an actual helicopter being far too complicated to explain the fundamental principles. The model is for an interaction of an elastically stiff two-bladed rotor encountering an idealized streamwise vortex parallel to the x axis, with results for both parallel and oblique (offset) cases being considered. The configuration is shown schematically in Fig. 8.49, which has been examined experimentally by Kitaplioglu & Caradonna (1994) who have measured unsteady blade loads and simultaneous acoustics data. The hover tip Mach number was 0.7 and the rotor was operated at an advance ratio of 0.2. The primary BVI event occurred over the front of the rotor disk where the blade axis was effectively parallel to the axis of the generator vortex. While a BVI event may be expected downstream as well, the effects of the hub were shown by means of flow visualization to rapidly diffuse the vortex and effectively eliminated the BVI at i/9> = 0. Experimental data for the parallel interaction case (>v = 0.0) have been made available and have been compared to predictions from various types of aeroacoustic models – see Caradonna et al. (1997).

BVI Acoustic Model Problem

Figure 8.49 Schematic showing the configuration of the idealized BVI experiment.

BVI Acoustic Model Problem

(a) Parallel blade vortex interaction, у = 0.0


BVI Acoustic Model Problem

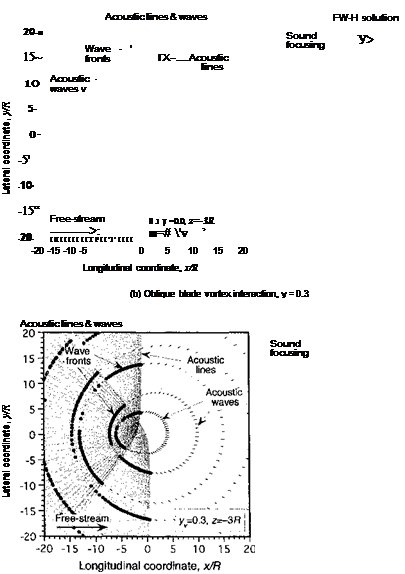
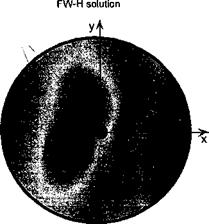
Figure 8.50 Representative acoustic results for a two-bladed rotor encountering an ide­alized streamwise vortex parallel to the x axis. Acoustic lines from BVI sources with supersonic trace Mach numbers and a FW-H solution are shown, (a) Parallel interaction, with vortex on rotor centerline, (b) Oblique interaction with vortex to starboard off the rotor centerline.

In the first case, acoustic lines from BVI sources on the rotor with supersonic trace Mach limbers are compared in Fig. 8.50 with the FW-H solution for an observer plane three rotor dii below the rotor. The wave tracing technique allows for the rapid calculation of the rincipal sound directions and arrival times from all of the BVIs with supersonic source pints. In the parallel case, which is shown in Fig. 8.50(a), infinite trace Mach numbers occur along the blade at фь = (0, тг). The vertex of each ray cone is, therefore, located on the


BVI Acoustic Model ProblemBVI Acoustic Model ProblemBVI Acoustic Model Problem

x axis upstream and downstream of the rotational axis. The ray cones appear as hyperbolic acoustic lines on the horizontal observer plane, with asymptotic slopes ± tan-1 (1 /дМпл). Wave fronts of focused acoustic energy are formed by the intersection of the closely spaced spherical wavelets generated at each of the BVI source points with supersonic trace Mach numbers. The position of these fronts at successive intervals in time (in this case every 2ж radians of rotor revolution) can be tracked by wave tracing. Notice that on the observer plane there are two sets of almost circular wavelets being generated, one from the В Vis occurring at the rear of the disk and the other occurring from the В Vis at the front. These BVI events occur half a rotor revolution apart. It will be seen that the primary wave fronts formed by the intersection of the individual groups of wavelets from each blade travel along the paths defined by the two sets of acoustic lines. Therefore, in the parallel BVI case, the sound wavelets become highly focused in directions perpendicular to the blades at = (0, jr). Notice that the results from the FW-H equation gives an acoustic directivity that is in good agreement with the results from wave tracing.

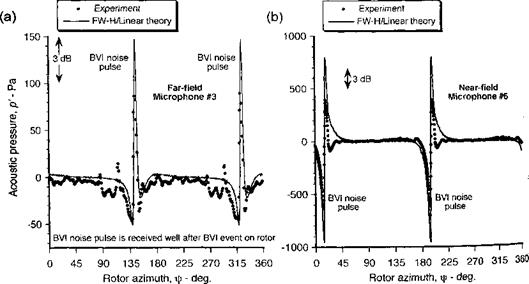
Both the near-field and far-field acoustics are sensitive to the phasing of the unsteady airloads during the BVI. In addition, the duration and phasing of the BVI event along the blade, the Doppler magnification, and the distance of the event to the microphone location combine to produce the net sound pressure signature at a given time. The thickness sound pressure further combines with the loading term, resulting in small variations in phasing that can significantly affect the net noise signature from the rotor. Comparisons of the sound pressure obtained using theory and experiment are given in Fig. 8.51 for a far-field and near­field microphone location. Notice that the far-field sound pressure consists of two В Vi-type pulses, one being generated by each blade as it passes the vortex. The other fluctuations are background noise. The phase of the pulse in time with respect to rotor position depends on the distance to the microphone location. In this case, where the blade and vortex axes

BVI Acoustic Model Problem

Figure 8.51 Comparison of sound pressures using FW-H/linear method with experimental measurements for the parallel (yv = 0.0) BVI case, (a) Far-field microphone 3. (b) Near­field microphone 6. See Fig. 8.49 for microphone locations. Vortex at z/c = —0.25, tip Mach number = 0.7, vortex strength Tv = —0.36.

are parallel, there is essentially one BVI event and all points on the blade produce a sound wave that is in-phase with each other. The agreement of linear theory with experiment is good, both in terms of the peak-to-peak and the character of the acoustic pressure pulse but with an overprediction of peak-to-peak pressure. This seems typical of most computational aeroacoustic methods for reasons that are likely related to nonlinear aerodynamics.

Подпись: rv Подпись: yv R sin fb Подпись: for 0 < rv < 1. Подпись: (8.251)

Because the large majority of BVIs on the rotor involve oblique interactions, it is im­portant to understand their aeroacoustic effects. Aerodynamically, the oblique BVI cases produce significant 3-D unsteady airloads. Also, the directivity of the acoustics is somewhat more complicated in this case. The extension of the problem to oblique BVIs provides a good challenge for any aeroacoustic method and, in the first instance, avoids the complex­ities of the real rotor wake. The obliqueness of the vortex to the blade can be obtained using various offset distances (yv) between the vortex and the longitudinal axis. When the vortex is offset laterally from the longitudinal jc axis, the BVIs with the blades are no longer parallel. This means that there are fewer points along the blade that have supersonic trace Mach numbers. The radial location of the BVIs points in this case can be found using

The corresponding trace Mach numbers are л, , ,ч MUR(rv + fisin fb)

MrOv. fb) =———— ;—- :———- , (8.252)

tan fb

-er! ri \/i tVi fafararknA Uift V 4/t/U

7T/Z. TTuu ivi^iuj jrig.

it can be seen that with a starboard offset of the vortex to yv > 0 the acoustic lines are now directed toward the front of the rotor disk (i. e., into the second and third quadrants). Because of the varying supersonic trace Mach number in the oblique BVI cases, the focused sound waves radiate over a much larger spread angle. Notice that again the results from the FW-H equation predict an acoustic field that is in good agreement with the directivity suggested by the acoustic lines. While the results in Fig. 8.50 represent a discretization of the problem into a finite number of radial blade elements and supersonic source points, each of the solutions in Fig. 8.50(a) and (b) have been computed with the same resolution,[37] and therefore, the concentration of acoustic lines and wavelet fronts can be compared directly.

Подпись: thp 1l/r Подпись: (C Подпись: c>r tViof Л ТГ /О ou ULJtai p ' '

where the blade/vortex intersection angle is у = fb and Mq. r — SIR/a. It is easily deduced that with increasing values of yv fewer intersections points will have values of у that result in supersonic trace Mach numbers. For the special case where yv — 0, the BVIs lie all along

Ffowcs Williams-Hawkings Equation

The movement of all the acoustic waves in the field are mathematically embodied in the Ffowcs Williams-Hawkings (FW-H) equation – see Ffowcs Williams & Hawkings

(1969) for the original derivation. This equation incorporates the fundamental principles of
mass, momentum, and energy conservation through a rearrangement of the Navier-Stokes equations in the form of a wave equation – see also Farassat (1975,1981), Brentner (1997a), and Brentner & Farassat (2003). There have been many subsequent studies of the FW-H equation, including reformations of the equations into different forms that are suitable for different forms of analysis and for use with different types of numerical techniques.

Подпись: p'(x, t) Ffowcs Williams-Hawkings Equation Ffowcs Williams-Hawkings Equation Подпись: dS (8.250)
Ffowcs Williams-Hawkings Equation

According to the FW-H equation the acoustic pressure at a point x at time t can be written in the form

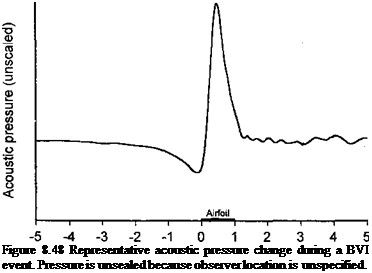
where Zr is the total force on the fluid at each source point on the blade surface S in the direction of the observer and r is the retarded time. The first term in Eq. 8.250 is the thickness noise, which involves a determination of the perturbation velocity, v„, which is produced by the blade as it passes through the flow. The second and third terms are called the loading noise. The third term is a near-field term, which does not represent a propagating wave. Notice that first part of the loading noise is related to the time rate of change of the pressure on the blade. In the compact source limit, this is equivalent to the time rate of change of the lift, which for a BVI event is known to have rapid changes (see previously in Fig. 8.37). As shown in Fig. 8.48, the qualitative nature of BVI sound consists of a highly impulsive change in pressure, and this is fundamentally the source of the “thump-thump” noise so commonly produced by helicopters.

Подпись: Figure 8.48 Representative acoustic pressure change during a BVI event. Pressure is unsealed because observer location is unspecified.

In practice, the evaluation of the FW-H equation is performed numerically in a discretized form, for which for rotor applications several variations are possible. A common computer model for helicopter acoustics is the WOPWOP code developed by Brentner (1986), which uses a retarded time formulation. See also Farassat (1975, 1981) and Farassat & Brentner

Distance traveled in chords

(1987), Brentner (2000), Brentner & Jones (2000), and Brentner & Farassat (2003) for further details on solving numerically the FW-H equation. The computational cost of solving the FW-H equation for helicopter acoustic problems, however, continues to be relatively large and more advanced numerical methods that are more accurate and computationally faster continue to be pursued, including parallel processing – see Long & Brentner (2000). The use of an advanced time instead of a retarded time formulation also allows computational time savings, that is, the time required to propagate the sound into the field (observer) point is calculated directly from the known emission (source) times. While this gives results at unequally spaced observer times, the data can be readily sorted into discrete bins with the same arrival time, as suggested by Fig. 8.45. A typical observer time step must be about 0.5° of rotor azimuth to obtain sufficient temporal resolution. If the observer time overlaps one discrete bin width, then the acoustic information can be weighted over adjacent bins by applying weighting factors. After the complete noise signal is obtained at the observer location from all the sound sources, the time derivative on the appropriate terms in the FW-H equation are taken using a finite-difference formula.

Trace or Phase Mach Number

The acoustic field generated by a helicopter often tends to be highly focused in one specific direction or series of discrete directions. This is because acoustic waves can accumulate along a front. The focusing of acoustic waves depends on the trace Mach number of the acoustic source point – see Lowson (1968, 1996), Sim (1995, 1996), and Leishman (1999). It is known that the sound waves that have their origin from clusters of source points with supersonic trace Mach numbers on the rotor arrive simultaneously (or nearly so) at the same observer location, thereby generating an acoustic convergence. This is similar to the problem of wave focusing on a ground plane from supersonic flying aircraft that generate sonic booms — see Onyenonwu (1975a, b).

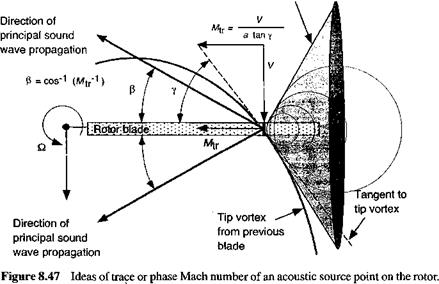
Consider now in more detail the problem of the noise generated by а В VI source point. It will be assumed that the source is acoustically compact. It has been shown previously in Section 8.16.4 that aerodynamic intensity of а В VI depends on the strength of the tip vortex, the distance from the blade to the tip vortex, and the orientation of the vortex to the blade. (See Section 10.4.2 for the method of calculating the ВVI locations over the rotor disk.) The trace Mach numbers of the BVI intersection points between the blade and the axis of the vortex filament inside the rotor disk can, under many conditions, be supersonic. The consequences of this is that the fronts of the spherical sound wavelets generated at the BVI source points on the blades will accumulate along an envelope, similar to a Mach cone generated by a supersonic aircraft. This concept is shown schematically in Fig. 8.47. It is apparent that the principal direction of the sound wave propagation will be normal to the Mach cone.

On a rotor the trace Mach number, Mti, is related to the relative speed of convection of the blade tip vortex axis relative to a blade, V, and the angle of intersection, y, using

Mtr=——, (8.249)

a tan у

Wave front envelope (Mach cone)

Trace or Phase Mach Number

where a is the sonic velocity. A diagram explaining the basic concept is given in Fig. 8.47 for an axis system moving with the rotor. The velocity, V, in Eq. 8.249 must be modified to account for the additional local in-plane convection speed of the vortex filament, which arises from the self-induced effects of the vortical rotor wake or from any blade motion or aircraft maneuver kinematics. It will be apparent from Eq. 8.249 that the trace Mach number can range from subsonic to supersonic, and the trace velocity vector can be directed outward or inward along the blade axis. If the angle of intersection is small, that is, the blade and vortex axes are almost parallel to each other, then the trace Mach number along the blade axis can be significantly supersonic. Figure 8.47 shows that the accumulated wavelet fronts then will propagate into the acoustic field along a ray cone with a semi-vertical angle (5 to the instantaneous trace velocity vector, where f = cos-1 (M^1). Because the value of /3 will vary from point to point on the blade, this effectively forms a series of intersecting ray cones with different vertices and spread angles. The initial conditions of the wavelets are defined by the emission times of all the individual sound fronts that are generated at BVI points with supersonic trace Mach numbers. By numerically computing the positions of the wavelets with respect to time, the pattern of fronts that intersect the plane at any blade angle xfb can be determined.

It is usually desirable to examine the rotor acoustics on a horizontal (ground) plane below the rotor in a frame of reference where the observer moves with the rotor. When the ray cones generated from each supersonic BVI source point in the rotor plane intersect the horizontal ground plane they become conics. This planar intercept is termed an acoustic line because it forms the locus of any acoustic disturbances from the wave fronts that reach the x-y observer plane from the BVI emission points. Notice that after the wavelet intersects the observer plane, the principal direction of the front is along these acoustic lines. If the wave fronts approximately intersect in regions of high acoustic line density, then sound focusing can be said to occur. In forward flight, the radiation cones become distorted by the local flow velocities, although the means of calculating the acoustic lines is the same. By formulating the orientations and intersections of these acoustic lines, which becomes mostly a problem in analytic geometry, it gives a measure of the qualitative directivity of the dominant sound in the far-field as produced by the BVI events on the rotor. This is the essence of the so-called radiation cone methods originally formalized by Ringler et al. (1991), Sim et al. (1995), and Sim & George (1996).

Depending on the trace Mach number and direction of the trace velocity vector along the blade, the resulting acoustic lines can crowd together or overlap. It is, therefore, possible for sound focusing to occur where the acoustic lines lie close together (high acoustic line density), and in some cases they may converge to form so-called caustics. Ringler et al. (1991) and Sim & George (1996) state that caustics or intersections of ray cones result in wave focusing and the formation of acoustic “hot spots.” However, the intersection of acoustic lines (ray cones) is a necessary but not a sufficient condition to produce sound wave focusing. Intersections of acoustic lines as a means of determining locations of focused sound is only meaningful for wavelet fronts (acoustic rays) that have actually reached observer points at the same times, which of course requires either a retarded or advanced time calculation for each wavefront.

Compactness

When a body is large compared to the wavelength of the sound waves that it generates, interference of wave fronts from different parts of the body produce a complicated sound pattern. This is especially important in the region near the body or in the near field. When the body is small relative to the wavelength scale of the sound it generates or the sound is at high frequency, the phase differences between different source points is small and the body radiates like a point source. In acoustics this relative size of the body at a given frequency is called its compactness. Therefore a compact source radiates like a point source, whereas noncompact bodies must be treated in more detail.

In rotorcraft acoustics it is often sufficient to consider unsteady lift producing acoustic sources on the rotor as a series of compact sources. However, some contributions to rotor noise, such as thickness noise and HSI noise, arise because of phase differences between the different times of arrival of sound waves from the leading and trailing edges of the airfoil sections. In these cases, compactness cannot be assumed and the problem is considerably more complicated; see Brentner & Farassat (2003) for a summary.

Wave Tracing

These ideas of source time and arrival time of sound waves are formally embodied in a process known as wave tracing. In a fixed reference frame with respect to the rotor the spherical wavelets that propagate radially from each source point proceed at the local speed of sound plus the component of the flow velocity in the propagation direction, that is, say initially in a direction /3 relative to the blade. For example, for an outward moving source point the initial wavelet trajectory over a period At can be formalized as

Wave Tracing

(8.248)

where (jcв, Ув, Zb) is the acoustic source point on the blade, fa is the blade azimuth angle (or time) of the acoustic source point and (u, v,w) can be considered as the local flow velocities relative to a coordinate system at the rotor hub.

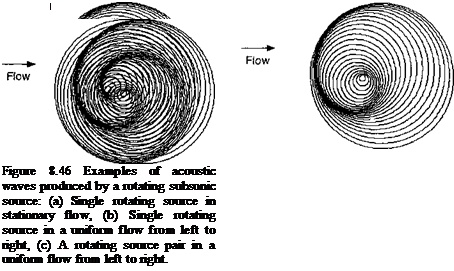
For illustration, it is useful to consider a model problem of the sound field radiated by a rotating point source that has a subsonic Mach number, which is typical of the helicopter rotor. This is a simple problem in concept, but is complicated even here. The principles involved, however, contain most of the physics associated with the acoustics of real rotors. Assume that an acoustic source at a given radius rotates at frequency ft, as shown previously in Fig. 8.44. Assume first that there is no forward motion of the source and no relative flow velocity, so this system corresponds to a helicopter rotor in hover. The results in Fig. 8.46(a) show that the wave fronts coalesce along a spiral and move away from the source point at the speed of sound. With forward speed of the source, in this case with a relative flow from left to right, Fig. 8.46(b) shows that the wave fronts propagate at the speed of sound plus or minus the local flow velocity. In this case upstream moving waves bunch closer together and the downstream moving waves are spread further apart. This is essentially a

Wave Tracing

Doppler effect, which manifests as an increase or decrease of the apparent sound frequency and intensity at upstream or downstream observer locations, respectively. The addition of a second source, as shown in Fig. 8.46(c), makes the problem much more complicated. With the many different potential sound sources on a helicopter rotor, the net sound field tends to be very omnidirectional, but with embedded regions of focused noise.

Principles of Noise Produced by Unsteady Forces

The intensity and directivity of the noise generated by a helicopter is of considerable importance in both civilian and military operations. The field of aerodynamically generated noise is called aeroacoustics and in the case of helicopter rotors it involves several distinct areas of study – see Schmitz (1991) and Brentner & Farassat (2003). Today there are strict certification and community noise constraints that apply to helicopters, especially during takeoffs and landings – see Lowson (1992). There is also a need to abate noise to reduce detectability in military helicopter operations.

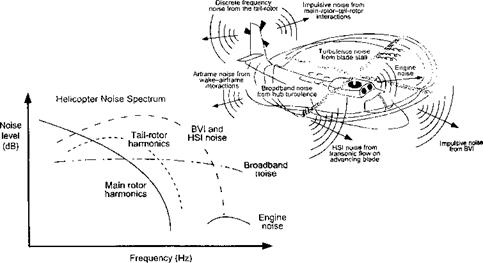
One obtrusive source of noise from a helicopter is from the main rotor, which generally occurs at low frequency and high amplitude. It is often referred to as discrete frequency noise. There are two types of discrete frequency noise, namely blade vortex interaction or BVI noise and high-speed impulsive or HSI noise – see Fig. 8.43. The tail rotor (if one is used) is also a contributor to the overall noise spectrum of a helicopter, tail rotor noise being of higher frequency and often appearing over a wider range of frequencies. Engine noise tends to be at higher frequencies. Other types of noise, called broadband noise, comes from a variety of sources such as boundary layer noise, airframe noise, including ingestion of other parts of the wake and turbulence into the rotor. A plethora of models exist to predict helicopter rotor acoustics these ranging from purely empirical methods to wave tracing methods, to blade element type unsteady aerodynamics models coupled with Ffowcs Williams-Hawking’s (FW-H) methods, to modern CFD-type methods.

Principles of Noise Produced by Unsteady Forces

Figure 8.43 Helicopter noise has many different sources and appears at many different frequencies with different intensities. Adapted from Edwards & Cox (2002).

A large proportion of noise is generated by the unsteady aerodynamic forces, such as interactions of the blades with the wake or with discrete tip vortices, the so-called В VI problem, which has been discussed previously in Section 8.16.4. See Widnall (1971), George (1978), Schmitz & Yu (1986), and Schmitz (1991) for detailed discussions of the BVI noise phenomenon. BVI noise can become stronger when the leading edge of the blade becomes parallel to the axis of the tip vortex, which occurs primarily on the advancing and retreating sides of the rotor disk in forward flight. The BVI noise problem can be especially acute during descending low speed forward flight or during maneuvering flight, where the tip vortices tend to lie closer to the rotor.

Tne nigniy j-d unsteady aerodynamics produced ny tne various cvi events on tne oiaues give rise to multiple noise sources with different directivity and phase relationships. The net sound field, therefore, comprises complicated interfering omnidirectional traveling sound waves, but often highly focused, acoustic wave paths are produced as well. Besides the high computational cost of finding the rotor airloads themselves, which almost certainly will involve the use of unsteady aerodynamic models and free-vortex wake models (see Section 10.7.6). high costs are associated with evaluating the acoustics after the airloads are determined. For example, a typical acoustics calculation may use tens of thousands of observer points to map out the sound field from the rotor, so it becomes very expensive to sys­tematically map out the directivity of the critical regions in the acoustic field. Furthermore, because of the typically pronounced directivity associated with BVI noise there is a very real possibility that localized regions that experience sound focusing effects can be missed, even by using very large numbers of observer points. This may result in misleading comparisons between different rotors and/or at different flight conditions. Overall, the prediction of the noise from a helicopter continues to be an extremely challenging research problem from both a theoretical and applications perspective; see Brentner & Farassat (2003) for a good review of the field.

Because of the complicated wake structure on an helicopter rotor in forward flight, where vortices can lie at many different orientations and inclinations with respect to the blades (see Figs 10.12 and 10.13), it has not yet proven possible to model the aeroacoustics of a helicopter rotor to the fidelity necessary for acceptable predictions without empirical correc­tion, nor with reasonable computing costs. Most aeroacoustic models, however, have been shown to give good noise predictions for idealized problems, such as the interactions of blades with rectilinear-type vortices – see Caradonna et al. (1997) and Sim et al. (1997) for comparisons for idealized problems using different approaches. Several idealized BVI ex­periments have also been conducted – see Surendraiah (1970), Seath et al. (1987), Kokkalis & Galbraith (1986), Kitaplioglu & Caradonna (1994), and Kitaplioglu et al. (1997), who have provided valuable measurements to validate aeroacoustic predictions.

Most of the recent work on modeling the aeroacoustic effects of BVI, however, has con – t eentrated on complete CFD solutions, an example being given by Strawn (1997). However, ?. complete first-principles based CFD approaches for rotor aeroacoustics are not yet practical,

; in part, because of significant numerical dissipation and dispersion errors (see Chapter 14). Furthermore, while coupled CFD based methods have provided much insight into various Jotor aeroacoustic phenomena they are still only research tools and far too computationally expensive for routine use or for the parametric studies that would be necessary for rotor de­sign. Bearing in mind that any aeroacoustic model must be properly coupled to a structural adynamic model of the rotor blades, and perhaps also to a flight dynamics simulation, there _,are clearly many limitations on what quantitative level of acoustic predictive capability for elicopters can be genuinely achieved in the shorter term.

Observer location

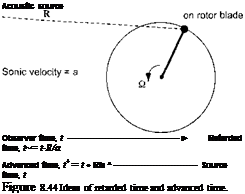
Подпись: Acoustic source Observer time, t ► Retarded time, t~= t-R/a Advanced time, t+ = t + R/a ^ Source time, t Figure 8.44 Ideas of retarded time and advanced time. •———–

8.19.1 Retarded Time and Source Time

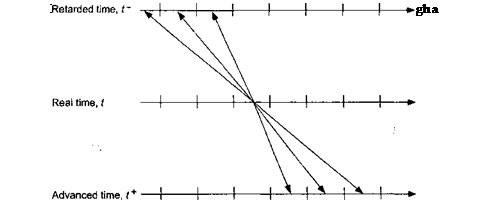
A key issue in any acoustic problem is the determination of the time of arrival of sound waves at a given observer location in 3-D space. The evaluation of the acoustic field requires accounting for either the time of emission of a sound wave from a source point relative to the current or observer time (i. e., a retarded time calculation), or the time of arrival of a sound wave relative to a given source time (i. e., an advanced time calculation). Acoustic waves travel at the speed of sound plus or minus the local velocity of the fluid in which the waves propagate. This may be a nonuniform velocity field, which of course requires that this he known a priori for the acoustics calculation. For example, in a stationary flow the retarded time of the emission of a sound wave after it has traveled a distance R to reach the observer at time t is given by

R

r = r = t———– , (8.245)

a

Подпись: r = Подпись: R v + a Подпись: (8.246)

or in a flow with velocity v in the direction of R the retarded time is

Of course, this means that the intensity of the acoustic source on the rotor must not be evaluated at the present time but according what happened at a past or retarded time, as illustrated schematically in Fig. 8.44. This is essentially a temporal mapping process and is fundamental to any type of acoustic calculation. Of course, for a rotor this retarded time problem increases the complexity of the acoustic calculations tremendously because for a given observer time all of the contributions to the sound at each observer point will have different retarded times – see Fig. 8.45. It is the evaluation of all the retarded times for points all over the rotor that adds significantly to the net computational cost of the problem.

Principles of Noise Produced by Unsteady Forces Подпись: (8.247)

Alternatively, to avoid a retarded time calculation the time of arrival of sound waves at the observer can be determined. This means that the future or advanced time of arrival of a wave at a given observer location is calculated using

This approach means that for a given source time all the acoustic waves must be tracked and the net sound field at a point in the acoustic field must be combined according to

the arrival time. This process was used successfully by Leishman (1996, 1999), mainly because of the large computational time savings, especially for maneuvering helicopter problems – see Brentner & Jones (2000). When using either the retarded time or advanced time formulation, the individual contributions from all wave sources from different source times are added together in amplitude and phase at each observer position and time.

Comparison with Measurements

The preceding theoretical development applies to flaps that do not lose their ef­fectiveness because of viscous effects. In practice a trailing edge flap may operate in a relatively thick turbulent boundary layer because the flap hinge produces a locally adverse pressure gradient that tends to thicken the boundary layer. This will alter the effective flap camber, reducing the flap effectiveness for a given flap deflection angle – see White & Landahl (1968). In addition, the influence of the flap hinge geometry and the possibility of a gap at the hinge leads to additional viscous effects that may adversely alter the re­lationship between the flap deflection angle and the aerodynamic forces and moments – see Gray & Davies (1972). To a first order it is possible to account for such effects by the application of flap effectiveness coefficients. However, because the lift, moment, and hinge moment will be influenced to different degrees by viscosity, the effectiveness of each component of the loading must be considered separately. Flap effectiveness coefficients can be derived most accurately by empirical means on the basis of quasi-steady flow con­siderations; that is, based only on circulatory effects and with regard to measurements of the aerodynamic coefficients at very low reduced frequency with flap angle and gap size. Therefore, the actual aerodynamic forces and moments will be the linear theory values mul­tiplied by constant terms, say en,€m, and 6/,, which may be functions of Reynolds and Mach number.

Experimental results for a NAC A 64A006 airfoil with an oscillating plain flap are reported by Tijdeman & Schippers (1973). The main emphasis in this work was for the high subcritical and transonic flow cases, but results are given for shock-free flow and weak transonic conditions. Under these conditions nonlinear effects are relatively mild and the results can be expected to provide a useful basis for comparison with the foregoing incompressible and compressible flow theories. Some additional results for an oscillating flap on a NLR 7301 airfoil are given by Zwaan (1982a, b), although these data are more limited. From the equations given previously, the response to a particular harmonic motion of the flap can be derived.

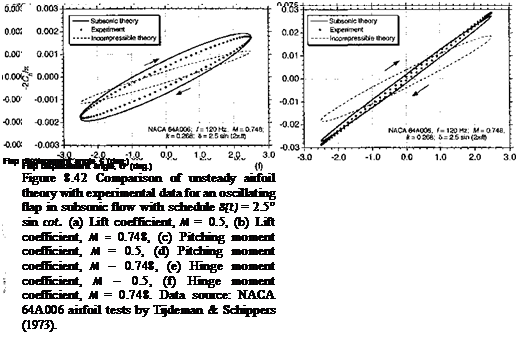
Representative results are shown in Fig. 8.42 for two conditions, one at the lowest Mach number of 0.5 and the other for M = 0.748. Also included in these plots are results from the incompressible theory, but with the lift curve slope corrected by the Glauert compressibility factor 1//3. When plotted versus flap displacement angle, as shown in Figs. 8.42(a) and (b), the lift coefficient curve exhibits a characteristic elliptical loop that is similar to that obtained on an airfoil oscillating in angle of attack. A flap lift effectiveness of e„ = 0.70 was determined from the real part of the aerodynamic response at zero frequency and this value was assumed to be constant over the entire Mach number and frequency range. Notice that in Fig. 8.42(a) and (b) the lift loops are circumvented in a counterclockwise direction, corresponding to a phase lag. At higher flap oscillation frequencies, the lift will develop a phase lead as the noncirculatory terms begin to dominate. However, the effects of increasing free-stream Mach number tends to increase the circulatory lag, which means that the lift mostly lags the flap forcing over the range of conditions typically encountered in practice. This is shown for the M = 0.748 case in Fig. 8.42(b), where despite the higher reduced frequency the phase lag is considerably greater. Notice that the incompressible results do not correlate as well with the experimental results; the incompressible theory does not predict the phasing correctly at the Mach numbers typical of helicopter rotors.

Figures 8.42(c) and (d) show that the airfoil pitching moment behaves in an almost quasi-steady manner. A value of em = 0.96 was found to be applicable for this component of the loading. Here, the pitching moment loops are circumvented in a clockwise sense,

Comparison with Measurements

Comparison with Measurements

but the phase lead is small. In general, there is a weak effect of both Mach number and frequency on the unsteady airfoil pitching moment, and it would be adequately predicted in the general case if quasi-steady conditions were assumed. Figures 8.42(e) & (f) show that the flap hinge moment experiences a considerably more powerful unsteady effect. This proponent is probably the most difficult quantity to predict accurately because it is sensitive to viscous effects; the flap airloads are strongly influenced by the local geometry and pressure ‘ gradients produced near the flap hinge. As discussed previously, such effects are usually corrected for empirically and a hinge moment effectiveness of €h — 0.68 was inferred from e quasi-steady aerodynamic data for this airfoil section. In this case there is a phase lead

between the response and the forcing, giving loops that are circumvented in a clockwise direction. Again, this is because of the noncirculatory terms, which play an important role in determining the aerodynamic response at higher flap frequencies. In this case, even when the free-stream Mach number is low, the disturbances do not propagate sufficiently quickly relative to the flap motion for the flow to be considered as incompressible.

Subsonic Flow Theory

As previously described there are no equivalent exact results that are analogous to Theodorsen’s theory or Wagner’s solution for the unsteady airloads on airfoils in subsonic compressible flow. Here, both the circulatory and the noncirculatory loads have different time-history effect. As shown in Section 8.15 the initial loading on an airfoil operating in a compressible flow can be computed directly using piston theory. For indicial flap

Подпись: and Subsonic Flow Theory
Subsonic Flow Theory

motion (i. e., displacements and rates – see Fig. 8.41) about a hinge located e semi-chords downstream of mid-chord, the initial values airloads according to piston theory are

ACns(s = 0, M) = ———AS, 4 M

(8.227)

(1-е)2 /ASc

ACnAs =0,M) =

4 2MV

(8.228)

ДС„,(І = 0, M) = – —

“е)(2 + е)дз.

2 M

(8.229)

1

0 Зо

( A8c

-(S-°’M) = -12M

(1 + ef — (12e — 4) — 2 (1 — e 2

(v)

(8.230)

These results are valid for any Mach number, but only at s = 0 when the perturbation (8 or 8) is applied. The final values of the indicial response are given by the linearized subsonic airfoil theory, so that for indicial flap displacements

2 p

ДС„,0=оо, М) = —-ДЗ, (8.233)

Подпись: and Subsonic Flow Theory Subsonic Flow Theory

f

Subsonic Flow Theory

The indicial response functions define the behavior between s = 0 and s = oo. The indicial lift, airfoil pitching moment and hinge moment coefficients in response to impulsive flap deflection (about some hinge axis at e) can be written in general functional form as a sum of noncirculatory and circulatory parts, as for the airfoil contributions shown

behavior of the respec­tive indicial airloads between s = 0 and s = 00. The definition of all of these indicial functions is given by Leishman (1994) and Hariharan & Leishman (1996), including the numerical procedures that can be used to manipulate these indicial functions to find the un­steady airloads in response to arbitrary flap motion such as in the recurrence or state-space Grms:

Incompressible Flow Theory

The prediction of unsteady lift, airfoil pitching moment and the hinge moment on an airfoil for a harmonic flap oscillation in incompressible flow has been studied by Kiissner & Schwartz (1941), Theodorsen (1935), and Theodorsen & Garrick (1942) by means of unsteady thin airfoil theory. The results are known exactly for the frequency do­main and can be reformulated in the time-domain with arbitrary flap motion using Duhamel superposition. Other contributions have been made by Drescher (1952). As shown previ­ously for an incompressible flow, the unsteady lift and moment coefficients on a thin airfoil

2V2

The first term in each of the above equations is the noncirculatory (apparent mass) compo­nent. The second group of terms in the equations are all circulatory components, with the Theodorsen function C(k) accounting for the influence of the shed wake vorticity.

With the addition of a trailing edge flap hinged at eb (measured from the mid-chord) there are additional airloads produced that depend on the flap deflection angle, <5, and its time rate-of-change, S – see Fig. 8.41. These additional terms are

Incompressible Flow Theorydbfdt

Perturbation velocity to flap deflection rate, db/dt

Figure 8.41 Nomenclature for airfoil with a trailing edge flap. Perturbation velocities are produced by trailing edge motion: (a) flap displacement, (b) angular rate about the hinge.

where, again, the first group of terms in each equation are of noncirculatory origin. The addition of the trailing edge flap also gives rise to a hinge moment, which is

Подпись: h (1  a -ot + b a — V V 2 V

Incompressible Flow Theory Подпись: (8.205)

Cfi = – A- (2FBb2a – Fbfi) – AC(k)

Подпись: rf — b. Подпись: 2V2 1 2V2 Incompressible Flow Theory Подпись: (8.206)

and

where the individual contributions to the hinge moment in response to the airfoil motion and in response to the flap have been written out explicitly. In the above equations, the “F” terms are geometric constants that depend only on the size of the flap relative to the airfoil chord and are listed by Theodorsen (1935) and by Hariharan & Leishman (1996).

Because of the linear assumption in the thin-airfoil theory, the loading contributions from the airfoil and from the flap can be obtained by superposition. Therefore, the lift, pitching moment and hinge moment in response to independent oscillatory airfoil motion and oscillatory flap motion can be written in coefficient form as

Подпись: Cm(t) = C"c(0 + n Подпись: + 2^ C(k){aqs + 8qs) + Подпись: (8.208)

Cn(t) = Cnnc{t) + 2nC(k)(aqs + 8qs), (8.207)

and

Подпись: (8.209)Подпись:/г.»

Ck(t) = Cf (r) + -^-C(k)(aqs + V) + Cf (f),

where

„„ nba b r .. . .. 1

Cn (0 — —Q—I" [nfl ~ nbaa – VF48- bFx8] ,

c"'(0 = ІЇІ + a2) a – abh] – A. [F, + (e _ a)F,] ЬЧ. (8.211)

Incompressible Flow Theory Подпись: Vbs, Подпись: (8.212)

C**(0 = -Ар ЬгV (I – a) ba + (F4 + Ft0) V4

and


Incompressible Flow Theory

Vba


-2F9 – Fi + F4[a – –


Подпись: (8.214)+ – v2 (F, – f4f, o) a – f VbSF4Ft

7T 2 JT

Подпись: &qs — Подпись: h (  a - a + b [ a I — V 2 V Подпись: and Incompressible Flow Theory Подпись: (8.215)

Notice that in these foregoing expressions several terms have been grouped together; aqs is the quasi-steady airfoil AoA and 8qs is the quasi-steady AoA in response to the imposed flap motion as given by

The foregoing equations hold good only for oscillatory motion of the airfoil and/or the flap. However as shown previously the results can be transformed to handle arbitrary motion by means of Duhamel’s superposition integral with the Wagner indicial (step) response. In the time domain, the unsteady aerodynamic loads can be written as

where фу/ is the Wagner function. This can be written approximately using an exponential function, as shown in Section 8.10. Using these results state-space equivalent arbitrary

Cl(t) = г-ж [(М2/2)(£)2 (А, Ь, + А2Ьг)(і)] [zl((>] + (8’219)

= я (a + 1) [(ЬіЬа/2) (^f (A,6, + A2b2) (f)]

Подпись: (8.220)Подпись: л I+їИ)

Incompressible Flow Theory Подпись: V(0. Подпись: (8.226)

where

Notice that the coefficient terms in the foregoing equations for the flap are the same as for the AoA terms. This is because the circulatory lag function itself [i. e., C(k) or фу/] does not depend on the mode of forcing for incompressible flow (i. e., it does not depend on a, a, 8, or <$). Furthermore, the noncirculatory components and the contributions in response to the quasi-steady terms of the lift, pitching moment and the hinge moment are proportional to the instantaneous displacements for an incompressible flow and involve no additional states. They can be computed directly using Eqs. 8.210-8.214. The circulatory lift acts at the aerodynamic center but there are no additional states required to calculate the pitching moment. Therefore, the complete aerodynamic system for the airfoil and flap in an incompressible flow can be represented by a set of four aerodynamic states. Although it is convenient to separate out the circulatory lift in response to airfoil motion from that in response to the flap motion, in a practical application their net effects can be combined so that, in fact, only two states are required to compute the net circulatory airloads.