Category Principles of Helicopter Aerodynamics Second Edition

Beddoes Method

Another method, originally devised by Beddoes (1983), uses the Kirchhoff or Helmholtz solution for the lift on a flat-plate with a fixed separation point to model the

Beddoes Method Подпись: (7.104)

nonlinear airfoil characteristics. In the Kirchhoff-Helmholtz model, the lift or normal force coefficient on the airfoil, Cn, is approximated by the equation

where 2tt is the normal force-curve-slope for incompressible flow, / is the trailing edge sep­aration point (nondimensionalized with respect to chord), and a is the AoA – see Thwaites

(1960) . Thus, if the separation point can be determined (the difficult part), it is easy to compute the normal force coefficient. The expression in Eq. 7.104 may also be extended to encompass compressible flows where In is replaced by the force-curve-slope at the appro­priate Reynolds number and Mach number [i. e., Cna{Re, Moo)], and a is measured relative to the zero lift angle, that is,

C„=C„JRe. Mt>0)(l+^7 (a-oro). (7.105)

To practically implement this procedure, the relationship between the separation point, /, and the AoA, a, must be obtained. These data are not generally known; however, an “effective” trailing edge separation point, /, can be deduced from the experimental mea­surements of the static Cn variation with a by rearranging Eq. 7.105 to solve directly for f, that is,

/ = I 2 /———- ————- 11 . (7.106)

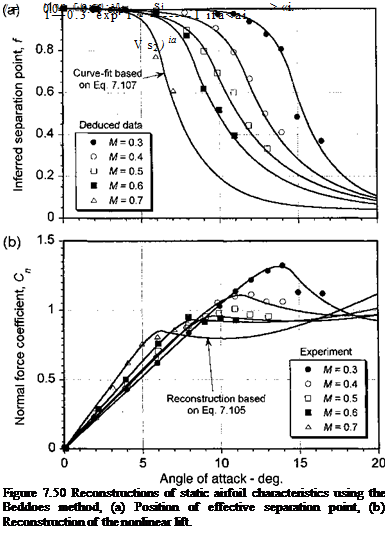
The resulting curves are given by Beddoes (1983) and have been recalculated in Fig. 7.50 for the NACA 0012 airfoil over a range of Mach numbers.

After the values of / have been found, the lift at any AoA can be found by interpolating the values of / and finding the corresponding nonlinear value of C„ using Eq. 7.105. Beddoes (1983) shows that the,/ versus a curves all have a characteristic shape for all

Beddoes Method Подпись: (7.107)

Mach numbers, which turns out to be extremely convenient because the variations can then be generalized empirically in a fairly simple manner using the curve fits

The coefficients Si and S2 define the static stall characteristic, that is, whether the stall occurs progressively or abruptly. The value of a defines the break point corresponding to f — 0.1. This point is defined only as a matter of convenience; however, the value of a when / ~ 0.7 closely corresponds to the static stall AoA. The coefficients Si and S2 and a are easily determined for different Mach numbers from the static lift data. Their values are read from a data table, with values for intermediate Mach numbers being performed using interpolation, as required – see Beddoes (1983).

The pitching moment as a function of AoA can also be found from Kirchhoff-Helmholtz theory. However, in practice the resulting equation is found inadequate and Beddoes has suggested several empirical relations. From the airfoil static data, the center of pressure at any AoA may be determined from the ratio CmfCn (allowing for the zero lift moment CWo). The variation can be plotted versus the corresponding value of the separation point and curve fitted using a low-order polynomial. One suitable curve fit is to use the form

-^=ко + т~/) + к2$т(2тгГ), (7.108)

where ко = (0.25 — xac) is the aerodynamic center offset from the 1 /4-chord. The constant k gives the direct effect on the center of pressure as a result of the growth of the separated flow region, and the constant &2 helps describe the shape of the moment break at stall. Again, the values of ко, k, ki, and m can be obtained using a least-squares fit to the measured center of pressure.

Direct Curve Fitting

Curve fitting the airfoil characteristics using higher-order polynomials is another possible way of representing the nonlinear airfoil characteristics in the high AoA regime. Various strategies are possible, but caution should be used. For example, the lift

may be represented using

Подпись: П (7.102)

Generally, as low an order of polynomial as possible would be used. Typically, N = 3 gives a reasonable approximation. Alternatively, a ratio of polynomials of the form

Direct Curve Fitting

Direct Curve Fitting Direct Curve Fitting

(7.103)

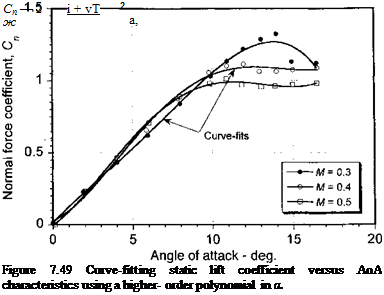
will often prove acceptable. In each case, the coefficients in the series are obtained in a least-squares sense.

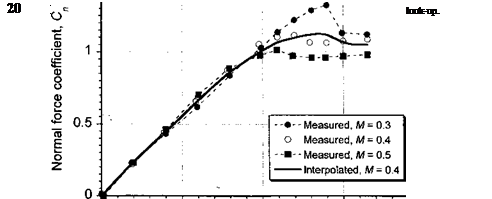
As shown in Fig. 7.49, comparisons of direct curve fitting techniques with test data are reasonably adequate but tend to underpredict the magnitude of the airloads near maximum lift and also change the nature of the stall characteristic. This is typical whenever the airloads change rapidly with respect to AoA. However, single polynomial representations generally do not work well over an extended range of AoA.

Alternatively, the representation of the airfoil characteristics can be broken into smaller ranges of AoA. For example, one curve can be used below stall, and another curve(s) in the post stall regime, while requiring that the curves be piecewise continuous. This method has some difficulties, however, especially when interpolating the curve fit coefficients and break points between Mach numbers. Also, the conditional branching in the computer program consumes more time, which may not be acceptable in some applications, especially real-time flight simulation work where computational speed is paramount.

Nonlinear Aerodynamic Models

In the high AoA regime, flow separation and stall occur and the airloads become highly nonlinear functions of AoA. Therefore, the mathematical representation of the air­foil characteristics in this regime becomes more difficult. Usually this cannot be easily accomplished by using simple polynomial curve fits to the test data. However, mathemat­ically representing the nonlinear airfoil characteristics by means of analytic functions or equations can still be accomplished in several different ways. These methods need to be relatively parsimonious because they will be included inside the blade element models used for the rotor analysis; this means that computational efficiency is always paramount simply because of the very large number of times such models are accessed during a typical rotor calculation.

7.11.3 Table Look-Up

One common way of representing nonlinear airfoil characteristics is to store the measured airfoil data as tables. Generally, one table must be provided for each Mach number. A computer program can be written to manipulate these data and to extract interpolated values of Ci (or C„),Cm, and Cd for any specified AoA and Mach number. This is a procedure used by large comprehensive rotor analyses, and it is also used for flight simulation work where there may be a need for real-time evaluation of the blade airloads and so brevity of calculation is paramount, but without accepting a large loss of physical accuracy.

Representative experimental results for Q versus a for a rotor airfoil at Mach numbers of 0.3, 0.4, and 0.5 are shown in Fig. 7.48. The results for the intermediate Mach number of 0.4 were found by linear interpolation between the results at = 0.3 and Mqq = 0.5. It will be seen that, in the low a range, the results are accurate, but for conditions near stall less reliable results may be produced. If the measurements are spaced at sufficiently small increments in Mach number, then the resulting interpolated data using this kind of scheme is normally viable.

Representing Static Airfoil Characteristics

The details of the airfoil pressure distribution and the variation with Mach number are important for airfoil design and airfoil selection purposes. However, in helicopter rotor performance and airloads analysis the details of the pressure distributions are usually not required because these are too expensive and time consuming to compute on a routine basis. More often it is required to mathematically model the airfoil characteristics in terms of lift, pitching moment and drag coefficients as functions of AoA. These models can then be incorporated into a blade element model, such as the approach introduced in Chapter 3, and in the “comprehensive” rotor models discussed in Section 14.11. Computational tools have not yet evolved to the point where the nonlinear performance of the airfoil at high angles of attack near stall and at high subsonic and transonic Mach numbers near drag divergence can be obtained with confidence. Therefore, reliance is placed on experimental measurements. These experimental measurements of the airfoil characteristics are usually obtained at discrete values of AoA from measurements in 2-D wind tunnel tests.

7.11.1 Linear Aerodynamic Models

In the low AoA regime, and at subsonic Mach numbers, the airloads can be ade­quately modeled using the equations

Подпись: (7.88) (7.89) (7.90) Cfi Ci — Co З- coc,

Cm = mo + ma,

Cd = do + da + d2oc2,
where со, c, mo, m, do, d, and <f2 are empirically derived coefficients obtained through curve fitting to the airfoil measurements. It is very important to recognize that these poly­nomials can only be used to represent airfoil characteristics below stall; they are totally invalid with significant amounts of flow separation or in the stalled flow regime.

Representing Static Airfoil Characteristics Подпись: f7.Q1Y

The aerodynamic significance of the constants cq, c, то, m i, do, d, and <i2 are not always recognized but can be readily established. Usually it is desirable to express the airloads in terms of well-known (measurable) aerodynamic parameters, such as lift-curve-slope and zero lift angle. The usual way of representing the lift is by using the equation

Подпись: (7.92)where Cia is the lift-curve-slope and ao is the zero lift AoA. Expanding gives Ci = Ciaa — Ciaa о = c0 + Ca.

Therefore, со = — Ciaao and c = C/a. The pitching moment about the 1/4-chord is represented by

Representing Static Airfoil Characteristics(7.93)

Representing Static Airfoil Characteristics
Подпись: Cia a0, Подпись: (7.94)

where Cmo is the zero lift moment and xac is the position of the aerodynamic center from the leading edge. Substituting for С/ and expanding gives

which is in the form of

Подпись:Cm = m0 + ma.

Therefore, the coefficient mo includes a combination of the usual aerodynamic parameters Cmo, Qa, as well as xac. The coefficient mi is a term that represents the offset of the aerodynamic center from the 1 /4-chord axis. The pressure drag can be obtained by resolving the components of the normal force and chord force through the AoA using

Подпись: (7.96)Cdp = Cn sin a — Ca cos or.

Representing Static Airfoil Characteristics
Подпись: Ca = Y)aCn tan Of.

The total drag (profile drag) is obtained by adding the contribution from viscous shear to the pressure drag. (This is roughly C^0 at low angles of attack.) Therefore, the total drag can be written as

Typically, Tja is close to but less than one. Thus, the pressure drag becomes Cd = Q0 + Cn sin о: — r]aCn tan of cosof

Подпись: (7.99)— Cdo “t” Cn (1 Tjf) sin Of.

For small angles, sin a ~ a and Cn ~ С/ = C/a (a — «о) so that the total drag is

Cd = Cdо + Cia( 1 – r)a)(ot – af)a

= Cdt + CtJ – I)a)a2 – Cta( 1 – 0

= Q, – (C,.(l – i)„)c«o)a + (C,„(l – r, a)W, (7.100)

which is of the form

Cd — do’A – da + dia2. (7.101)

This equation, like the previous equations for the lift and moment, is valid only in the regimes where the flow is fully attached. Note that d = 0 for a symmetric airfoil («о = 0).

Advanced Rotor Airfoil Design

Several research programs have been undertaken with a view of improving heli­copter performance by careful design and optimization of rotor airfoils. With appropriate design of both the airfoil sections and the blade geometry itself, conventional helicopters can now operate at flight speeds approaching 200 kts (370 km/h) without the rotor being limited by significant stall or compressibility effects. To achieve these speeds by expansion of the flight boundary, it is necessary to vary the airfoil section along the blade to give optimal performance for the extreme in the operating regimes encountered at that blade station.

Programs of airfoil development have been conducted by many of the major helicopter manufacturers and government research organizations. As previously discussed, the NACA 0012 airfoil represents a good compromise between high maximum lift, low pitching mo­ment, and high drag divergence Mach number performance. As shown in Fig. 7.44, reducing the thickness-to-chord ratio of the airfoil gives a marked improvement to the high Mach number performance through a reduction in the drag divergence Mach number. This allows a higher forward flight speed to be obtained with the rotor prior to the onset of increased rotor torque demands. Alternatively, for a given operational forward speed the rotor tip speed can be increased without incurring penalties of drag divergence and flow separation, and so rotor solidity could be reduced, thereby saving weight. However, reducing blade thickness limits the maximum lift capability of the airfoil at low Mach numbers, and this can adversely impact the retreating blade performance of the rotor. Therefore, generally the airfoil section thickness must be maintained to give a compromised high Mach number performance, whereas the high-lift performance is much improved by adding leading edge camber. As shown previously in Figs. 7.33 and 7.34, the maximum lift capability of an airfoil improves rapidly with the addition of some nose camber, although at the expense of some modest increase in pitching moment.

Unfortunately, the addition of camber also affects the shock strength on the airfoil lower surface at higher Mach numbers, causing a reduction in the drag divergence Mach number. Nevertheless, Perry (1987) explains how careful addition of leading edge camber can restore the C/max performance back to the levels of at least the NACA 0012 when operated at the same Mach number, whilst still retaining the higher drag divergence Mach number. The high-lift capability can only be improved further by using camber more toward the rear of the airfoil, but as shown previously in Fig. 7.25, this is at the expense of a more significant increase in pitching moment. On the retreating side of the rotor disk, the high pitching moments that are associated with cambered airfoils can normally be tolerated as the dynamic pressure is relatively low. Yet, on the advancing side, the dynamic pressure is larger, and so the blade pitching moments can be significant enough to manifest in high control loads, and possibly result in flight envelope restrictions. The final design of the airfoil section is usually a compromise in this regard.

The evolution of the Boeing (Vertol) VR airfoil series is shown in Fig. 7.45 – see Dadone and Fukushima (1975) and Dadone (1978,1982, 1987). The VR-12 and the VR-15 airfoils represent the best compromise in terms of maximum lift capability at the lower Mach num­bers typical of the retreating blade whilst also maximizing the drag divergence Mach number and meeting hover requirements and control load limitations. These sections were designed with the aid of numerical methods using a potential flow/boundary layer interaction analysis

ngure /.4Э Boeing VK-senes or neucopter airrou aeveiopment.

and a viscous transonic analysis. These analyses were previously validated against experi­mental measurements on other airfoil shapes so that they could be used with confidence in the airfoil design process.

The ONERA has conducted a systematic development of helicopter airfoil sections [see Thilbert & Gallot (1977)]. These airfoil shapes are designated as the OA – family, for which a selection is shown in Fig. 7.46. The philosophy behind the design of these airfoil shapes also follows that of high Qmax capability at low Mach numbers and a higher drag divergence Mach number. The OA-206 is an example of a thin supercritical-like section, which exhibits a higher drag divergence Mach number and gives potentially large improvements in advancing blade performance. The OA-209 is an example of an airfoil that is a compromise between advancing and retreating blade requirements, with gains in C/max relative to the NACA 0012 at low Mach numbers and with some modest increase in the drag divergence Mach number. Recall that a high Qmax capability is required only on the outboard sections of the

Подпись: . л cum Подпись: _ J

Diaue vuciwcen jj ana ouvo ш rauius; ana maximum lining penormance is reiaxea іиішег inboard. Thus, some reflex camber can be used on the inboard sections to generate lower pitching moments, that is, the OA-212 and OA-213 airfoils.

The Royal Aircraft Establishment and Westland Helicopters have conducted a systematic development of helicopter sections since the late 1960s. A good review of this work is given by Wilby (1979,1998). The first airfoil in the series, the RAE (NPL) 9615, used nose camber to give a moderate increase in C/max compared to the NACA 0012, with a small increase in drag divergence Mach number. Both improvements were made with only a small increase in pitching moment. Later airfoils that were developed included the 12% thick RAE 9645 (see Fig. 6.22), which has more aft camber and gives a 30% increase in Qmax relative to the NACA 0012. The RAE 9648 is a 12% thick reflexed airfoil, which gives a significant nose-up pitching moment whilst retaining most of the high-lift advantages of the RAE 9645. The RAE 9634 airfoil is a thinner 8% thick section, which is designed to minimize transonic

Подпись: OA-206

Advanced Rotor Airfoil Design Advanced Rotor Airfoil Design
Подпись: VR-8

OA-209

flow effects by giving a higher drag divergence Mach number and to delay the nose-down pitching moment (Mach tuck) trend to as high a Mach number as possible.

A series of high-lift low pitching moment airfoils have been devised by the US Army and NASA for helicopter applications. These are designated as the NASA RC-series – see Bingham (1975) and Bingham & Noonan (1982). The RC(3) airfoil families use a careful combination of nose camber, trailing edge reflex camber and a supercritical type thickness distribution to extract the highest static C/max from the airfoil whilst retaining a very low pitching moment and a high drag divergence Mach number. The NASA RC(4) and RC(5) series were designed by Noonan (1990) for high maximum lift coefficients and are suitable for the inboard part of the blade – see Fig. 6.17. The RC(5) family has a lower thickness than the RC(4) family forward of the point of maximum thickness. The RC(6) series is described by Noonan (1991) and is a development of the RC(3) series designed for application at the tip of the blade.

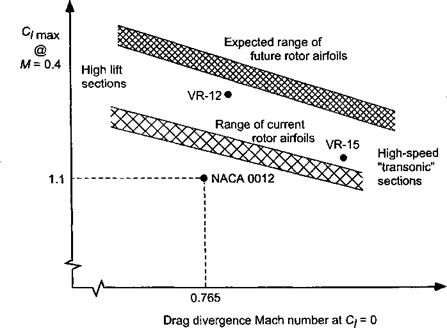
It is in the more precise design optimization of airfoils to meet the 3-D unsteady flow environment at the rotor where future research challenges lie in airfoil design. This will see benefits from advanced computational fluid dynamic (CFD) models based on the Navier – Stokes equations – see Chapter 14. Design for maximum lift and low drag is important for all helicopter airfoils, but CFD methods have not yet matured to a level where turbulent flow separation and stall effects can be predicted with acceptable accuracy. The future, however, will see helicopter airfoils designed more specifically to meet the highly unsteady, 3-D flow requirements in which they really operate. This may provide an exciting opportunity to finally realize desired airfoil performance levels (Fig. 7.47) and so to produce significant gains in rotor efficiency and overall helicopter performance. Until then, the extreme operat­ing conditions and often highly unsteady flow environment found on helicopters means that rotor airfoils must be tested in a wind tunnel to fully assess both their steady and unsteady

Advanced Rotor Airfoil Design

Figure 7.47 The design of new helicopter airfoils will continue to require the synergistic use of modeling and experiment to realize desired performance gains.

aerodynamic performance. Wind tunnel tests are very expensive and time consuming, but they will always form an essential part of validating CFD models used for airfoil design.

The use of passive or active flow control devices may offer further gains in airfoil (and rotor) performance, perhaps increasing the rotor FM by 5-10% and expanding the forward flight and maneuver boundaries of the helicopter. One tried approach is to design the airfoils for natural laminar flow (NLF) over a significant portion of the leading edge region by favorably altering the pressure gradients, in principle lowering skin friction drag at lower lift coefficients. The resulting shapes, however, are usually ill-suited for helicopter rotors because they give a lower critical Mach number and/or higher pitching moments. Anyway, the natural erosion of the leading edge of the blade during service also tends to promote an earlier transition to a turbulent boundary layer, so any gains with NLF are still lost. Laminar flow on better suited rotor airfoils may be increased by using vortex generators [see Kerho & Kramer (2003)] or by applying boundary layer suction or heating/cooling to the surface. The idea here is to suppress the natural growth of unstable disturbances in the laminar boundary layer that eventually lead to transition. While demonstrated on fixed – wings [see Joslin (1998)], suction has not yet been used on helicopter rotors because of the weight and complexity of using pumps, valving, tubing, and so on. Receptivity control, which attempts to cancel out natural disturbances in the boundary layer, also offers some promise in increasing the extent of laminar flow on the blades. Such an approach, however, has many practical challenges in its implementation [see Saric et al. (1998)] and especially so for helicopter rotors. The use of zero-mass flow synthetic jets [see Amitay et al. (1998) and Hassan et al. (2002)] may also lead to enhanced rotor performance by increasing airfoil maximum lift and decreasing drag. There are also good possibilities for using these devices for airframe drag reduction. In general, active flow concepts are likely to see much future interest in the quest for better helicopter performance.

Effects of Mach Number

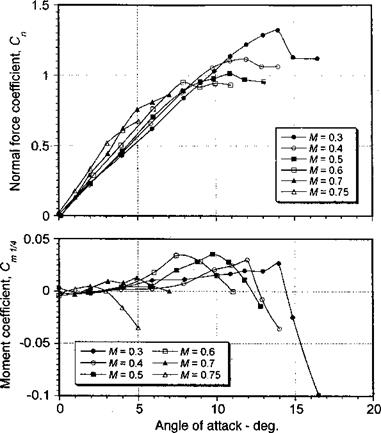
As described previously, airfoil characteristics at Mach numbers above about 0.3 are affected by the compressible nature of a real flow. As an example, the effects of Mach number on the lift and pitching moment characteristics of a NACA 0012 are shown in Fig. 7.38. Two effects are immediately noticeable. First, there is an increase in the lift-curve – slope with increasing Mach number. This is the well-known Glauert effect, as discussed previously in Section 7.6.3. Physically, the effect occurs because pressure disturbances cannot propagate as far upstream in a given time as the Mach number increases. This increases the streamline curvature near the leading edge of the airfoil and manifests as an increase in the effective AoA. Second, the value of maximum lift coinciding with the break in the pitching moment curve tends to decrease with increasing Mach number. This is because of the onset of flow separation produced by the high adverse pressure gradients near the leading edge at low free-stream Mach numbers or near the shock wave at higher Mach numbers.

To explain airfoil behavior at higher Mach numbers, consider the presentations given in

T^rto n ao оn лп n an

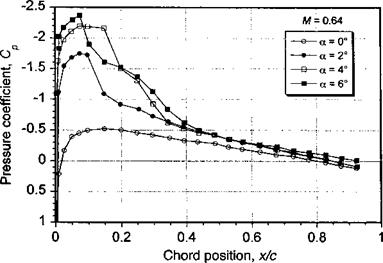
1150. cuiu /.-tv. 115Ш& /,J7 anuwa ui ui& uiduiuuuuii uu the NACA 0012 for a range of angles of attack at a free-stream Mach number of 0.64. As the AoA is increased from 0 to 2°, the flow at the leading edge of the airfoil becomes mildly supercritical (locally supersonic). Under these conditions the flow returns to subsonic con­ditions by passing through a shock wave before reaching the trailing edge. With increasing AoA, the extent of supercritical flow increases and the shock wave moves further aft on the chord and strengthens. However, as the AoA reaches 6° the shock wave becomes more oblique to the airfoil surface and starts to move forward. The pressure behind the shock also decreases as reflected in the “break” in the pitching moment shown in Fig. 7.38. This indicates the onset of flow separation. However, the flow reattaches again some distance

Effects of Mach Number

Effects of Mach Number

Figure 7.38 Effect of Mach number on the static lift and pitching moment characteristics of a NACA 0012 airfoil. Data source: Wood (1979).


Effects of Mach Number

Figure 7.39 Effect of increasing AoA on the upper surface pressure distribution of a NACA 0012 airfoil at = 0.64. Data source: Bingham & Noonan (1982).


Effects of Mach Number

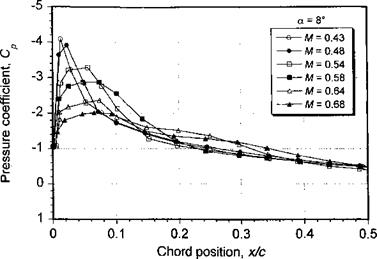
Figure 7.40 Effect of increasing free-stream Mach number on the upper surface pressure distribution of a NACA 0012 airfoil at a constant AoA of 8°. Data source: Bingham & Noonan (1982).

downstream of the shock wave, in effect producing a turbulent separation bubble. This bubble is conceptually similar to a laminar separation bubble and contains a region of low velocity, constant pressure, recirculating flow. During this process, the lift coefficient shows a departure from the linear С/ versus or behavior but continues to increase with increas­ing AoA.

Figure 7.40 shows the upper surface pressure distribution over the leading edge region of the NACA 0012 for a series of increasing values of free-stream Mach number when the airfoil is held at a constant AoA of 8°. As is increased from 0.43 to 0.48, the subsonic form of the pressure distribution changes as the flow near the leading edge becomes mildly supercritical and the steepest adverse gradient moves aft to about 20% chord. With further increases in M^, the shock wave strengthens and moves further aft as the extent of supercritical flow increases. Eventually at M^ — 0.64, the shock becomes sufficiently strong to produce flow separation, which causes the shock to move forward on the chord and to become more oblique to the airfoil surface. Again, the flow reattaches forming a turbulent separation bubble. Further increases in causes the bubble to lengthen, and eventually the boundary layer will fail to reattach, producing complete flow separation over the upper surface of the airfoil. This is called shock induced stall.

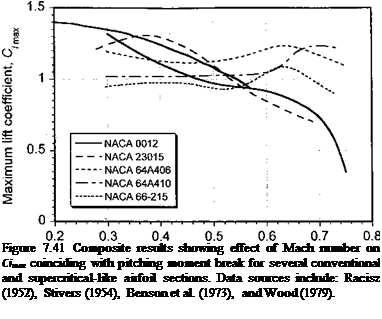
Figure 7.41 shows the effect of Mach number on the maximum value of lift of the airfoil for nominally attached flow. Because the lift continues to increase after the onset of flow separation, these values have been derived by determining the value of С/ corresponding to the break in the pitching moment curve (i. e., the initial onset of flow separation), which will also be coincident with a rapid increase in drag. For lower values of the curves are relatively flat and the airfoils retain their maximum lift, although the effects of compress­ibility clearly cause the values of Qmax to decrease with increasing Mach number. For values of Moo greater than about 0.5, the onset of supercritical flow causes the maximum values of lift to quickly decrease for further increases in M00, at least for the NACA 0012 and NACA 23015 airfoils. At the lower Mach numbers, the camber of the NACA 23015 airfoil increases the value of C/max relative to the NACA 0012, but this advantage is lost at the higher

Free-stream Mach number, M

Подпись: Figure 7.41 Composite results showing effect of Mach number on Cimax coinciding with pitching moment break for several conventional and supercritical-like airfoil sections. Data sources include: Racisz (1952), Stivers (1954), Benson et al. (1973), and Wood (1979).

1 00

Mach numbers because the camber and slightly greater thickness gives the NACA 23015 airfoil a lower critical Mach number. For the higher Mach numbers, the range of angles of attack over which the airfoils can operate without some flow separation is considerably

rcuUCcu.

While most airfoils show a steady reduction of maximum lift coefficient with increasing Mach number, not all airfoils behave this way. Figure 7.41 also shows the Qmax behavior of the NACA 64-series and 66-series airfoils. While the values of C/max attainable by this airfoil at low Mach numbers is inferior to either of the NACA 0012 or 23015 airfoils, there is a beneficial effect on C/max at the higher Mach numbers. The NACA 66-215 and 64- series airfoils have a point of maximum camber fairly far aft, and so these airfoils exhibit a higher critical Mach number and a favorable effect on the strength of the developing shock wave. This is similar to the behavior of supercritical airfoils, the ideas of which have been introduced previously. Improved airfoils for transonic flow applications were originally devised by NASA – see Whitcomb & Clark (1965) and Whitcomb (1976). To achieve this behavior, the leading edge geometry (thickness and camber) must be shaped to produce a longer run of supersonic flow but a weaker recovery shock. These conditions, however, can generally only be obtained for very specific combinations of angles of attack and Mach numbers. For other “off-design” operating conditions these airfoils usually suffer lift and

__ л _______ „—____ *_______ _

uiag pwiaiuca. oupgiuiuLai auiuua nave; ueeu udeu iui luauty уьаїй uujei uau^puu auuau,

and “supercritical-like” sections are used as tip sections on some helicopters. At subsonic speeds, supercritical airfoils can exhibit higher leading edge suction peaks and are likely to encourage stall at lower angles of attack compared to conventional airfoils and thus would not be suitable for the inboard parts of helicopter blades.

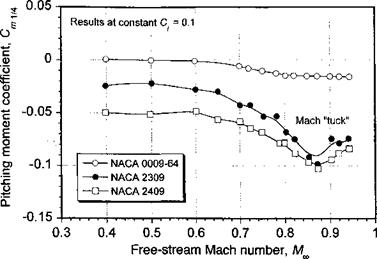
As previously discussed, the effects of compressibility initially cause the aerodynamic center to migrate slightly forward with increasing Mach number. As the flow becomes su­percritical and then transonic, the aerodynamic center shifts more quickly rearward resulting in the Mach tuck phenomenon – see Abbott & von Doenhoff (1945), Dadone & Fukushima (1975), and Prouty (1986). Mach tuck manifests as a rapid increase in nose-down pitching

Effects of Mach Number

Figure 7.42 Effect increasing free-stream Mach number on the pitching moment at con­stant lift coefficient for several NACA series airfoils. Data source: Ferri (1945)

moment for a relatively small change in Mach number. If Mach tuck occurs on the advancing tip of a rotor, then it may produce high blade and control loads and may effectively limit the helicopter’s forward flight speed. For most airfoils, the onset of Mach tuck appears at a slightly higher Mach number after drag divergence as the shock waves begin to strengthen and move more rapidly aft on the airfoil surface.

Because it is possible for the rotor to exceed the tip drag divergence Mach number under various flight regimes such as during dives and certain maneuvers, it is obviously desirable to minimize the nose-down pitching moment trend to as high a Mach number as possible. The data in Fig. 7.42, taken from Ferri (1945), compare pitching moment results at a constant Q =0.1. Figure 7.42 shows that the nose-down trend in the pitching moment is minimized for symmetric airfoils. Experiments have shown that camber applied further to the rear of the airfoil generally results in more severe “tuck” problems than for an airfoil with nose camber. The increased pitching moment is caused by changes in the relative chordwise pressure distributions on the upper and lower surfaces of the airfoil that result from the development of supercritical flow and shock waves. Thus supercritical airfoil design techniques are often used to minimize the strength of the shock wave and can delay the Mach tuck problem on the airfoil to higher free-stream Mach numbers.

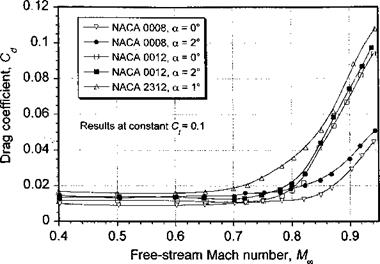
Figure 7.1 has shown that the tip of the advancing blade operates at low lift but at high Mach numbers. Therefore, from a rotor power consumption point of view the drag characteristics of the airfoil when it operates at high Mach numbers are also important. Figure 7.43 shows the drag characteristics of several airfoils as a function of Moo• In the low Mach number range, the drag stays nominally constant or may decrease slightly because of an interdependent effect of increasing Reynolds number. It is only when the critical Mach number is reached that the drag shows a more rapid rise. This drag rise occurs at progressively lower Mach numbers as the thickness-to-chord ratio of the airfoil is increased. A similar effect is obtained by increasing the AoA. The effect of camber also decreases the critical Mach number and so reduces the Mach number at which the drag rise occurs compared to symmetric airfoils of the same thickness-to-chord ratio.

Effects of Mach Number

Figure 7.43 Effect of increasing ffee-stream Mach number on the drag of several NACA series airfoils. Data source: Ferri (1945)

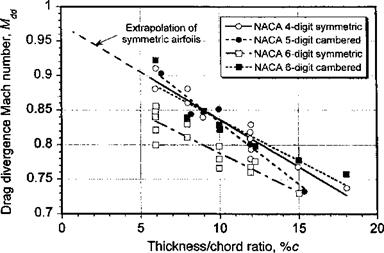
The value of Mqo at which the drag coefficient begins to rapidly increase is known as the drag divergence Mach number, Mdd – Physically, drag divergence occurs because of an entropy loss through the shock wave coupled with additional pressure drag as a result of boundary layer thickening and shock induced separation. Nitzberg & Crandall (1949) discuss the phenomenon in detail. The value of Mdd is often defined in as the Mach number for which dCd/dMpo > 0.1 or, alternatively, the Mach number for which the drag coefficient becomes twice its incompressible value [see Prouty (1986)] at the same Q or a. The drag divergence Mach numbers of airfoils at zero lift are plotted in Fig. 7.44 as a function of

Effects of Mach Number

Figure 7.44 Drag divergence Mach numbers of several NACA series airfoils at zero lift. Data source: Collated information by Prouty (1986).

thickness-to-chord ratio. It can be readily observed that thinner airfoils have a much higher drag divergence Mach number and so will be the best choice for the blade tip region.

Effects of Reynolds Number

At low Mach numbers, variations in Reynolds number will affect both the type of stall and the maximum lift coefficient. A fundamental study of the relationships was first made by Jacobs & Sherman (1937). Increasing the Reynolds number increases the inertial effects in the flow, which will dominate over the viscous effects and, all other factors being

Effects of Reynolds Number

Figure 7.34 Results showing effect of nose camber on C/max. Data source: Jacobs et al. (1937).

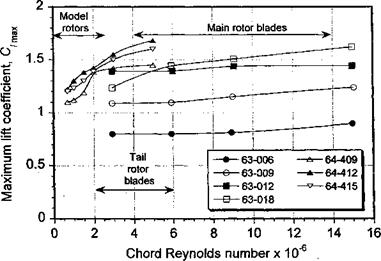
equal, will thin the boundary layer and delay the onset of flow separation to higher values of AoA and lift coefficient. Figure 7.35 shows the effects of increasing Reynolds number for the NACA 63- and 64-series airfoils. The main trend is an increase in C;max, but at a very small rate after a certain value of Re is reached. The main difficulty in assessing the effects of Reynolds number is the interdependent effects of Mach number. The Mach number, M^, may be written in terms of the Reynolds number, Re, as

A/oo = (—)—, (7.87)

paj c

Effects of Reynolds Number

Figure 7.35 Effect of Reynolds number on the maximum lift coefficient of the NACA 63-series and 64-series airfoils. Data source: Racisz (1952).

Effects of Reynolds Number

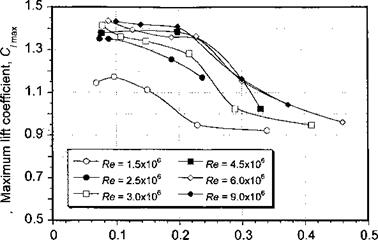
Free-stream Mach number, M

Figure 7.36 Results of independent Reynolds number and Mach number variations on the CW of a NACA 64-210 airfoil. Data source: Racisz (1952).

where c is the airfoil chord. Unless special (pressurized) wind tunnels are used where the Reynolds number can be varied completely independently of Mach number, Eq. 7.87 shows that a change in free-stream Mach number will always be accompanied by a change in Reynolds number and vice versa.

up to Mach numbers of about 0.4, the effects of varying Reynolds number on the maximum lift and stall characteristics can be significant. For example, results showing the independent Mach number and Reynolds number variation on the maximum lift of a NACA 64-210 airfoil section are given in Fig. 7.36. These data show that the Reynolds number has a strong influence on the maximum lift capability at a given Mach number, with larger Reynolds number leading to higher values of C/max for a given Mach number. At higher free – stream Mach numbers the effects of Reynolds number are secondary compared to the effects of compressibility, as confirmed by the fact that curves for each Reynolds number show a converging trend. These effects of interdependent Reynolds number and Mach number should be borne in mind when analyzing results from subscale rotor tests, where the blade Reynolds numbers may be one-quarter or less of the full-scale rotor values.

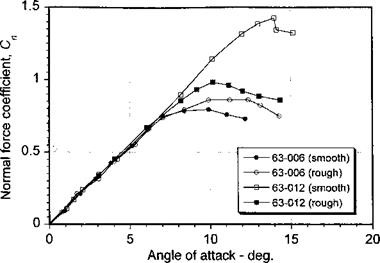
In addition to the effects of Reynolds number and airfoil shape, any roughness on the leading edge of the airfoil may also affect the stall type. Surface roughness causes prema­ture transition from a laminar to a turbulent boundary layer, thereby increasing the effective Reynolds number. Generally, prematurely tripping the boundary layer will always make the airfoil exhibit a trailing edge (gradual) stall, whereby the point of turbulent separation moves forward on the chord with increasing AoA. In wind tunnel experiments, standard roughness is applied to the airfoils in the form of carborundum grains or other standardized approaches – see, for example, Loftin (1945) and Abbott & von Doenhoff (1949). In the case of an airfoil that initially exhibits thin-airfoil stall, leading edge roughness will eliminate the laminar separation bubble and will always give the airfoil a gradual turbulent trailing edge stall characteristic (see Fig. 7.37). As shown by the NACA 63-006 airfoil, this is usually accompanied by a mild increase in C/max. However, the application of standard roughness to an airfoil that initially exhibits leading edge stall will cause the boundary layer to be more susceptible to turbulent boundary layer separation at a lower AoA. Therefore, as shown by

Effects of Reynolds Number

Figure 7.37 Effect of leading edge roughness on the low-speed lift and stall characteristics of the 63-006 and 63-012 airfoils: Data source: Abbott & von Doenhoff (1949).

the 63-012 airfoil, this results in a gradual trailing edge stall characteristic and a significant loss of maximum lift capability.

Maximum Lift and Stall Characteristics

As previously noted, at higher angles of attack the adverse pressure gradients produced on the upper surface of the airfoil result in a progressive increase in the thickness of the boundary layer and cause some deviation from the linear lift versus AoA behavior (see Fig. 7.8). Eventually, the flow7 will separate causing stall. On many airfoils, the onset of flow separation and stall occurs gradually with increasing AoA, but on some airfoils, particularly those with sharp leading edges, the flow separation may occur quite suddenly. In the stalled flow regime, the flow over the upper surface of the airfoil is characterized by a region of fairly constant static pressure. The pitching moment about-the 1/4-chord is much more negative (nose-down) because with the almost constant pressure over the upper surface the center of pressure is now close to mid-chord. Less lift is generated by the airfoil because of the reduction in circulation and loss of suction near the leading edge, and the drag is greater. In addition, under these separated flow conditions, steady flow no longer prevails, with turbulence and vortices being shed alternately from the leading and trailing edges of the airfoil into the wake. Measurements will generally show fairly large fluctuating forces and moments on the airfoil under stalled flow conditions.

One of the most important characteristics used to judge the performance of an airfoil is the maximum static lift capability. This is a quantity that is not easily predicted, even with state-of-the-art computational methods, and reliance must be placed on experimental

Подпись: Ш^/UOUl

rements. However, even from an experimental perspective, absolute values of Cr

are difficult to guarantee with high precision, and especially between tests performed in different wind tunnels. This is mainly because of the uncertainties associated with the testing technique, the aspect ratio of the wing or airfoil specimen, tunnel wall interference effects, and different turbulence intensities in different wind tunnels. McCroskey (1987) gives a good overview of the problem. However, it appears that if airfoil measurements are performed in a consistent manner and to uniform data accuracy standards, such as those defined by Steinle & Stanewsky (1982), the measurements can be considered reliable. However, the formation of test specific 3-D stall developments near maximum lift are difficult to avoid – see Moss & Murdin (1965). See also Prouty (1975) for a survey of rotor airfoil measurements.

Most of the understanding about the aerodynamics of helicopter airfoil sections comes from “2-D” testing in a wind tunnel. However, there are some special considerations that must be understood and appreciated when attempting to interpret the 2-D characteristics of airfoil sections. These issues are especially important when comparing the relative perfor – mance of different airfoils TTcuallv in 2-D tectinc thA airfni! fwina^ is-made, to fnllv span one dimension of the wind tunnel, that is, across the height or width of the test section. This has the effect of making the specimen appear to be of infinite (high) aspect ratio. The pressures around the airfoil at mid-span are measured using pressure taps connected to a scanning valve and a pressure sensor, or by individual pressure sensors directly. At the mid­span, 3-D effects and wind tunnel wall interference effects are much smaller. Alternatively, the test airfoil may often be placed in a 2-D insert, as shown in Fig. 7.30. This reduces the span of the test airfoil, while still maintaining nominally 2-D flow.

Note that no matter what aspect ratio is used for the wing, 3-D separation will ultimately occur – an effect first studied by Moss & Murdin (1965). If this 3-D effect is severe, then

Maximum Lift and Stall Characteristics

Figure 7.30 Sectional airfoil characteristics may be measured using 2-D airfoil testing, in this case involving the use of a special insert installed in the wind tunnel.

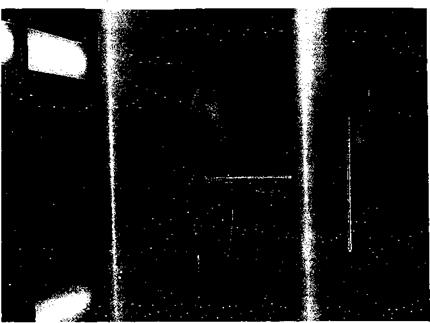
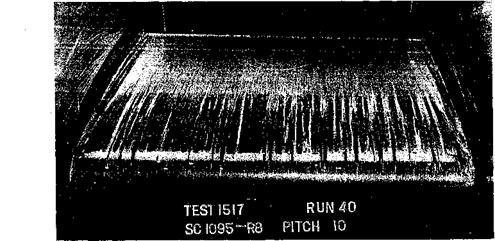
it will almost certainly affect the airfoil characteristics at the mid-span measuring station. Thus, some knowledge of the 3-D stall development on the test airfoil is always essential, especially when comparing the aerodynamic behavior of different airfoils near maximum lift. Figure 7.31 shows a helicopter blade section being tested in a 2-D insert. The flow is rendered visible by surface oil flow in which titanium dioxide power has been dissolved; this gives a white flow pattern on the black painted surface of the airfoil. The photo shows

Maximum Lift and Stall Characteristics

Figure 7.31 Airfoil specimen being tested in a 2-D insert. The flow is rendered visible by surface oil flow visualization showing that a laminar separation bubble forms near the leading edge of the airfoil.

the leading edge of the airfoil (looking downstream). Note the “scarf’ vortex wrapped around the junction between the airfoil and the wall, which tends to keep the flow attached there. The small region of laminar flow is terminated by a laminar separation bubble, which is evident from the accumulation of oil in a narrow band spanwise along the airfoil (see also Fig. 7.5). This bubble has been burst in places by small imperfections in the surface of the airfoil, which causes premature transition to a turbulent boundary layer. The results reinforce how laminar boundary layers are extremely sensitive to disturbances. Downstream of the laminar separation bubble, the boundary layer is fully turbulent. The surface shear stress decreases toward the trailing edge, so the boundary layer ultimately begins to separate from the surface. For this airfoil, the stall mechanism was by means of the trailing edge stall mechanism; that is, the progressive movement of the turbulent trailing edge separation point forward toward the leading edge of the airfoil for increasing AoA.

Abbott & von Doenoff (1949) have documented a summary of airfoil section measure­ments made at Reynolds numbers of 3 to 9 million and Mach numbers up to 0.2. These Reynolds numbers are close to the range encountered by the retreating blade on a full-scale helicopter rotor and provide a consistent basis from which to review the stall characteristics of airfoils, in general. The maximum lift that can be developed by an airfoil when operating at a steady AoA is related to the type of stall characteristic of that airfoil. At low speeds, airfoils generally fall into three static stall categories, as identified by McCullough & Gault (1953) and Gault (1957). These types are thin-airfoil stall, leading edge stall, and trailing edge stall. The results show that thin-airfoil and leading edge stalls can be fairly sensitive to changes in airfoil shape, whereas trailing edge stall is insensitive. Most conventional helicopter rotor airfoils fall into the category of trailing edge or leading edge stall types at low to moderate Mach numbers. It is also common for a mixed stall behavior to occur on some airfoils, which is a stall characteristic that is not clearly one type or another.

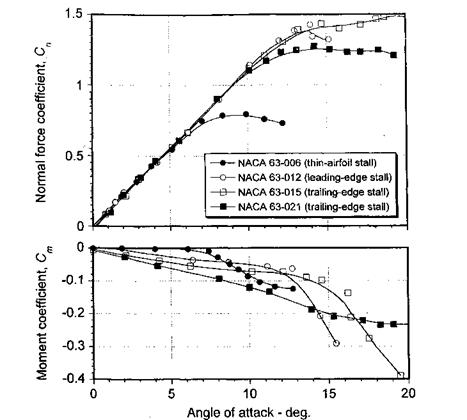
The three low speed static stall characteristics can be illustrated by comparing the lift and moment results for a given family of airfoils that have different thickness-to-chord ratios. For example, Fig. 7.32 shows results for the NACA 63 series airfoil section for thickness – to-chord ratios of 6%, 12%, 15%, and 21%. Thin airfoil stall occurs on the NACA 63-006 airfoil. The sharp nose radius produces high adverse pressures near the leading edge, which results in separation of the laminar boundary layer at low angles of attack. Initially the flow reattaches as a turbulent boundary layer, but as the AoA is increased the turbulent reattachment point moves aft producing a long separation bubble. The formation of the bubble often causes a slight nonlinearity in the lift-curve-slope at moderate angles of attack, say between 3° and 7°. Ultimately, the boundary layer fails to reattach and the airfoil stalls. Thin airfoil stall occurs mainly at low Reynolds numbers and, as shown by Fig. 7.32, it involves a fairly gentle lift stall characteristic with a break in the moment curve at low AoA. This is followed by a progressive increase in nose-down pitching moment as the separation bubble envelops more of the upper surface of the airfoil. Airfoils that exhibit thin-airfoil stall also tend to show considerable hysteresis in the airloads, and different results can be obtained depending on whether the AoA is set in the wind tunnel before turning on the flow or vice versa. The former tends to replicate flow reattachment from stalled conditions. This problem is called static stall hysteresis.

The NACA 63-012 airfoil exhibits what is known as leading edge stall. This airfoil achieves a much higher value of maximum lift, followed by an abrupt stall leading to sharp breaks in the lift and moment curves. The leading edge stall mechanism involves the participation of a laminar separation bubble in the leading edge region, as previously discussed and shown in Fig. 7.6. Transition to a turbulent boundary layer occurs at this bubble. While the airfoil is sufficiently thin to promote laminar separation, the adverse

Maximum Lift and Stall Characteristics

Figure 7.32 Lift and pitching moment characteristics of the NACA 63-series airfoil sec­tions with different thickness-to-chord ratios. Data source: Abbott & von Doenhoff (1949).

pressure gradients are mild enough to cause the transitional turbulent boundary layer to reattach forming this bubble, which is typically 2-3% of chord and is normally situated immediately downstream of the leading edge suction peak in the region of steepest adverse pressure gradient. As the AoA is increased, this bubble moves forward on the chord toward the leading edge. Eventually, the adverse pressure gradient becomes more severe, preventing the turbulent boundary layer from reattaching to the surface, and the bubble can be said to “burst.” Alternatively, the bubble may remain present and the turbulent boundary layer may separate abruptly immediately downstream of the bubble. This is called leading edge stall by the reseparation mechanism – see Evans & Mort (1959). Because both bubble burst and reseparation result in a sudden change in the flow pattern around the airfoil, it is often difficult to discern the actual flow separation mechanism. It can usually be determined with the aid of flow visualization, which can confirm the existence of a laminar separation bubble in the post stall regime. At the Reynolds numbers of practical interest on full-scale helicopter rotors, reseparation is the common flow mechanism for leading edge stall.

The third type of static stall shown in Fig. 7.32, which is exhibited by the relatively thicker NACA 63-015 and the very thick NACA 63-021 airfoil, is called trailing edge stall. This is a fairly common stall mechanism found with the higher t/c ratios and larger camber values typical of some modem rotor airfoils, and it is caused by the relatively gradual movement of the turbulent flow separation point from the trailing edge toward the leading edge. Trailing edge stall produces a progressive rounding of lift behavior near maximum

Maximum Lift and Stall Characteristics

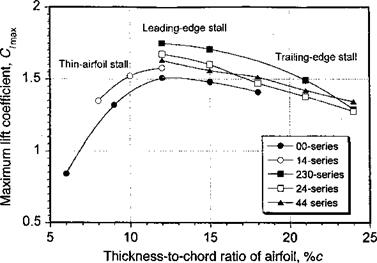
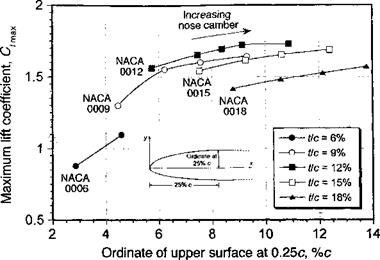
Figure 7.33 Summary of results showing combined effect of thickness and camber on

C/max. Data source: Abbott & von Doenhoff (1949).

lift with a gentle pitching moment break. Another characteristic of the trailing edge stall mechanism is that the pitching moments exhibit a pronounced nose-up tendency just prior to maximum lift. For lower t/с ratios a high value of maximum lift is still produced on airfoils that exhibit trailing edge stall, although generally not as high as for airfoils that exhibit leading edge stall. With increasing tfc, the maximum lift decreases rapidly with trailing edge separation occurring at progressively lower angles of attack. Some airfoils can experience abrupt trailing edge stall, particularly at higher Reynolds numbers, which manifest as a rapid forward movement of the trailing edge separation point and in the absence of supporting evidence, such as pressure distributions and flow visualization, can be easily confused with leading edge stall.

In light of the foregoing, it is apparent that several potential design methods can be used to increase the C/max of an airfoil. One method is simply to change the airfoil thickness, such as using a NACA 0012 over a NACA 0009. Figures 7.33 and 7.34 summarize the experimental results for the NACA airfoils. There are clearly significant advantages in using some thickness to avoid the formation of a long laminar separation bubble, but there is no substantial benefits in terms of C/max for t/c >15%, unless thicker airfoils are needed to meet blade structural requirements near the blade root. Another method is to introduce forward camber for a given airfoil thickness, such as using the NACA 23012 rather than the NACA 0012. These results are summarized in Fig. 7.34. This latter modification gives a more gradual curvature to the airfoil at the leading edge, resulting in a less adverse pressure gradient at a given AoA or lift coefficient. As shown in both Figs. 7.33 and 7.34, all of the cambered airfoils exhibit higher values of C/max compared to the symmetric NACA 00-series, but this will be at the expense of some increase in pitching moment (see Fig. 7.25).
. Reflexed Airfoils

A more elegant way to control the pitching moment of an airfoil is to use reflex camber. Generally, for a given airfoil, the addition of reflex camber to an airfoil with camber in the nose region gives a significant reduction in Cm with only a minor reduction in maximum lift capability and a small drag penalty. Many authors have investigated low pitching moment reflexed airfoils based on cubic caiuberliues — see Glauert (1947) and Houghton & Carpenter

(1993) . A cubic camberline may be expressed as

yc —m a x(x + b)(x — 1), (7.82)

where m is the maximum camber as a fraction of chord, and a and b are general coefficients. While this equation describes a family of camberlines, of specific interest in this case are the values of a and b that will produce a camberline with zero pitching moment. We may define a specific cubic camberline such that dyjdx — 0 at x == p and ydm — 1 at jc — p. This leads to the two simultaneous equations

ap3 + a(b — l)p2 — abp = 1 and Зар2 + 2a(b — l)p — ab = 0, (7.83)

which can be solved for a and b under the assumption that Cmi/4 = 0 (i. e., Aj — A 2 = 0 using the thin-airfoil theory). The results for A and A 2 are given by

Ai = — ^ + ab^ m and A2 = ~m, (7.84)

and by satisfying A — A2 = 0 we find that a = 8.28 and b = 0.875 with p — 0.31. The resulting shape is shown in Fig. 7;28 for m = 0.2. It is apparent that only a small amount of reflex at the trailing edge is required to negate the pitching moment produced by the positive camber near the leading edge. Many modem helicopter rotor designs take advantage of the low pitching moment benefits produced by reflex cambered airfoils.

7.8 Drag

Drag forces on airfoils. operating in attached flow are typically nearly two orders of magnitude less than the lift forces at the same AoA. There are two sources of drag:

2

Figure 7.29 Measurement of drag by wake momentum deficit approach.

1. Pressure drag, and 2. Viscous shear drag. The sum of these is called profile drag. In addition, at higher Mach numbers there is a source of drag known as wave drag, which is important whenever a shock wave forms of the airfoil. Pressure drag may be estimated by the integration of pressure with respect to airfoil thickness as previously described. However, for this to be accurate a good concentration of pressure points is required in the region of high suction pressure (usually the leading edge region). The problem is complicated, however, with the formation of supercritical flow and a shock wave. Alternatively the drag may be measured with a force balance. This has the advantage of measuring both the pressure and viscous shear drag. However, the measurements must be properly corrected for any 3-D effects associated with the airfoil configuration in the test facility.

One common way of estimating the steady drag on a 2-D airfoil section is to estimate the momentum loss in the wake of the airfoil by measuring the velocity profile downstream of its trailing edge, as shown in Fig. 7.29. This is sometimes called the “wake rake” technique. By placing a control volume around the airfoil section and its wake, we can use the momentum equations in integral form to find the time rate of change of momentum into and out of the control volume. This will give a force on the fluid as it passes through the control volume, and by Newton’s third law, this force is equal and opposite to the (drag) force on the airfoil.

By looking at the change of momentum in the streamwise direction, it can be shown that

. Reflexed Airfoils(7.85)

The two integrals can both be expressed in terms of y2 by using conservation of mass through the stream tube pV^dyi = pV^dyi – Therefore, the drag force may be written as

. Reflexed Airfoils

Подпись: У і
. Reflexed Airfoils
Подпись: V2=V2(y)
. Reflexed Airfoils
Подпись: Note: Thickness of turbulent boundary layer and wake is exagerated for clarity

(7.86)

Good accuracy has been demonstrated with this method if the measurement plane is about 15% chord downstream from the trailing edge of the airfoil. (See also Question 7.9.) However, this technique is only valid for angles of attack below stall. When significant flow separation exists above the airfoil, the technique becomes less valid because of other rotational losses that do not appear as a loss of momentum in the downstream wake. In these circumstances, the drag must be measured with a force balance or from pressure integration around the airfoil surface. However, the sectional drag can be measured reliably by means of this wake rake or wake survey technique at low angles of attack (which gives a measure of both the viscous and pressure drag) and by pressure integration to obtain the pressure
drag component alone. The total or profile drag is then the sum of the viscous drag and the pressure drag. The wake rake technique, however, cannot measure the unsteady drag, this only being possible by the integration of unsteady surface pressures.

Use of Trailing Edge Tabs

On helicopter airfoils, trailing edge tabs are frequently used to help negate the pitching moment produced by positive camber over the leading edge nose region, while retaining the benefits of a high maximum lift achieved by the use of camber. An example is the HH-02 shown previously in Fig. 7.24. As shown in Fig. 7.25, the mean camberline near the trailing edge affects significantly the pitching moment, and also the zero lift angle of the section is altered. On early helicopter rotors, trailing edge tabs were used to move the aerodynamic center further aft to help control or delay the onset of torsional flutter. Today, this is done by better airfoil design. Furthermore, an aft aerodynamic center is desirable as less nonstructural mass has to be installed in the blade to achieve the proper net moment balance about the elastic axis of the blade for aeroelastic stability reasons.

Use of Trailing Edge Tabs

By means of the thin-airfoil theory (Section 14.8) the contributions to the lift and moment from the tab can be obtained for a given tab size and angle of deflection. The problem was first examined experimentally by Wenzinger (1935). Assume that the ratio of the tab chord to the airfoil chord is given by E, as shown in Fig. 7.26, and the tab deflection angle is rj. An upward deflection of a tab makes the ordinates of the mean camberline more positive in the trailing edge region. As a consequence, the zero lift angle becomes more positive, and the lift and net pitching moment are reduced for a given AoA. The curvature of the camberline is zero for x < (1 — E) and takes a value rj for x > (1 — E). Thin airfoil theory gives for

Use of Trailing Edge Tabs(7.79)

where 0t is the value of 9 at the tab, that is, 6t = cos 1{2E — 1). In a similar way, A and A2 can be evaluated as

Use of Trailing Edge Tabs(7.80)

c

Подпись: Ec

Use of Trailing Edge Tabs

Camber from tab

(1 -E)c

Figure 7.26 Airfoil with a trailing-edge tab and thin airfoil model.

Подпись: —^ = — 2(7T — 6i — sin&l and —= — sinfy(cos0, — 1). (7.81)

The incremental lift and moment from tab deflection can, therefore, be written as

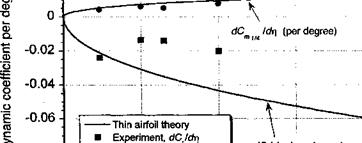
Подпись: Figure 7.27 shows the results of tab deflection on the lift and moment as a function of the ratio of the tab to airfoil chord. Experimental results, which have been collated by Prouty (1986), correlate reasonably well with the predictions made by thin-airfoil theory. The larger tabs have the ability to produce sizable pitching moments, but without any significant

trailing edge tabs (or flaps) provided the tab deflection remains below 5°. If the deflection angle is significant, the adverse pressure gradients found in the region where the tab in initiated will lead to boundary layer thickening and a reduction of maximum lift and increase in profile drag. On contemporary rotors, small trailing-edge tabs are often apparent and are there to help track the rotor, but they are built into only a small part of the blade span.

Подпись:Подпись: E -0.08Подпись: dCJdrx (per degree)Подпись: • Experiment, dC ІбцПодпись: m 1/4Подпись:Use of Trailing Edge Tabs

Подпись: 0.2 Use of Trailing Edge Tabs

-0.1

Figure 7.27 Effects of trailing-edge tabs on lift and pitching moment. Positive upward tab deflection. Data source: Collated results by Prouty (1986).