Category Dynamics of Flight

Longitudinal Characteristics of a STOL Airplane

The curves of Fig. 6.5 show that the characteristic modes of an airplane vary with speed, that is with the equilibrium weight coefficient CWo. In particular, the two char­acteristic periods begin to approach one another as CWg becomes large. It is of inter­est to explore this range more fully by considering a STOL airplane, operating in the “powered-lift” region for which CWo may be much larger. To this end the data given in Margason et al., (1966) has been used to obtain a representative set of coefficients for 2.0 < CWo < 5.0. The flight condition assumed is horizontal steady flight, so that Cxo = 0. (The particular data used for the reference was that for the aircraft with a large tail in the high position, i, = 0, and Sf = 45°.) From the given curves, and from cross-plots of the coefficients CL, CD, and Cm vs. CT at constant a, the data in Table

6.5 were derived for the equilibrium condition. Smooth curves were used for interpo­lation. Since this is not a tilt-wing airplane, aT is not large in the cases considered, and has been assumed to be zero.

Подпись: CXu = CTu 11 Подпись: ЭСд Э CT Longitudinal Characteristics of a STOL Airplane Longitudinal Characteristics of a STOL Airplane

Since aeroelastic and compressibility effects are negligible at the low speeds of STOL flight the required speed derivatives are given by (see Table 5.1)

For a propeller-driven airplane, the value of CTu is given by (5.3,6), and an examina­tion of the data for a typical constant-speed propeller at low speed[17] showed that dT/du is very small. Hence we have used CTu = —2CTo in this example.

cw„

CTa

c^t

hj

dCL

dCT

3CD

dCT

dCm

dCy

2.0

0.53

5.75

1.19

0.500

0.705

0.285

-0.090

2.5

0.72

6.20

1.80

0.475

0.790

0.328

-0.070

3.0

0.90

6.65

2.41

0.450

0.875

0.370

-0.050

3.5

1.09

7.10

3.02

0.424

0.955

0.411

-0.030

4.0

1.28

7.55

3.63

0.398

1.025

0.450

-0.010

4.5

1.46

8.00

4.24

0.371

1.097

0.488

+0.010

5.0

1.65

8.45

4.85

0.346

1.165

0.525

+0.030

Table 6.5

Basic Data for STOL Airplane

Using the formulae of Table 5.1, the following estimates were made of the q and 6t derivatives:

C = -14, Cm? = -17.9, CZa = -5.5, Cmi = -13

Finally the following inertial and geometric characteristics were assumed:

W = 40,000 lb (177,920 N), S = 1000 ft2 (92.9 m2),

A = 5.42, c = 13.60 ft (4.145m),

H = 76.8, ly = 385, h = 0.30
Подпись: 100 u>t* Figure 6.10 Root locus—short-period mode, STOL airplane.

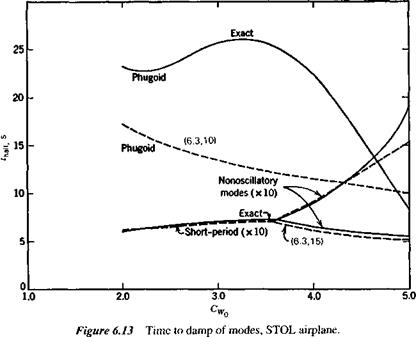
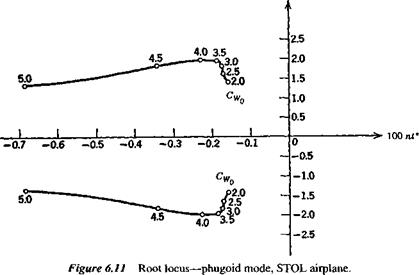
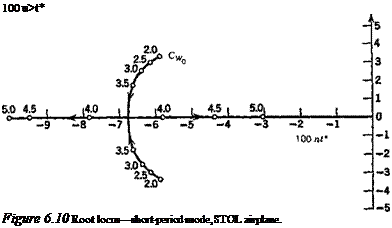
With the above data, the coefficients of the system matrix were evaluated, and its eigenvalues and eigenvectors calculated. The main results are shown on Figs. 6.10-6.13. Figures 6.10 and 6.11 show the loci of the roots as CWo varies between 2 and 5. The effect of CWo is seen to be large on both modes, the short-period mode be­coming nonoscillatory at a value of CWa somewhat greater than 3.5, and the damping

100 wf

Longitudinal Characteristics of a STOL Airplane

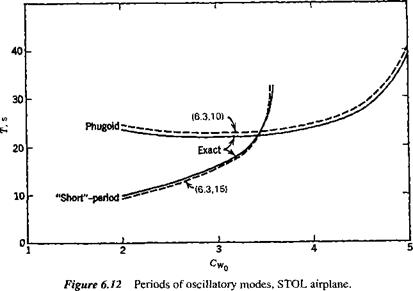
of the phugoid increasing rapidly at the same time. Figure 6.12 shows the two peri­ods, and that they actually cross over at CWo — 3.4. The concept of the phugoid as a “long” period oscillation is evidently not applicable in this situation! The approxima­tions to the phugoid and the pitching mode are also shown for comparison. It is seen that they give the two periods quite well, and that (6.3,15) also depicts quite accu­rately the damping of the pitching oscillation and of the two nonperiodic modes into which it degenerates at high CWa. The phugoid damping, however, is not at all well predicted by the approximate solution. Figure 6.13 shows that the modes are all heav­ily damped over the whole range of CWo.

Longitudinal Characteristics of a STOL Airplane

Longitudinal Characteristics of a STOL Airplane

EFFECT OF CG LOCATION

It was indicated in Chap. 2 that the single most important aerodynamic characteristic for longitudinal stability is the pitch stiffness Cma, and that it varies strongly with the CG position, that is,

cma = cLa(h – hn)

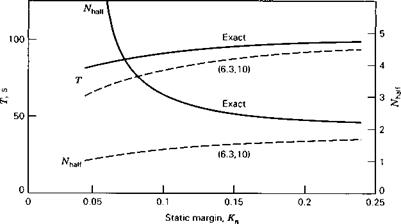
where the static margin is Kn = hn — h. The effect of this parameter is demonstrated by using (4.9,18) with variable Kn. The results, with all the other numerical data iden­tical with that in Sec. 6.2, are shown in Figs. 6.7-6.9. Figure 6.7 shows that the phugoid period and damping vary rapidly at low static margin and that the approxi­mation (6.3,10) is useful mainly at large Kn. Figure 6.8 shows the variation of the

EFFECT OF CG LOCATION

Static margin, K„

Figure 6.8 Variation of period and damping of short-period mode with static margin.

EFFECT OF CG LOCATION

(а)

EFFECT OF CG LOCATION

-.03 0 .03 .06 .09

(6)

EFFECT OF CG LOCATION

(с)

Figure 6.9 (а) Locus of short-period roots, varying static margin, (b) Locus of phugoid roots,

varying static margin, (c) Locus of phugoid roots, varying static margin, Mu = 0.

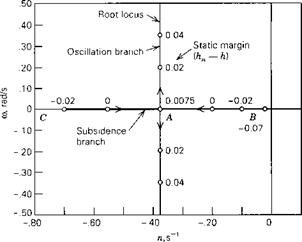
short-period roots. These, too, vary strongly with pitch stiffness, the mode becoming nonoscillatory at a static margin near zero. The approximation (6.3,15) is excellent over the whole oscillatory range.

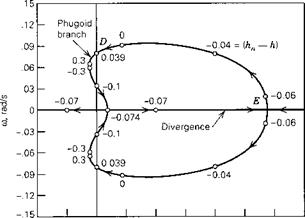
Important additional insight into these modes is obtained by examining the root loci obtained by varying the static margin. These are shown in Fig. 6.9. Figure 6.9a shows that the damping, n, of the short-period mode remains virtually constant with decreasing Kn while the frequency, to, decreases to zero at point A where the locus splits into two real roots, branches AB and AC of the locus. These of course represent nonperiodic modes or subsidences. Figure 6.9b displays the much more complex be­havior of the phugoid. With reducing static margin (rearward movement of the CG) this mode becomes unstable at point D. At (totally unrealistic!) negative static margin beyond —0.1, a new stable oscillation has reappeared. However, it is accompanied by a catastrophic positive real root far to the right.

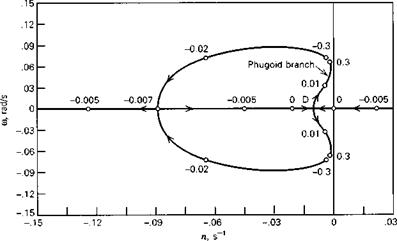
The importance of the Mu derivative was shown earlier. It is again displayed in Fig. 6.9c, which repeats the locus of the phugoid roots with Mu set equal to zero. The corresponding locus for the short-period roots is almost identical to Fig. 6.9a. The pattern with Mu = 0 would be more representative of a rigid airplane at low Mach number. It shows a stable phugoid at all static margins as Kn is decreased until it splits at point D into a pair of real roots. The left branch from D then interacts with the branch AB of the short-period locus to generate a new stable oscillation while the right branch crosses the axis to give an unstable divergence at negative static margin.

EFFECT OF VERTICAL DENSITY GRADIENT

We might expect on physical grounds that the vertical gradient in atmospheric den­sity would have an effect on the phugoid mode. For when the airplane is at the bot­tom of a cycle and moving fastest it is also in air of greater density and hence would experience an additional increase in lift. It turns out that this effect is appreciable in magnitude. We shall therefore do two things: (1) show how to include this effect in the general equations of motion, and (2) derive a representative order of magnitude of the change in the phugoid period.

Подпись: Дй w Я де ІЕ EFFECT OF VERTICAL DENSITY GRADIENT Подпись: Д и w Я де Подпись: (6.5,1)

The modification to (4.9,18) consists of moving the Д zE equation into the matrix equation and adding some appropriate derivatives to the aerodynamic forces (4.9,17). Since the only possible steady reference state in a vertically stratified atmosphere is horizontal flight, we take 90 = 0. If A denotes the original system matrix, the result is

0 1 о

In (6.5,1) there are three new derivatives with respect to zE• Consider Zz first:

Z = CzpV2S

Подпись: (6.5,2)dZ dZ dp

= V[16]S

EFFECT OF VERTICAL DENSITY GRADIENT

dZE Эр dzE

It is reasonable to neglect the variation of Cz with p, and the density varies exponen­tially with height,2 so that

p = p0eKZ£

and —— = кр (6.5,3)

uZe

where к is constant over a sufficient range of altitude for a linear analysis. It follows that

Xz — kX0 Mz = kM0

From (4.9,6) we get the reference values, leading to

Подпись: (6.5,5)

EFFECT OF VERTICAL DENSITY GRADIENT
Подпись: (6.5,4)
Подпись: Similarly,

Zz = —mg к X=M= 0

The result is a rather simple elaboration of the original matrix equation. To get an es­timate of the order of magnitude of the density gradient effect, it is convenient to re­turn to the Lanchester approximation to the phugoid, and modify it to suit.

In Sec. 6.3 we saw that with this approximation, there is a vertical “spring stiff­ness” k given by (6.3,3) that governs the period. When the density varies there is a second “stiffness” k’ resulting from the fact that the increased density when the vehi­cle is below its reference altitude increases the lift, and vice versa. This incremental lift associated with a density change is

ДІ = ClV2S Дp

EFFECT OF VERTICAL DENSITY GRADIENT EFFECT OF VERTICAL DENSITY GRADIENT

so that

Using (6.5,3) we get

Подпись: (6.5,6)k’ = kW

Thus we find that k’ is approximately constant, whereas k from (6.3,3) depends on CWoP, which varies as V~2 for constant weight. The density gradient therefore has its greatest relative effect at high speed. The correction factor for the period, which varies inversely as the square root of the stiffness, is

Подпись: (6.5,7)k y/2 1

k + k’j ~ (1 + k’/k)U2

so that the period, when there is a density gradient, is T’ = FT. With the given values of k and k’ this becomes

1

F = / kMq i/2 (6.5,8)

V 2SI

in which the principal variable is seen to be the speed. Using a representative value for к of 4.2 X 1СГ5 (6.5,8) gives a reduction in the phugoid period of 18% for the ex­ample airplane at 774 fps. This is seen to be a very substantial effect. If the full sys-

EFFECT OF VERTICAL DENSITY GRADIENT

Figure 6.7 Variation of period and damping of phugoid mode with static margin.

tern model (6.5,1) is used, comparable effects can be found on the damping of the phugoid as well.

Effect of Flight Condition on the Longitudinal Modes of a Subsonic Jet Transport

In Sec. 6.2 we gave the representative characteristic modes of a subsonic jet airplane for a single set of parameters. It is of considerable interest to enquire into how these characteristics are affected by changes in the major flight variables—speed, altitude, angle of climb, and stability margin. It is also of interest to look into the effect of the vertical density gradient in the atmosphere. In this section and by means of exercises we examine some of these effects.

EFFECT OF SPEED AND ALTITUDE

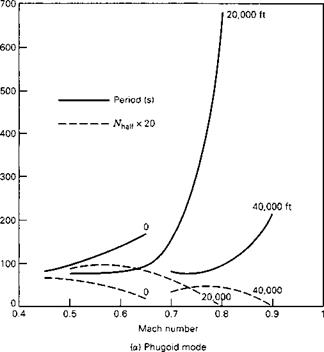
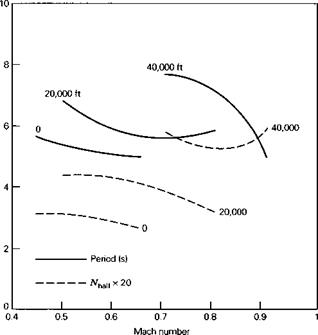
The data in Heffley and Jewel (1972) for the example airplane include several com­parable cases, all having the same geometry, static margin, and gross weight. There are two speeds at sea-level, and three each at 20,000- and 40,000-ft altitudes. The modal periods and damping for these eight cases are displayed in Fig. 6.5. (Since there are so few points, the shapes of the curves are conjectural!) It is an understate­ment to say that there is no simple pattern to these data. It can be said, however, that the phugoid period increases with speed, as predicted by the Lanchester theory, and decreases with altitude at fixed Mach number. The short-period does the opposite, de­creasing with speed and increasing with altitude.

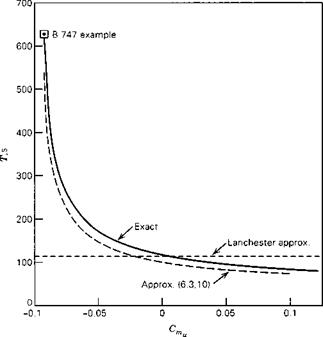
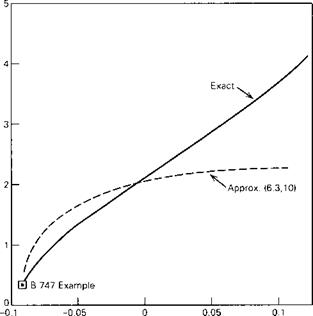
The most striking feature of the data is the sudden and large increase in the phugoid period at high Mach number at the two higher altitudes. This phenomenon is a result of a loss of true static stability at these Mach numbers brought about by a negative value of Cmu, which has the effect of reducing E in (6.4,2). This happens be­cause this large aircraft is necessarily quite flexible, and because at these Mach num­bers it is entering the transonic regime, where air compressibility leads to substantial alterations in the aerodynamic pressure distribution. To show that Cmu is the reason for the behavior of the graphs, we vary it over a large range for the flight condition M = 0.8 and 20,000-ft altitude. Figure 6.6 shows the result and substantiates the impor­tant role of this derivative. In fact, from (6.4,4) we calculate that E = 0 when Cmu = -0.0968, a value only 4% more negative than that of the example at the given flight

Effect of Flight Condition on the Longitudinal Modes of a Subsonic Jet Transport

Effect of Flight Condition on the Longitudinal Modes of a Subsonic Jet Transport

(6) Short-period mode

Figure 6.5 Variation of longitudinal modes with speed and altitude. (a) Phugoid mode. (b) Short – period mode.

Effect of Flight Condition on the Longitudinal Modes of a Subsonic Jet Transport

Effect of Flight Condition on the Longitudinal Modes of a Subsonic Jet Transport

(a) Period


(6) Damping

Figure 6.6 Effect of Cmu on the phugoid mode, (a) Period. (b) Damping.


Effect of Flight Condition on the Longitudinal Modes of a Subsonic Jet Transport

condition. Thus at this point the airplane would be very close to the static stability boundary, at which the period would go asymptotically to

General Theory of Static Longitudinal Stability

In Chap. 2 we used positive pitch stiffness (negative CmJ as an approximate criterion for static longitudinal stability. Now static instability really means the presence of a real positive root of the characteristic equation, and we saw in Sec. 6.1 that the condi­tion for no such root to occur is that the coefficient E of the stability quartic must be positive. Thus the boundary between static stability and instability is defined by E = 0. We get E by putting A = 0 in the characteristic determinant. Thus

£ = det A (6.4,1)

In evaluating (6.4,1) for the matrix of (4.9,18) we put в0 = 0, and as in Sec. 6.3, we neglect the two derivatives Z,;. and Zq. The result is

E = – y (ZUMW – M Zw) (6.4,2)

mly

Since g, m and Iy are all positive, the criterion for static stability is

ZUMW – MUZW > 0. (6.4,3)

When converted to nondimensional form, this becomes

Cma(CZu – 2CWo) – CmCZa > 0 (6.4,4)

When there are no speed effects, that is, CZu and Cmu are both zero, then the criterion does indeed reduce to the simple Cm<x < 0.

We now compare the above criterion for stability with the trim slope (2.4,24). In making this comparison, we must take note of a minor difference in basic assump­tions. In the preceding development, it was specifically assumed that the thrust vector rotates with the vehicle when a is changed [see (5.1,1)]. In the development leading

to (2.4,24) by contrast, there is an implicit assumption that the thrust provides no component of force perpendicular to V [see (2.4,18)]. It is this difference that leads to the presence of CZa in (6.4,4) instead of CLa in (2.4,24). Had the assumptions been the same, the expressions would be strictly compatible. In any case, CDo is usually small compared to CLa, so that the difference is not important, see Table 5.1. We see that the justification for the statement made in Sec. 2.4, that the slope of the elevator trim curve (dSettim/dV)Sp is a criterion of static stability, is provided by (6.4,4). [Note that CWo = (6.4,4).]

Another stability criterion referred to in Chap. 2 is the derivative dCJdCL (2.3,8). It was pointed out there that this derivative can only be said to exist if enough constraints are imposed on the independent variables a, V, Se, q, etc., on which Cm and CL separately depend. Such a situation results if we postulate that the vehicle is in rectilinear motion (q = 0) at constant elevator angle and throttle setting, with L = W, but with varying speed and angle of attack. Such a condition cannot, of course, actually occur in flight because the pitching moment could be zero at only one speed, but it can readily be simulated in a wind tunnel where the model is restrained by a balance. With the above stipulations, Cm and C, reduce to functions of the two vari­ables u and a, and incremental changes from a reference state ( )0 are given by

Подпись: (6.4,5)dC, = C, da + C, dii dCm = Cma da + Cmu da

Подпись: dCm dCL General Theory of Static Longitudinal Stability Подпись: (6.4,6)

The required derivative is then

provided dd/da exists. This is guaranteed by the remaining condition imposed, that is, L = W (implying aT = 0). For then we have

W = CL{a, ii)pV2S = const

from which we readily derive

(CLa da + CLu du)hpulS + CLiipu0S du = 0 (6.4,7)

From (6.4,7)

(CLu + 2CLo) da + CLa da = 0

Подпись: (6.4,8)da c,

___ __ c-a____

da CLu + 2CLo

Подпись: dCm dCL Подпись: L=W Подпись: 2 CLoCLa Подпись: [Cm(CLu + 2C, - C, Cml Подпись: (6.4,9)

After substituting (6.4,8) into (6.4,6) and simplifying we get

On comparing (6.4,9) with (6.4,4), with the same caveats as for the trim slope, we see that the static stability criterion is
provided that dCJdCL is calculated with the constraints A8e = A8p = q = 0 and L = W. [The quantity on the left side of (6.4,9) is sometimes referred to as speed stability in the USA, by contrast with “angle of attack” stability. In Great Britain, this term usually has a different meaning, as in Sec. 8.5.]

On using the definition of hs given in (2.4,26) we find from (6.4,9) that

General Theory of Static Longitudinal Stability

General Theory of Static Longitudinal Stability
Подпись: < 0 Подпись: (6.4Д0)

(6.4,11)

that is, that it is proportional to the “stability margin,” and when CLu < 2CL:, is equal to it.

6.3 Approximate Equations for the Longitudinal Modes 173

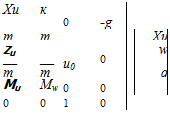
elegant result is not only of historical interest—it actually gives a reasonable approxi­mation to the phugoid period of rigid airplanes at speeds below the onset of signifi­cant compressibility effects. Thus for the B747 example, the Lanchester approxima­tion gives T = 107s, a value not very far from the true 93s. It is possible to get an even better approximation, one that gives an estimate of the damping as well. Be­cause q is approximately zero in this mode, we can infer that the pitching moment is approximately zero—that the airplane is in quasistatic pitch equilibrium during the motion. Moreover the pitching moment can reasonably be simplified in these circum­stances by keeping only the first two terms on the right side of (4.9,17e). Because q and w are both relatively small we further neglect Zq and as well. On making these simplifications to (4.9,18) and setting Af, = 0 and 6() = 0 we get the reduced system of equations:

Подпись: Xu к 0 -g m m Xu zu 0 w — — u0 m m q Mu Mw 0 0 0 0 1 0 Подпись: (6.3,6)An

w

0

Afl

These equations are not in the canonical form x = Ax, but we can still get the charac­teristic equation by substituting x = x0eA’ and factoring out the exponential. The re­sult is

(Xu/m – A)

XJm

0

-g

ZJm

{ZJm – A)

n0

0

Mu

Mw

0

0

0

0

1

-A

Equation (6.3,7) expands to

АЛ2 + ВЛ + С = 0

or A2 + 2£w„A + w2n = 0 (6.3,8) which is a convenient way to write the characteristic equation of a second-order sys­tem. The constants are

A = ~u0Mw

Подпись:В — gMu H {XUMW – MUXJ
m

c = – (zuMw – MUZJ m

from which we derive the radian frequency and damping to be

Подпись: Z„ -

6.3 Approximate Equations for the Longitudinal Modes 173 Подпись: -1/2 Подпись: g Mu It Mu — — + — xu -XM Uo Mw m  " Mw 11 Подпись: (6.3,10)

M, z

Table 4.4 with CZa = 0 is substituted into (6.3,12) we find (see Exer­cise 6.1) that Г„ = 1тгІ(оп is exactly the Lanchester period (6.3,5). Moreover if we make the further assumption that the airplane is a jet with constant thrust (dT/du0 = 0) we find the damping ratio to be that is, it is simply the inverse of the L/D ratio of the airplane. In fact the approxima­tion for the period is good over the whole range of Cmu, whereas that for the damping is poor for large positive Cmu. For the example airplane the above approximation gives t, = 0.066, compared with the exact value 0.049.

SHORT-PERIOD MODE

Figure 6.3b shows that the short-period mode is essentially one with two degrees of freedom, the speed being substantially constant while the airplane pitches relatively rapidly. We can therefore arrive at approximate system equations by neglecting the X-force equation entirely and putting Ди = 0. Examination of the magnitudes of the terms in the numerical example shows that is small compared to m and Zq is small compared to mu0. The result after simplifying (4.9,18) with в0 = 0 is a pair of equa­tions for w and q.

Подпись: 1
6.3 Approximate Equations for the Longitudinal Modes 173 6.3 Approximate Equations for the Longitudinal Modes 173

The characteristic equation of (6.3,13) is found to be

When converted with the aid of Tables 4.1 and 4.4, (6.3,14) becomes

A2 + BA + C = 0 (a)

В =——

t*

r*2/’

Подпись: c = 6.3 Approximate Equations for the Longitudinal Modes 173 Подпись: (b) (6.3,15) (c)

where

When the data for the B747 is substituted into (6.3,15) the result obtained is

A2 + 0.741A + 0.9281 = 0 with roots A = —0.371 ± 0.889

which are seen to be almost the same as those in (6.2,3) obtained from the complete matrix equation. The short-period approximation is actually very good for a wide range of vehicle characteristics and flight conditions.

Approximate Equations for the Longitudinal Modes

The numerical solutions for the modes, although they certainly show their properties, do not give much physical insight into their genesis. Now each oscillatory mode is equivalent to some second-order mass-spring-damper system, and each nonoscilla­tory mode is equivalent to some mass-damper system. To understand the modes, and the influence on them of the main flight and vehicle parameters, it is helpful to know what contributes to the equivalent masses, springs, and dampers. To achieve this re­quires analytical solutions, which are simply not available for the full system of equations. Hence we are interested in getting approximate analytical solutions, if they can reasonably represent the modes. Additionally, approximate models of the in­dividual modes are frequently useful in the design of automatic flight control systems (McRuer et al., 1973). In the following we present some such approximations and the methods of arriving at them.

There are two approaches generally used to arrive at these approximations. One is to write out a literal expression for the characteristic equation and, by studying the order of magnitude of the terms in it, to arrive at approximate linear or quadratic fac­tors. For example, if the characteristic equation (6.1,13) is known to have a “small” real root, an approximation to it may be obtained by neglecting all the higher powers of A, that is,

DA + E = 0

Or if there is a “large” complex root, it may be approximated by keeping only the first three terms, that is,

AA2 + BA + C = 0

This method is frequently useful, and is sometimes the only reasonable way to get an approximation.

The second method, which has the advantage of providing more physical insight, proceeds from a foreknowledge of the modal characteristics to arrive at approximate system equations of lower order than the exact ones. For the longitudinal modes we use the second method (see below), and for the lateral modes (see Sec. 6.8) both methods are needed.

It should be noted that no simple analytical approximations can be relied on to give accurate results under all circumstances. Machine solutions of the exact matrix is the only certain way. The value of the approximations is indicated by examples in the following.

To proceed now to the phugoid and short-period modes, we saw in Fig. 6.3 that some state variables are negligibly small in each of the two modes. This fact suggests
certain approximations to them based on reduced sets of equations of motion arrived at by physical reasoning. These approximations, which are quite useful, are devel­oped below.

PHUGOID MODE

Lanchester’s original solution (Lanchester, 1908) for the phugoid used the assump­tions that aT = 0, Дa = 0 and T — D = 0 (see Fig. 2.1). It follows that there is no net aerodynamic force tangent to the flight path, and hence no work done on the vehicle except by gravity. The motion is then one of constant total energy, as suggested previ­ously. This simplification makes it possible to treat the most general case with large disturbances in speed and flight-path angle (see Miele, 1962, p. 271 et seq.) Here we content ourselves with a treatment of only the corresponding small-disturbance case, for comparison with the exact numerical result given earlier. The energy condition is

E = mV2 — mgzE = const

or V2 = ul + 2 gzE (6.3,1)

where the origin of FE is so chosen that V = u0 when zE = 0. With a constant, and in addition neglecting the effect of q on CL, then C, is constant at the value for steady horizontal flight, that is, CL = CLo = CWo, and L = CWohpV2S or, in view of (6.3,1),

L — C w(t2pu ()S + (CWopgS)zE = W + kzE (6.3,2)

Thus the lift is seen to vary linearly with the height in such a manner as always to drive the vehicle back to its reference height, the “spring constant” being

к = CWopgS (6.3,3)

The equation of motion in the vertical direction is clearly, when T — D = 0, and у = angle of climb (see Fig. 2.1)

W — L cos у = miE

or for small y,

Подпись: (6.3,4)W — L = m zE

On combining (6.3,2) and (6.3,4) we get

Approximate Equations for the Longitudinal Modes

mzE + kzE = 0

Since CWo = mg/lpu^S, this becomes

T= тЛ/2 — = 0.138uo (6.3,5)

8

when u0 is in fps, a beautifully simple result, suggesting that the phugoid period de­pends only on the speed of flight, and not at all on the airplane or the altitude! This

FLIGHT PATHS IN THE CHARACTERISTIC MODES

Additional insight into the modes is gained by studying the flight path. With the at­mosphere at rest, the differential equations for the position of the CG in FE are given by (4.9,10), with 0o = 0, that is,

Подпись: (6.2,4)Axe = A и A zE = ~uo0 + w

In a characteristic oscillatory mode with eigenvalues A, A*, the variations of Au, 0, and w are [cf. (6.1,8)]

Au = uXjekt + u*jeK ‘

w = u2jeM + u*je* ‘ (6.2,5)

0 = u4jex‘ + u*4jeK ‘

where the constants utj are the components of the eigenvector corresponding to A. For the previous numerical example, they are the complex numbers given in polar form in Table 6.4. After substituting (6.2,5) in (6.2,4) and integrating from t = 0 to t we get

$

U1 у U : *

XE — u0t H—– – eXt Л—– – ex 1 + const

E 0 A A*

eia*

Подпись:Подпись: + constFLIGHT PATHS IN THE CHARACTERISTIC MODESПодпись: + const

Подпись: U2j U0U4J
Подпись: zE = 2eM Re
Подпись: A

(6.2,6)

FLIGHT PATHS IN THE CHARACTERISTIC MODES

Figure 6.3

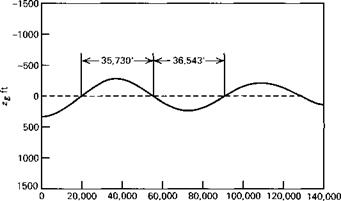
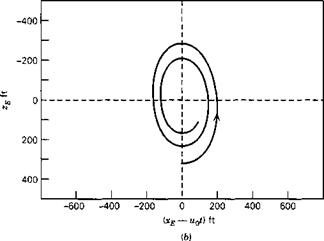
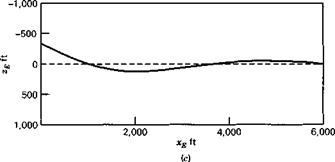
where Re denotes the real part of the complex number in the square brackets. For the numerical data of the above example (6.2,6) has been used to calculate the flight paths in the two modes, plotted in Fig. 6.4. The nonzero initial conditions are arbi­trary, and the trajectories for both modes asymptote to the steady reference flight path. Figure 6.4 shows that the phugoid is an undulating flight of very long wave­length. The mode diagram, Fig. 6.3a shows that the speed leads the pitch angle by about 90°, from which we can infer that и is largest near the bottom of the wave and least near the top. This variation in speed results in different distances being traversed

FLIGHT PATHS IN THE CHARACTERISTIC MODES

xE ft (a)

FLIGHT PATHS IN THE CHARACTERISTIC MODES

FLIGHT PATHS IN THE CHARACTERISTIC MODES

Figure 6.4 (a) Phugoid flight path (fixed reference frame), (b) Phugoid flight path (moving reference frame), (c) Short-period flight path.

during the upper and lower halves of the cycle, as shown in Fig. 6.4a. For larger am­plitude oscillations, this lack of symmetry in the oscillation becomes much more pro­nounced (although the linear theory then fails to describe it accurately) until ulti­mately the upper part becomes first a cusp and then a loop (see Miele, 1962, p. 273). The motion (see Sec. 6.3) is approximately one of constant total energy, the rising and falling corresponding to an exchange between kinetic and potential energy. Fig­ure 6Ab shows the phugoid motion relative to axes moving at the reference speed u0. This is the relative path that would be seen by an observer flying alongside at speed Mo-

Figure 6.4c shows the path for the short-period mode. The disturbance is rapidly damped. The transient has virtually disappeared within 3000 ft of flight, even though the initial Да and Ав were very large. The deviation of the path from a straight line is small, the principal feature of the motion being the rapid rotation in pitch.

EIGENVECTORS

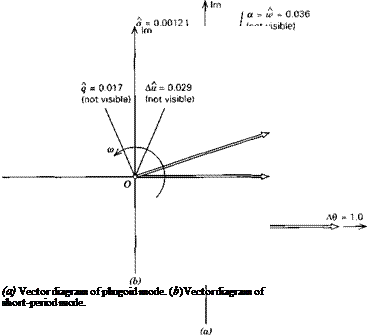
The eigenvectors corresponding to the above modes are given in Table 6.4. They are for the nondimensionable variables, in polar form, the values given corresponding to n + і со. Eigenvectors are arbitrary to within a complex factor, so it is only the relative values of the state variables that are significant. We have therefore factored them to

EIGENVECTORS

EIGENVECTORS

(6)

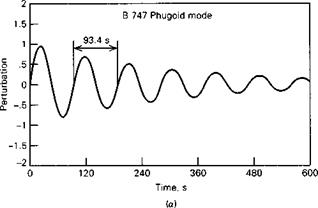
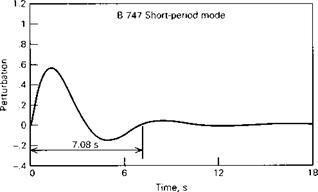
Figure 6.2 Characteristic transients, (a) Phugoid mode, (b) Short-period (pitching) mode.

EIGENVECTORS

make AO equal to unity, as displayed in the Argand diagram of Fig. 6.3. As we have chosen the positive value of o>, the diagrams can be imagined to be rotating counter­clockwise and shrinking, with their projections on the real axis being the real values of the variables.

The phugoid is seen to be a motion in which the pitch rate q and the angle of at­tack change a are very small, but Ай and AO are present with significant magnitude. The speed leads Д 0 by about 90° in phase.

The short-period mode, by contrast, is one in which there is negligible speed variation, while the angle of attack oscillates with an amplitude and phase not much different from that of AO. This mode behaves like one with only two degrees of free­dom, AO and a.

Longitudinal Modes of a Jet Transport

The foregoing theory is now illustrated by applying it to the Boeing 747 transport. The needed geometrical and aerodynamic data for this airplane are given in Appendix E. The flight condition for this example is cruising in horizontal flight at approxi­mately 40,000 ft at Mach number 0.8. Relevant data are as follows:

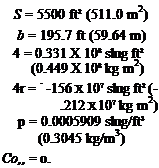
Подпись: S = 5500 ft2 (511.0 m2) b = 195.7 ft (59.64 m) 4 = 0.331 X 10⁸ slug ft2 (0.449 X 10⁸ kg m2) 4r = - -156 X 107 slug ft2 (-.212 X 107 kg m2) p = 0.0005909 slug/ft3 (0.3045 kg/m3) Co,, = o. W = 636,636 lb (2.83176 X 10⁶ N) c = 27.31 ft (8.324 m)

4 = 0.183 X 10⁸ slug ft2 (0.247 X 10⁸ kg m2) /z = 0.497 X 10⁸ slug ft2 (0.673 X 10⁸ kg m2) u0 = 11A fps (235.9 m/s) 0O = 0 CU) = 0.654

The preceding four inertias are for stability axes at the stated flight condition. In the numerical examples of this and the following two chapters, the system matrices and the solutions are all given in English units. The nondimensional stability derivatives

Подпись: Table 6.1 Nondimensional Derivatives—B747 Airplane Cx cz cm u -0.1080 -0.1060 0.1043 a 0.2193 -4.920 -1.023 я 0 -5.921 -23.92 a 0 5.896 -6.314

are given in Table 6.1, and the dimensional derivatives in Table 6.2. With the above data we calculate the system matrix A for this case. (Recall that the state vector is [Ли w q Д0]7). r

Подпись: -0.006868 0.01395 0 -32.2 -0.09055 -0.3151 773.98 0 0.0001187 -0.001026 -0.4285 0 0 0 1 0 The characteristic equation (6.1,6) is next calculated to be:

A4 + 0.750468A3 + 0.935494A2 + 0.0094630A + 0.0041959 = 0 (6.2,2)

The two stability criteria are

E = 0.0041959 > 0 and R = 0.004191 > 0

so that there are no unstable modes.

EIGENVALUES

The roots of the characteristic equation (6.2,2), the eigenvalues, are Mode 1 (Phugoid mode): 2 = —0.003289 ± 0.06723г

Mode 2 (Short-period mode): A34 =—0.3719 ± 0.8875/ ^

We see that the natural modes are two damped oscillations, one of long period and lightly damped, the other of short period and heavily damped. This result is quite typ-

Table 6.2

Dimensional Derivatives—B747 Airplane

X(lb)

Z(lb)

M(ft-lb)

M(ft/s)

-1.358 X 10²

-1.778 X 10³

3.581 X 10³

w(ft/s)

2.758 X 10²

-6.188 X 10³

-3.515 X 10⁴

<7(rad/s)

0

-1.017 X 10⁵

-1.122 X 10⁷

vv(ft/s2)

0

1.308 X 10²

-3.826 X 10³

ад

Z(N)

M(m-N)

u(m/s)

-1.982 X 10³

-2.595 X 10⁴

1.593 X 10⁴

w( m/s)

4.025 X 10³

-9.030 X 10⁴

-1.563 X 10⁴

</(rad/s)

0

-4.524 X 10⁵

-1.521 X 10⁷

vv(m/s2)

0

1.909 X 10³

-1.702 X 10⁴

Table 6.3

Period

half

Nhalf

Mode

Name

(s)

(s)

(cycles)

1

Phugoid"

93.4

211

22.5

2

Short-period

7.08

1.86

0.26

"The phugoid mode was first described by Lanchester (1908), who also named it. The name comes from the Greek root for flee as in fugitive. Actually Lanchester wanted the root for fly. Appropriate or not, the word phugoid has become established in aeronautical jargon.

ical. The modes are conventionally named as in Table 6.3, which also gives their peri­ods and damping. The transient behavior of the state variables in these two modes is displayed in Fig. 6.2.