|
In several of our previous discussions, we made use of the concept of a fluid element moving through the flow field. In this section, we examine this motion more closely, paying particular attention to the orientation of the element and its change in shape as it moves along a streamline. In the process, we introduce the concept of vorticity, one of the most powerful quantities in theoretical aerodynamics.
Consider an infinitesimal fluid element moving in a flow field. As it translates along a streamline, it may also rotate, and in addition its shape may become distorted as sketched in Figure 2.30. The amount of rotation and distortion depends on the velocity field; the purpose of this section is to quantify this dependency.
|
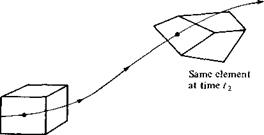
Element at time 11
Figure 2.30 The motion of a fluid element along a
|
|
streamline is a combination of translation and rotation; in addition, the shape of the element can become distorted.
Consider a two-dimensional flow in the xy plane. Also, consider an infinitesimal fluid element in this flow. Assume that at time t the shape of this fluid element is rectangular, as shown at the left of Figure 2.31. Assume that the fluid element is moving upward and to the right; its position and shape at time t + At are shown at the right in Figure 2.31. Note that during the time increment At, the sides AB and AC have rotated through the angular displacements — Дві and Аві, respectively. (Counterclockwise rotations by convention are considered positive; since line A В is shown with a clockwise rotation in Figure 2.31, the angular displacement is negative, — Дві.) At present, consider just the line AC. It has rotated because during the time increment At, point C has moved differently from point A. Consider the velocity in the у direction. At point A at time t, this velocity is v, as shown in Figure 2.31. Point C is a distance dx from point A; hence, at time t the vertical component of velocity of point C is given by v + (dv/dx) dx. Hence,
Distance in у direction that A moves
= vAt
during time increment At

Distance in у direction that C moves
This net displacement is shown at the right of Figure 2.31. From the geometry of Figure 2.31,
  [2.119] [2.119]
|
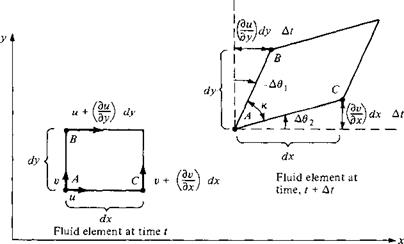
Figure 2.31 Rotation and distortion of a fluid element.
|
|
Since A92 is a small angle, tan A92 ~ A92. Hence, Equation (2.119) reduces to
Now consider line AB. The x component of the velocity at point A at time t is u, as shown in Figure 2.31. Because point В is a distance dy from point A, the horizontal component of velocity of point В at time t is и + (du/dy)dy. By reasoning similar to that above, the net displacement in the x direction of В relative to A over the time increment At is [(du/dy) dy] At, as shown in Figure 2.31. Hence,
 |
|
|
|
|
|
|
|
Consider the angular velocities of lines AB and AC, defined as d9/dt and d92/dt, respectively. From Equation (2.122), we have
|
|
|
d9 j. A9 du dt At—>o At dy
From Equation (2.120), we have
d92 A92 dv
dt Ar->o At dx
|
|
|
|
|
|
By definition, the angular velocity of the fluid element as seen in the xy plane is the average of the angular velocities of lines AB and AC. Let a>z denote this angular velocity. Therefore, by definition,
Combining Equations (2.123) to (2.125) yields
1  /Эи Эи /Эи Эи
z 2 Эх ду
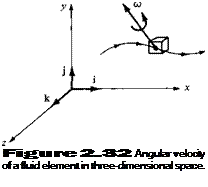
In the above discussion, we have considered motion in the xy plane only. However, the fluid element is generally moving in three-dimensional space, and its angular velocity is a vector ш that is oriented in some general direction, as shown in Figure 2.32. In Equation (2.126), we have obtained only the component of ш in the z direction; this explains the subscript z in Equations (2.125) and (2.126). The x and у components of <о can be obtained in a similar fashion. The resulting angular velocity of the fluid element in three-dimensional space is
Equation (2.127) is the desired result; it expresses the angular velocity of the fluid element in terms of the velocity field, or more precisely, in terms of derivatives of the velocity field.
The angular velocity of a fluid element plays an important role in theoretical aerodynamics, as we shall soon see. However, the expression 2со appears frequently, and therefore we define a new quantity, vorticity, which is simply twice the angular velocity. Denote vorticity by the vector |:
£ = 2<u
Hence, from Equation (2.127),
Recall Equation (2.22) for V x V in cartesian coordinates. Since u, v, and w denote the x, y, and z components of velocity, respectively, note that the right sides of Equations (2.22) and (2.128) are identical. Hence, we have the important result that
 [2.129] [2.129]
In a velocity field, the curl of the velocity is equal to the vorticity.
The above leads to two important definitions:
1. If V x V ф 0 at every point in a flow, the flow is called rotational. This implies that the fluid elements have a finite angular velocity.
2. If V x V = 0 at every point in a flow, the flow is called irrotational. This implies that the fluid elements have no angular velocity; rather, their motion through space is a pure translation.
The case of rotational flow is illustrated in Figure 2.33. Here, fluid elements moving along two different streamlines are shown in various modes of rotation. In contrast, the case of irrotational flow is illustrated in Figure 2.34. Here, the upper streamline shows a fluid element where the angular velocities of its sides are zero. The lower streamline shows a fluid element where the angular velocities of two intersecting sides are finite but equal and opposite to each other, and so their sum is identically zero. In both cases, the angular velocity of the fluid element is zero; i. e., the flow is irrotational.
If the flow is two-dimensional (say, in the xy plane), then from Equation (2.128),
  [2.130] [2.130]

|
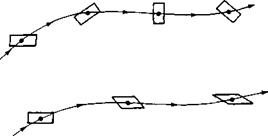
Figure 2.33 Fluid elements in a rotational flow.
|
|
|
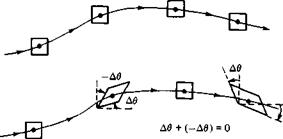
Figure 2.34 Fluid elements in an irrotational flow.
|
|
Also, if the flow is irrotational, £ = 0. Hence, from Equation (2.130),
![Angular Velocity, Vorticity, and Strain Подпись: [2.131]](/img/3128/image331.gif) dv 3 и dx dy dv 3 и dx dy
Equation (2.131) is the condition of irrotationality for two-dimensional flow. We will have frequent occasion to use Equation (2.131).
Why is it so important to make a distinction between rotational and irrotational flows? The answer becomes blatantly obvious as we progress in our study of aerodynamics; we find that irrotational flows are much easier to analyze than rotational flows. However, irrotational flow may at first glance appear to be so special that its applications are limited. Amazingly enough, such is not the case. There are a large number of practical aerodynamic problems where the flow field is essentially irrotational, e. g., the subsonic flow over airfoils, the supersonic flow over slender bodies at small angle of attack, and the subsonic-supersonic flow through nozzles. For such cases, there is generally a thin boundary layer of viscous flow immediately adjacent to the surface; in this viscous region the flow is highly rotational. However, outside this boundary layer, the flow is frequently irrotational. As a result, the study of irrotational flow is an important aspect of aerodynamics.
Return to the fluid element shown in Figure 2.31. Let the angle between sides A В and AC be denoted by к. As the fluid element moves through the flow field, к will change. In Figure 2.31, at time t, к is initially 90°. At time t + At, к has changed by the amount А к, where
![Angular Velocity, Vorticity, and Strain Подпись: [2.132]](/img/3128/image322.gif) А к = – Д02 – (-Д0О А к = – Д02 – (-Д0О
By definition, the strain of the fluid element as seen in the xy plane is the change in к, where positive strain corresponds to a decreasing к. Hence, from Equation (2.132),
Strain = —Лк = Л02 — A#i [2.133]
In viscous flows (to be discussed in Chapters 15 to 20), the time rate of strain is an important quantity. Denote the time rate of strain by єху, where in conjunction with
|
" 3 и
|
du
|
du
|
|
dx
|
dy
|
3z
|
|
dv
|
dv
|
dv
|
|
dx
|
dy
|
dz
|
|
dw
|
dw
|
dw
|
|
_ dx
|
dy
|
~dz
|
The sum of the diagonal terms is simply equal to V • V, which from Section 2.3 is equal to the time rate of change of volume of a fluid element; hence, the diagonal terms represent the dilatation of a fluid element. The off-diagonal terms are cross derivatives which appear in Equations (2.127), (2.128), and (2.135a to c). Hence, the off-diagonal terms are associated with rotation and strain of a fluid element.
In summary, in this section, we have examined the rotation and deformation of a fluid element moving in a flow field. The angular velocity of a fluid element and the corresponding vorticity at a point in the flow are concepts which are useful in the analysis of both inviscid and viscous flows; in particular, the absence of vorticity— irrotational flow—greatly simplifies the analysis of the flow, as we will see. We take advantage of this simplification in much of our treatment of inviscid flows in subsequent chapters. On the other hand, we do not make use of the time rate of strain until we discuss viscous flow, beginning with Chapter 15.
|
|
|
For the velocity field given in Example 2.3, calculate the vorticity. Solution
|
|
 |
|
|
|
|
|
The flow field is irrotational at every point except at the origin, where x2 + y2 = 0.
|
|
|
Consider the boundary-layer velocity profile used in Example 2.2, namely, u/V, x = (y/S)025. Is this flow rotational or irrotational?
Solution
For a two-dimensional flow, the irrotationality condition is given by Equation (2.131), namely
|
|
|
|
|
|
|
Does this relation hold for the viscous boundary-layer flow in Example 2.2? Let us examine this question. From the boundary-layer velocity profile given by
|
|
|
|
 |
|
|
|
|
In Example 2.5, we demonstrated a basic result which holds in general for viscous flows, namely, viscous flows are rotational. This is almost intuitive. For example, consider an infinitesimally small fluid element moving along a streamline, as sketched in Figure 2.35. If this is a viscous flow, and assuming that the velocity increases in the upward direction (i. e., the velocity is higher on the neighboring streamline above and lower on the neighboring streamline below), then the shear stresses on the upper and lower faces of the fluid element will be in the directions shown. Such shear stresses will be discussed at length in Chapter 15. Examining Figure 2.35, we see clearly that the shear stresses exert a rotational moment about the center of the element, thus providing a mechanism for setting the fluid element into rotation. Although this picture is overly simplistic, it serves to emphasize that viscous flows are rotational flows. On the other hand, as stated earlier in this section, there are numerous

|
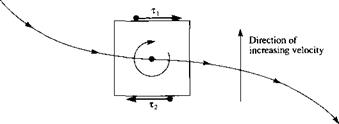
Figure 2.35 Shear stress and the consequent rotation of a fluid element.
|
|
inviscid flow problems that are irrotational, with the attendant simplifications to be explained later. Some inviscid flows are rotational, but there exists such a large number of practical aerodynamic problems described by inviscid, irrotational flows that the distinction between rotational and irrotational flow is an important consideration.
Before discussing the theoretical calculation of airfoil properties, let us examine some typical results. During the 1930s and 1940s, the NACA carried out numerous measurements of the lift, drag, and moment coefficients on the standard NACA airfoils. These experiments were performed at low speeds in a wind tunnel where the constant-chord wing spanned the entire test section from one sidewall to the other. In this fashion, the flow “sees” a wing without wing tips—a so-called infinite wing,
which theoretically stretches to infinity along the span (in the у direction in Figure 4.1). Because the airfoil section is the same at any spanwise location along the infinite wing, the properties of the airfoil and the infinite wing are identical. Hence, airfoil data are frequently called infinite wing data. (In contrast, we see in Chapter 5 that the properties of a finite wing are somewhat different from its airfoil properties.)
The typical variation of lift coefficient with angle of attack for an airfoil is sketched in Figure 4.4. At low-to-moderate angles of attack, с/ varies linearly with a; the slope of this straight line is denoted by ao and is called the lift slope. In this region, the flow moves smoothly over the airfoil and is attached over most of the surface, as shown in the streamline picture at the left of Figure 4.4. However, as a becomes large, the flow tends to separate from the top surface of the airfoil, creating a large wake of relatively “dead air” behind the airfoil as shown at the right of Figure 4.4. Inside this separated region, the flow is recirculating, and part of the flow is actually moving in a direction opposite to the freestream—so-called reversed flow. (Refer also to Figure 1.36.) This separated flow is due to viscous effects and is discussed in Chapter 15. The consequence of this separated flow at high a is a precipitous decrease in lift and a large increase in drag; under such conditions the airfoil is said to be stalled. The maximum value of С/, which occurs just prior to the stall, is denoted by ci, max; it is one of the most important aspects of airfoil performance, because it determines the stalling speed of an airplane. The higher is c/>max, the lower is the stalling speed. A great deal of modem airfoil research has been directed toward increasing c/,max. Again examining Figure 4.4, we see that c; increases linearly with а until flow separation begins to have an effect. Then the curve becomes nonlinear, q reaches a maximum value, and finally the airfoil stalls. At the other extreme of the curve, noting Figure 4.4, the lift at a = 0 is finite; indeed, the lift goes to zero only when the airfoil is pitched to some negative angle of attack. The value of a when lift equals zero is called the zero-lift angle of attack and is denoted by chl=o- For a
|
Stall due to flow separation
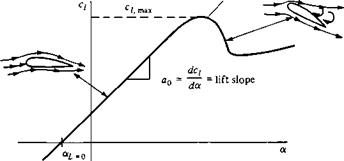
Figure 4.4 Schematic of lift-coefficient variation with angle of attack for an airfoil.
|
|
symmetric airfoil, aL=0 — 0, whereas for all airfoils with positive camber (camber above the chord line), aL=0 is a negative value, usually on the order of —2 or —3°.
The inviscid flow airfoil theory discussed in this chapter allows us to predict the lift slope ao and aL=0 for a given airfoil. It does not allow us to calculate c/.max, which is a difficult viscous flow problem, to be discussed in Chapters 15 to 20.
Experimental results for lift and moment coefficients for the NACA 2412 airfoil are given in Figure 4.5. Here, the moment coefficient is taken about the quarter-chord point. Recall from Section 1.6 that the force-and-moment system on an airfoil can be transferred to any convenient point; however, the quarter-chord point is commonly used. (Refresh your mind on this concept by reviewing Section 1.6, especially Figure 1.19.) Also shown in Figure 4.5 are theoretical results to be discussed later. Note that the experimental data are given for two different Reynolds numbers. The lift slope ao is not influenced by Re; however, c/,max is dependent upon Re. This makes sense, because c/,max is governed by viscous effects, and Re is a similarity parameter that governs the strength of inertia forces relative to viscous forces in the flow. [See
|
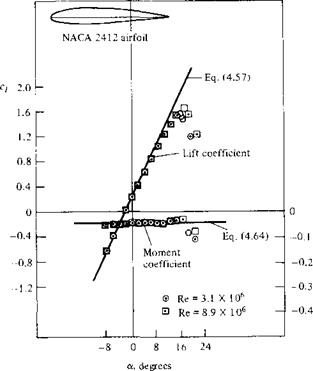
Figure 4.5 Experimental data for lift coefficient and moment
coefficient about the quarter-chord point for an NACA 2412 airfoil. (Source: Data obtained from Abbott and von Doenhoff, Reference 1 1.) Also shown is a comparison with theory described in Section 4.8.
|
Section 1.7 and Equation (1.35).] The moment coefficient is also insensitive to Re except at large a. The NACA 2412 airfoil is a commonly used airfoil, and the results given in Figure 4.5 are quite typical of airfoil characteristics. For example, note from Figure 4.5 that (Xl=о = —2.1°, c/ max ~ 1 -6, and the stall occurs at a ~ 16°.
This chapter deals with airfoil theory for an inviscid, incompressible flow; such theory is incapable of predicting airfoil drag, as noted earlier. However, for the sake of completeness, experimental data for the drag coefficient cd for the NACA 2412 airfoil are given in Figure 4.6 as a function of the angle of attack.[14] The physical source of this drag coefficient is both skin friction drag and pressure drag due to flow separation (so-called form drag). The sum of these two effects yields the profile drag coefficient cd for the airfoil, which is plotted in Figure 4.6. Note that cd is sensitive to Re, which is to be expected since both skin friction and flow separation are viscous effects. Again, we must wait until Chapters 15 to 20 to obtain some tools for theoretically predicting cd.
The importance of thermodynamics in the analysis and understanding of compressible flow was underscored in Section 7.1. Hence, the purpose of the present section is to review those aspects of thermodynamics that are important to compressible flows. This is in no way indended to be an exhaustive discussion of thermodynamics; rather, it is a review of only those fundamental ideas and equations that will be of direct use in subsequent chapters. If you have studied thermodynamics, this review should serve as a ready reminder of some important relations. If you are not familiar with thermodynamics, this section is somewhat self-contained so as to give you a feeling for the fundamental ideas and equations that we use frequently in subsequent chapters.
7.2.1 Perfect Gas
As described in Section 1.2, a gas is a collection of particles (molecules, atoms, ions, electrons, etc.) which are in more or less random motion. Due to the electronic structure of these particles, a force field pervades the space around them. The force field due to one particle reaches out and interacts with neighboring particles, and vice versa. Hence, these fields are called intermolecular forces. However, if the particles of the gas are far enough apart, the influence of the intermolecular forces is small and can be neglected. A gas in which the intermolecular forces are neglected is defined as a perfect gas. For a perfect gas, p, p, and T are related through the following equation of state:
 [7.1] [7.1]
where R is the specific gas constant, which is a different value for different gases. For air at standard conditions, R = 287 J/(kg • K) = 1716 (ft • lb)/(slug • °R).
At the temperatures and pressures characteristic of many compressible flow applications, the gas particles are, on the average, more than 10 molecular diameters apart; this is far enough to justify the assumption of a perfect gas. Therefore, throughout the remainder of this book, we use the equation of state in the form of Equation (7.1), or its counterpart,
 [7.2] [7.2]
where v is the specific volume, that is, the volume per unit mass; v — 1/p. (Please note: Starting with this chapter, we use the symbol v to denote both specific volume and the у component of velocity. This usage is standard, and in all cases it should be obvious and cause no confusion.)
There is so great a difference between a fluid and a collection of solid particles that the laws of pressure’ and of equilibrium of fluids are very different from the laws of the pressure and equilibrium of solids.
Jean Le Rond d’Alembert, 1768
The principle is most important, not the detail.
Theodore von Karman, 1954
2.1 Introduction and Road Map
To be a good craftsperson, one must have good tools and know how to use them effectively. Similarly, a good aerodynamicist must have good aerodynamic tools and must know how to use them for a variety of applications. The purpose of this chapter is “tool-building”; we develop some of the concepts and equations that are vital to the study of aerodynamic flows. However, please be cautioned; A craftsperson usually derives his or her pleasure from the works of art created with the use of the tools; the actual building of the tools themselves is sometimes considered a mundane chore. You may derive a similar feeling here. As we proceed to build our aerodynamic tools, you may wonder from time to time why such tools are necessary and what possible value they may have in the solution of practical problems. Rest assured, however, that every aerodynamic tool we develop in this and subsequent chapters is important for the analysis and understanding of practical problems to be discussed later. So, as
we move through this chapter, do not get lost or disoriented; rather, as we develop each tool, simply put it away in the store box of your mind for future use.
To help you keep track of our tool building, and to give you some orientation, the road map in Figure 2.1 is provided for your reference. As we progress through each section of this chapter, use Figure 2.1 to help you maintain a perspective of our work. You will note that Figure 2.1 is full of strange-sounding terms, such as “substantial derivative,” “circulation,” and “velocity potential.” However, when you finish this chapter, and look back at Figure 2.1, all these terms will be second nature to you.
|
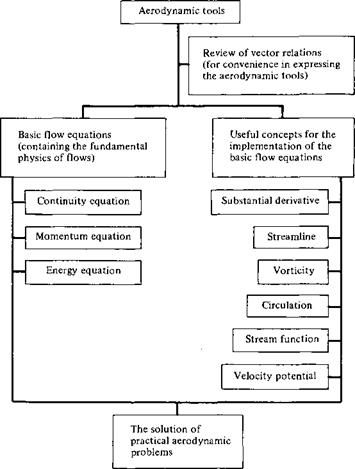
Figure 2.1 Road map for Chapter 2.
|
Consider the flow through a duct, such as that sketched in Figure 3.5. In general, the duct will be a three-dimensional shape, such as a tube with elliptical or rectangular cross sections which vary in area from one location to another. The flow through such a duct is three-dimensional and, strictly speaking, should be analyzed by means of the full three-dimensional conservation equations derived in Chapter 2. However, in many applications, the variation of area A = A(x) is moderate, and for such cases it is reasonable to assume that the flow-field properties are uniform across any cross section, and hence vary only in the x direction. In Figure 3.5, uniform flow is sketched at station 1, and another but different uniform flow is shown at station 2. Such flow, where the area changes as a function of x and all the flow-field variables are assumed to be functions of x only, that is, A = A(x), V — V(x), p = p(x), etc., is called quasi-one-dimensional flow. Although such flow is only an approximation of the truly three-dimensional flow in ducts, the results are sufficiently accurate for many aerodynamic applications. Such quasi-one-dimensional flow calculations are frequently used in engineering. They are the subject of this section.
® ©
|
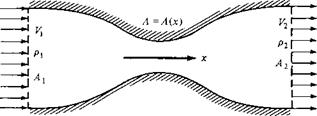
Figure 3.5 Quasi-one-dimensional flow in a duct.
|
Consider the integral form of the continuity equation written below:


For steady flow, this becomes
Apply Equation (3.16) to the duct shown in Figure 3.5, where the control volume is bounded by At on the left, A2 on the right, and the upper and lower walls of the duct. Hence, Equation (3.16) is
Along the walls, the flow velocity is tangent to the wall. Since by definition dS is perpendicular to the wall, then along the wall, V • dS = 0, and the integral over the wall surface is zero; that is, in Equation (3.17),
JJ pY • dS = 0 [3.18]
wall
At station 1, the flow is uniform across A. Noting that dS and V are in opposite directions at station 1 (dS always points out of the control volume by definition), we have in Equation (3.17)
//"v-dS = —pA V] [3.19]
-A
At station 2, the flow is uniform across A2, and since dS and V are in the same direction, we have, in Equation (3.17),
JJ pY • dS = p2A2V2 [3.20]
Лі
Substituting Equations (3.18) to (3.20) into (3.17), we obtain
—pAV — p2A2V2 0 — 0
Equation (3.21) is the quasi-one-dimensional continuity equation; it applies to both compressible and incompressible flow.[6] In physical terms, it states that the mass flow
through the duct is constant (i. e., what goes in must come out). Compare Equation (3.21) with Equation (2.43) for mass flow.
Consider incompressible flow only, where p = constant. In Equation (3.21), Pi = p2, and we have
 [3.22] [3.22]
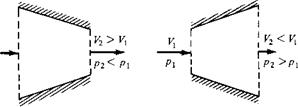
Equation (3.22) is the quasi-one-dimensional continuity equation for incompressible flow. In physical terms, it states that the volume flow (cubic feet per second or cubic meters per second) through the duct is constant. From Equation (3.22), we see that if the area decreases along the flow (convergent duct), the velocity increases; conversely, if the area increases (divergent duct), the velocity decreases. These variations are shown in Figure 3.6; they are fundamental consequences of the incompressible continuity equation, and you should fully understand them. Moreover, from Bernoulli’s equation, Equation (3.15), we see that when the velocity increases in a convergent duct, the pressure decreases; conversely, when the velocity decreases in a divergent duct, the pressure increases. These pressure variations are also shown in Figure 3.6.
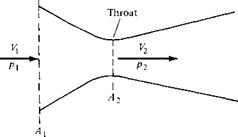
Consider the incompressible flow through a convergent-divergent duct, shown in Figure 3.7. The flow enters the duct with velocity V) and pressure p. The velocity increases in the convergent portion of the duct, reaching a maximum value V2 at the minimum area of the duct. This minimum area is called the throat. Also, in the convergent section, the pressure decreases, as sketched in Figure 3.7. At the throat, the pressure reaches a minimum value p2- In the divergent section downstream of the throat, the velocity decreases and the pressure increases. The duct shown in Figure 3.7 is called a venturi-, it is a device that finds many applications in engineering, and its use dates back more than a century. Its primary characteristic is that the pressure P2 is lower at the throat than the ambient pressure p outside the venturi. This pressure difference p — p2 is used to advantage in several applications. For example, in the carburetor of an automobile engine, there is a venturi through which the incoming air is mixed with fuel. The fuel line opens into the venturi at the throat. Because P2 is less than the surrounding ambient pressure p, the pressure difference p — P2 helps to force the fuel into the airstream and mix it with the air downstream of the throat.
In an application closer to aerodynamics, a venturi can be used to measure airspeeds . Consider a venturi with a given inlet-to-throat area ratio A/A2, as shown in Figure 3.7. Assume that the venturi is inserted into an airstream that has an unknown
     V, V,
|
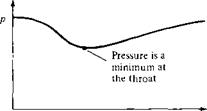
Figure 3.7 Flow through a venturi.
|
|
velocity V. We wish to use the venturi to measure this velocity. With regard to the venturi itself, the most direct quantity that can be measured is the pressure difference p і — P2- This can be accomplished by placing a small hole (a pressure tap) in the wall of the venturi at both the inlet and the throat and connecting the pressure leads (tubes) from these holes across a differential pressure gage, or to both sides of a U-tube manometer (see Section 1.9). In such a fashion, the pressure difference Pi — P2 can be obtained directly. This measured pressure difference can be related to the unknown velocity V) as follows. From Bernoulli’s equation, Equation (3.13), we have
![Incompressible Flow in a Duct: the Venturi and Low-Speed Wind Tunnel Подпись: [3.23]](/img/3128/image436.gif) Vf = ~(P2 – Pi) + V22 p Vf = ~(P2 – Pi) + V22 p
From the continuity equations, Equation (3.22), we have
[3.24]
Substituting Equation (3.24) into (3.23), we obtain
 v’=h-p’)+(j-Sv‘ v’=h-p’)+(j-Sv‘
Solving Equation (3.25) for Vj, we obtain
|
2(pi – p2)
p[(A, M2)2- 1]
|
|
|
|
Equation (3.26) is the desired result; it gives the inlet air velocity V in terms of the measured pressure difference p— pi and the known density p and area ratio A i / A 2. In this fashion, a venturi can be used to measure airspeeds. Indeed, historically the first practical airspeed indicator on an airplane was a venturi used by the French Captain A. Eteve in January 1911, more than 7 years after the Wright brothers’ first powered flight. Today, the most common airspeed-measuring instrument is the Pitot tube (to be discussed in Section 3.4); however, the venturi is still found on some general aviation airplanes, including home-built and simple experimental aircraft.
Another application of incompressible flow in a duct is the low-speed wind tunnel. The desire to build ground-based experimental facilities designed to produce flows of air in the laboratory which simulate actual flight in the atmosphere dates back to 1871, when Francis Wenham in England built and used the first wind tunnel in history.4 From that date to the mid-1930s, almost all wind tunnels were designed to produce airflows with velocities from 0 to 250 mi/h. Such low-speed wind tunnels are still much in use today, along with a complement of transonic, supersonic, and hypersonic tunnels. The principles developed in this section allow us to examine the basic aspects of low-speed wind tunnels, as follows.
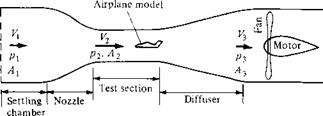
In essence, a low-speed wind tunnel is a large venturi where the airflow is driven by a fan connected to some type of motor drive. The wind-tunnel fan blades are similar to airplane propellers and are designed to draw the airflow through the tunnel circuit. The wind tunnel may be open circuit, where the air is drawn in the front directly from the atmosphere and exhausted out the back, again directly to the atmosphere, as shown in Figure 3.8a; or the wind tunnel may be closed circuit, where the air from the exhaust is returned directly to the front of the tunnel via a closed duct forming a loop, as shown in Figure 3.8b. In either case, the airflow with pressure p enters the nozzle at a low velocity Vi, where the area is Ai. The nozzle converges to a smaller area A2 at the test section, where the velocity has increased to 33 and the pressure has decreased to p2- After flowing over an aerodynamic model (which may be a model of a complete airplane or part of an airplane such as a wing, tail, engine, or nacelle), the air passes into a diverging duct called a diffuser, where the area increases to A3, the velocity decreases to V3, and the pressure increases to рз. From the continuity equation (3.22), the test-section air velocity is
 [3.27] [3.27]
In turn, the velocity at the exit of the diffuser is
 [3.28] [3.28]
The pressure at various locations in the wind tunnel is related to the velocity by Bernoulli’s equation:
![Incompressible Flow in a Duct: the Venturi and Low-Speed Wind Tunnel Подпись: [3.29]](/img/3128/image440.gif) P + pVf = P2 + pV% = Рз + рУз P + pVf = P2 + pV% = Рз + рУз
I 4 For a discussion on the history of wind tunnels, see chapter 4 of Reference 2.
|
(reservoir)
|
|
|
(a) Open-circuit tunnel
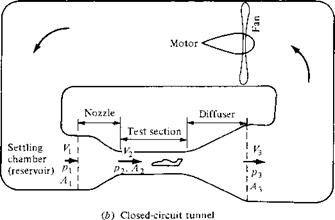
Figure 3.8 (a) Open-circuit tunnel, (b) Closed-circuit tunnel.
|
|
The basic factor that controls the air velocity in the test section of a given low – speed wind tunnel is the pressure difference p — /ъ. To see this more clearly, rewrite Equation (3.29) as
Vi = — (Pi – Pi) + v,2 [3.30]
p
From Equation (3.27), V) = (Аг/АОУг – Substituting into the right-hand side of Equation (3.30), we have
Solving Equation (3.31) for we obtain
The area ratio A2/A1 is a fixed quantity for a wind tunnel of given design. Moreover, the density is a known constant for incompressible flow. Therefore, Equation (3.32) demonstrates conclusively that the test-section velocity Vi is governed by the pressure difference p — pi. The fan driving the wind-tunnel flow creates this pressure difference by doing work on the air. When the wind-tunnel operator turns the “control knob” of the wind tunnel and adjusts the power to the fan, he or she is essentially adjusting the pressure difference p — P2 and, in turn, adjusting the velocity via Equation (3.32).
In low-speed wind tunnels, a method of measuring the pressure difference p — pi, hence of measuring Vi via Equation (3.32), is by means of a manometer as discussed in Section 1.9. In Equation (1.56), the density is the density of the liquid in the manometer (not the density of the air in the tunnel). The product of density and the acceleration of gravity g in Equation (1.56) is the weight per unit volume of the manometer fluid. Denote this weight per unit volume by w. Referring to Equation
(1.56) , if the side of the manometer associated with pa is connected to a pressure tap in the settling chamber of the wind tunnel, where the pressure is p, and if the other side of the manometer (associated with рь) is connected to a pressure tap in the test section, where the pressure is P2, then, from Equation (1.56),
p^—pi — wAh
where Ah is the difference in heights of the liquid between the two sides of the manometer. In turn, Equation (3.32) can be expressed as
In many low-speed wind tunnels, the test section is vented to the surrounding atmosphere by means of slots in the wall; in others, the test section is not a duct at all, but rather, an open area between the nozzle exit and the diffuser inlet. In both cases, the pressure in the surrounding atmosphere is impressed on the test-section flow; hence, pi = 1 atm. (In subsonic flow, a jet that is dumped freely into the surrounding air takes on the same pressure as the surroundings; in contrast, a supersonic free jet may have completely different pressures than the surrounding atmosphere, as we see in Chapter 10.)
Keep in mind that the basic equations used in this section have certain limitations—we are assuming a quasi-one-dimensional inviscid flow. Such equations can sometimes lead to misleading results when the neglected phenomena are in reality important. For example, if A3 = A1 (inlet area of the tunnel is equal to the exit area), then Equations (3.27) and (3.28) yield V3 = V. In turn, from Equation (3.29), ръ = /з,; that is, there is no pressure difference across the entire tunnel circuit. If this were true, the tunnel would run without the application of any power—we would have a perpetual motion machine. In reality, there are losses in the airflow due to friction at the tunnel walls and drag on the aerodynamic model in the test section. Bernoulli’s equation, Equation (3.29), does not take such losses into account. (Review the derivation of Bernoulli’s equation in Section 3.2; note that viscous effects are neglected.) Thus, in an actual wind tunnel, there is a pressure loss due to viscous and drag effects, and p3 < p. The function of the wind-tunnel motor and fan is to
 |
 |
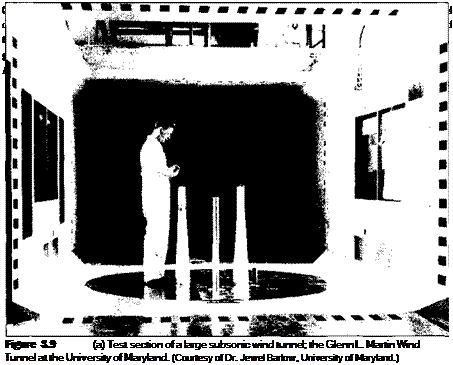
add power to the airflow in order to increase the pressure of the flow coming out of the diffuser so that it can be exhausted into the atmosphere (Figure 3.8a) or returned to the inlet of the nozzle at the higher pressure p (Figure 3.8/;). Photographs of a typical subsonic wind tunnel are shown in Figure 3.9a and b.
(a)

Consider a low-speed subsonic wind tunnel with a 12/1 contraction ratio for the nozzle. If the flow in the test section is at standard sea level conditions with a velocity of 50 m/s, calculate the height difference in a U-tube mercury manometer with one side connected to the nozzle inlet and the other to the test section.
 Solution Solution
At standard sea level, p = 1.23 kg/m3. From Equation (3.32),
However, p, — p2 = wAh. The density of liquid mercury is 1.36 x 10⁴ kg/m Hence,
w = (1.36 x 10⁴ kg/m3)(9.8 m/s2) = 1.33 x!05 N/nr
 Consider a model of an airplane mounted in a subsonic wind tunnel, such as shown in Figure 3.10. The wind-tunnel nozzle has a 12-to-l contraction ratio. The maximum lift coefficient of Consider a model of an airplane mounted in a subsonic wind tunnel, such as shown in Figure 3.10. The wind-tunnel nozzle has a 12-to-l contraction ratio. The maximum lift coefficient of

|
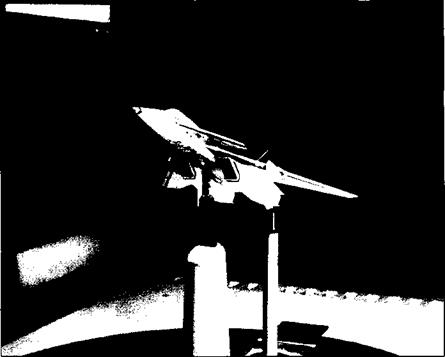
Figure 3.1 О Typical model installation in the test section of a large wind tunnel. The Glenn L. Martin Wind Tunnel at the University of Maryland.
|
|
the airplane model is 1.3. The wing planform area of the model is 6 ft2. The lift is measured with a mechanical balance that is rated at a maximum force of 1000 lb; that is, if the lift of the airplane model exceeds 1000 lb, the balance will be damaged. During a given test of this airplane model, the plan is to rotate the model through its whole range of angle of attack, including up to that for maximum CL. Calculate the maximum pressure difference allowable between the wind-tunnel settling chamber and the test section, assuming standard sea level density in the test section (i. e., px = 0.002377 slug/ft3).
In this chapter, we have studied the inviscid, incompressible flow over airfoils. When compared with actual experimental lift and moment data for airfoils in low-speed flows, we have seen that our theoretical results based on the assumption of inviscid flow are quite good—with one glaring exception. In the real case, flow separation occurs over the top surface of the airfoil when the angle of attack exceeds a certain value—the “stalling” angle of attack. As described in Section 4.3, this is a viscous effect. As shown in Figure 4.4, the lift coefficient reaches a local maximum denoted by c’/.max, and the angle of attack at which q max is achieved is the stalling angle of attack. An increase in a beyond this value usually results in a (sometimes rather precipitous) drop in lift. At angles of attack well below the stalling angle, the experimental data
clearly show a linear increase in q with increasing a—a result that is predicted by the theory presented in this chapter. Indeed, in this linear region, the inviscid flow theory is in excellent agreement with the experiment, as reflected in Figure 4.5 and as demonstrated by Example 4.2. However, the inviscid theory does not predict flow separation, and consequently the prediction of Q, max and the stalling angle of attack must be treated in some fashion by viscous flow theory. Such viscous flow analyses are the purview of Part 4. On the other hand, the purpose of this section is to examine the physical features of the real flow over an airfoil, and flow separation is an inherent part of this real flow. Therefore, let us take a more detailed look at how the flow field over an airfoil changes as the angle of attack is increased, and how the lift coefficient is affected by such changes.
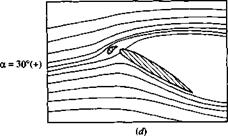
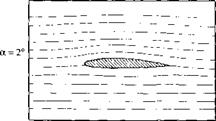
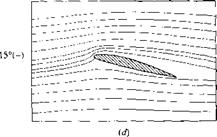
The flow fields over an NACA 4412 airfoil at different angles of attack are shown in Figure 4.34. Here, the streamlines are drawn to scale as obtained from the experimental results of Hikaru Ito given in Reference 50. The experimental streamline patterns were made visible by a smoke wire technique, wherein metallic wires spread with oil over their surfaces were heated by an electric pulse and the resulting white smoke creates visible streaklines in the flow field. In Figure 4.34, the angle of attack is progressively increased as we scan from Figure 4.34a to e; to the right of each streamline picture is an arrow, the length of which is proportional to the value of the lift coefficient at the given angle of attack. The actual experimentally measured lift curve for the airfoil is given in Figure 4.34/. Note that at low angle of attack, such as a — 2° in Figure 4.34a, the streamlines are relatively undisturbed from their freestream shapes and q is small. As a is increased to 5°, as shown in Figure 4.34£>, and then to 10°, as shown in Figure 4.34c, the streamlines exhibit a pronounced upward deflection in the region of the leading edge, and a subsequent downward deflection in the region of the trailing edge. Note that the stagnation point progressively moves downstream of the leading edge over the bottom surface of the airfoil as a is increased. Of course, c; increases as a is increased, and, in this region, the increase is linear, as seen in Figure 4.34/. When a is increased to slightly less than 15°, as shown in Figure 4.34d, the curvature of the streamlines is particularly apparent. In Figure 4.34/ the flow field is still attached over the top surface of the airfoil. However, as a is further increased slightly above 15°, massive flow-field separation occurs over the top surface, as shown in Figure 4.34e. By slightly increasing a from that shown in Figure 434d to that in Figure 4.34e, the flow quite suddenly separates from the leading edge and the lift coefficient experiences a precipitous decrease, as seen in Figure 4.34/.
The type of stalling phenomenon shown in Figure 4.34 is called leading-edge stall; it is characteristic of relatively thin airfoils with thickness ratios between 10 and 16 percent of the chord length. As seen above, flow separation takes place rather suddenly and abruptly over the entire top surface of the airfoil, with the origin of this separation occurring at the leading edge. Note that the lift curve shown in Figure 4.34/ is rather sharp-peaked in the vicinity of Q max with a rapid decrease in q above the stall.
A second category of stall is the trailing-edge stall. This behavior is characteristic of thicker airfoils such as the NACA 4421 shown in Figure 4.35. Here, we see a progressive and gradual movement of separation from the trailing edge toward the
|
(a)
|
|
|
|
|
ci
|
|
|
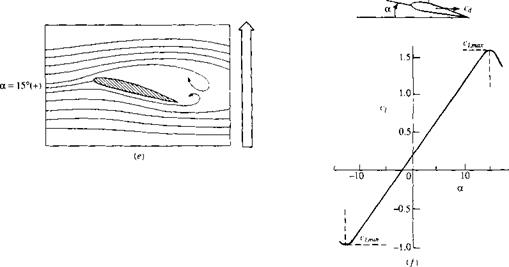
Figure 4.34 Example of leading-edge stall. Streamline patterns for an NACA 441 2 airfoil at different angles of attack. (The streamlines are drawn to scale from experimental data given by Hikaru Ito in Reference 50.) Re = 2.1 x 10⁵ and Vx = 8 m/s in air. The corresponding experimentally measured lift coefficients are indicated by arrows at the right of each streamline picture, where the lenqth of each arrow indicates the relative maqnitude of the lift. The lift coefficient is also shown in part (f).
|
|
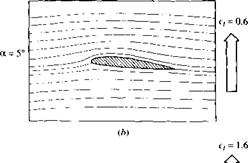 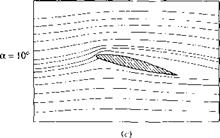
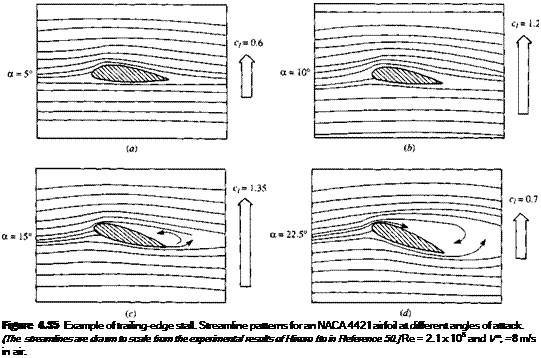
leading edge as a is increased. The lift curve for this case is shown in Figure 4.36. The solid curve in Figure 4.36 is a repeat of the results for the NACA 4412 airfoil shown earlier in Figure 4.34/—an airfoil with a leading-edge stall. The dot-dashed curve is the lift curve for the NACA 4421 airfoil—an airfoil with a trailing-edge stall. In comparing these two curves, note that:
1. The trailing-edge stall yields a gradual bending-over of the lift curve at maximum lift, in contrast to the sharp, precipitous drop in q for the leading-edge stall. The stall is “soft” for the trailing-edge stall.
2. The value of c/.max is not so large for the trailing-edge stall.
3. For both the NACA 4412 and 4421 airfoils, the shape of the mean camber line is the same. From the thin airfoil theory discussed in this chapter, the linear lift slope and the zero-lift angle of attack should be the same for both airfoils; this is confirmed by the experimental data in Figure 4.36. The only difference between the two airfoils is that one is thicker than the other. Hence, comparing results shown in Figures 4.34 to 4.36, we conclude that the major effect of thickness of the airfoil is its effect on the value of ct max, and this effect is mirrored by the leading-edge stall behavior of the thinner airfoil versus the trailing-edge stall behavior of the thicker airfoil.
There is a third type of stall behavior, namely, behavior associated with the extreme thinness of an airfoil. This is sometimes labeled as “thin airfoil stall.” An extreme example of a very thin airfoil is a flat plate; the lift curve for a flat plate is
|
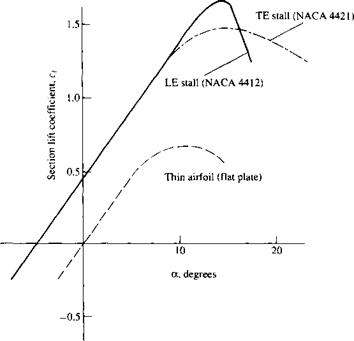
Figure 4.36 Lift-coefficient curves for three airfoils with different
aerodynamic behavior: trailing-edge stall (NACA4421 airfoil), leading-edge stall (NACA4412 airfoil), thin airfoil stall (flat plate).
|
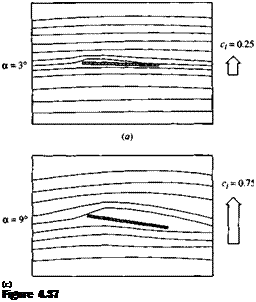
shown as the dashed curve in Figure 4.36 labeled “thin airfoil stall.” The streamline patterns for the flow over a flat plate at various angles of attack are given in Figure 4.37. The thickness of the flat plate is 2 percent of the chord length. Inviscid, incompressible flow theory shows that the velocity becomes infinitely large at a sharp convex comer; the leading edge of a flat plate at an angle of attack is such a case. In the real flow over the plate as shown in Figure 4.37, nature addresses this singular behavior by having the flow separate at the leading edge, even for very low values of a. Examining Figure 4.37a, where a = 3°, we observe a small region of separated flow at the leading edge. This separated flow reattaches to the surface further downstream, forming a separation bubble in the region near the leading edge. As a is increased, the reattachment point moves further downstream; that is, the separation bubble becomes larger. This is illustrated in Figure 4.37/? where a = 7°. At a = 9° (Figure 4.37c), the separation bubble extends over almost the complete flat plate. Referring back to Figure 4.36, we note that this angle of attack corresponds to c/ max for the flat plate. When a is increased further, total flow separation is present, such as shown in Figure 4.37d. The lift curve for the flat plate in Figure 4.36 shows an early departure from its linear variation at about a = 3°; this corresponds to the formation of the leading-edge separation bubble. The lift curve gradually bends over as a is increased further and exhibits a very gradual and “soft” stall. This is a trend similar to the
 |
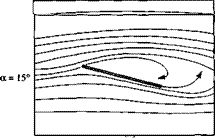 |
Example of thin airfoil stall. Streamline patterns for a flat plate at angle of attack. (The streamlines are drawn to scale from the experimental data of Hikaru Ito in Reference 50.)
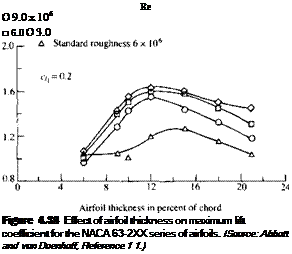
case of the trailing-edge stall, although the physical aspects of the flow are quite different between the two cases. Of particular importance is the fact that Q, max for the flat plate is considerably smaller than that for the two NACA airfoils compared in Figure 4.36. Hence, we can conclude from Figure 4.36 that the value of с/іШах is critically dependent on airfoil thickness. In particular, by comparing the flat plate with the two NACA airfoils, we see that some thickness is vital to obtaining a high value of Q max. However, beyond that, the amount of thickness will influence the type of stall (leading-edge versus trailing-edge), and airfoils that are very thick tend to exhibit reduced values of c; max as the thickness increases. Hence, if we plot Q. max versus thickness ratio, we expect to see a local maximum. Such is indeed the case, as shown in Figure 4.38. Here, experimental data for c/,max for the NACA 63- 2XX series of airfoils is shown as a function of the thickness ratio. Note that as the thickness ratio increases from a small value, c/ max first increases, reaches a maximum value at a thickness ratio of about 12 percent, and then decreases at larger thickness ratios. The experimental data in Figure 4.38 is plotted with the Reynolds number as a parameter. Note that Q max for a given airfoil is clearly a function of Re, with higher values of c;?max corresponding to higher Reynolds numbers. Since flow separation is responsible for the lift coefficient exhibiting a local maximum, since flow separation is a viscous phenomenon, and since a viscous phenomenon is governed by a Reynolds number, it is no surprise that q max exhibits some sensitivity to Re.
When was the significance of airfoil thickness first understood and appreciated? This question is addressed in the historical note in Section 4.13, where we will see
that the aerodynamic properties of thick airfoils even transcended technology during World War I and impacted the politics of the armistice.
Let us examine some other aspects of airfoil aerodynamics—aspects that are not always appreciated in a first study of the subject. The simple generation of lift by an airfoil is not the prime consideration in its design—even a barn door at an angle of attack produces lift. Rather, there are two figures of merit that are primarily used to judge the quality of a given airfoil:
1. The lift-to-drag ratio L/D. An efficient airfoil produces lift with a minimum of drag; that is, the ratio of lift-to-drag is a measure of the aerodynamic efficiency of an airfoil. The standard airfoils discussed in this chapter have high L/D ratios— much higher than that of a barn door. The L/D ratio for a complete flight vehicle has an important impact on its flight performance; for example, the range of the vehicle is directly proportional to the L/D ratio. (See Reference 2 for an extensive discussion of the role of L/D on flight performance of an airplane.)
2. The maximum lift coefficient c;>max. An effective airfoil produces a high value of ci, max—much higher than that produced by a bam door.
The maximum lift coefficient is worth some additional discussion here. For a complete flight vehicle, the maximum lift coefficient CT max determines the stalling speed of the aircraft as discussed in the Design Box at the end of Section 1.8. From Equation (1.47), repeated below:

Therefore, a tremendous incentive exists to increase the maximum lift coefficient of an airfoil, in order to obtain either lower stalling speeds or higher payload weights at the same speed, as reflected in Equation (1.47). Moreover, the maneuverability of an airplane (i. e„ the smallest possible turn radius and the fastest possible turn rate) depends on a large value of C7,max (see Section 6.17 of Reference 2). On the other hand, for an airfoil at a given Reynolds number, the value of c; max is a function primarily of its shape. Once the shape is specified, the value of Q, max is what nature dictates, as we have already seen. Therefore, to increase c/>max beyond such a value, we must carry out some special measures. Such special measures include the use of flaps and/or leading-edge slats to increase c/,max above that for the reference airfoil itself. These are called high-lift devices, and are discussed in more detail below.
A trailing-edge flap is simply a portion of the trailing-edge section of the airfoil that is hinged and which can be deflected upward or downward, as sketched in the insert in Figure 4.39a. When the flap is deflected downward (a positive angle <5 in Figure 4.39a, the lift coefficient is increased, as shown in Figure 4.39a. This increase is due to an effective increase in the camber of the airfoil as the flap is deflected
|
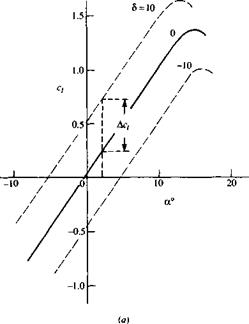
Figure 4.39 Effect of flap deflection on streamline shapes. (The streamlines are drawn to scale from the experimental data of Hikaru Ito in Reference 50.j (o) Effect of flap deflection on lift coefficient, (b) Streamline pattern with no flap deflection, (c) Streamline pattern with a 15° flop deflection.
|
|
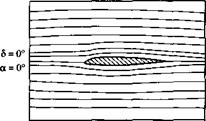 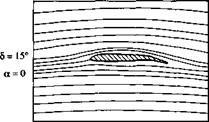
downward. The thin airfoil theory presented in this chapter clearly shows that the zero-lift angle of attack is a function of the amount of camber [see Equation (4.61)], with о!^=о becoming more negative as the camber is increased. In terms of the lift curve shown in Figure 4.39a, the original curve for no flap deflection goes through the origin because the airfoil is symmetric; however, as the flap is deflected downward, this lift curve simply translates to the left because aL=0 is becoming more negative. In Figure 4.39a, the results are given for flap deflections of ±10°. Comparing the case for 5 = 10° with the no-deflection case, we see that, at a given angle of attack, the lift coefficient is increased by an amount Де/ due to flap deflection. Moreover, the actual value of Cf, max is increased by flap deflection, although the angle of attack at which С/ max occurs is slightly decreased. The change in the streamline pattern when the flap is deflected is shown in Figure 4.39b and c. Figure 4.39b is the case for a = 0 and 5 = 0 (i. e., a symmetric flow). However, when a is held fixed at zero, but the flap is deflected by 15°, as shown in Figure 4.39c, the flow field becomes unsymmetrical and resembles the lifting flows shown (e. g., in Figure 4.34). That is, the streamlines in Figure 4.39c are deflected upward in the vicinity of the leading edge and downward near the trailing edge, and the stagnation point moves to the lower surface of the airfoil—just by deflecting the flap downward.
High-lift devices can also be applied to the leading edge of the airfoil, as shown in the insert in Figure 4.40. These can take the form of a leading-edge slat, leading – edge droop, or a leading-edge flap. Let us concentrate on the leading-edge slat,
|
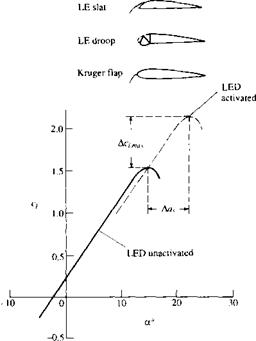
Figure 4.40 Effect of leading-edge flap on lift coefficient.
|
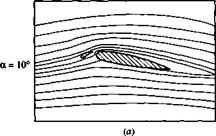
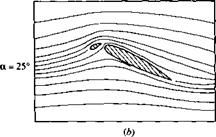
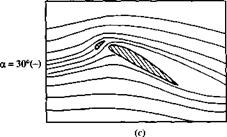
which is simply a thin, curved surface that is deployed in front of the leading edge. In addition to the primary airflow over the airfoil, there is now a secondary flow that takes place through the gap between the slat and the airfoil leading edge. This secondary flow from the bottom to the top surface modifies the pressure distribution over the top surface; the adverse pressure gradient which would normally exist over much of the top surface is mitigated somewhat by this secondary flow, hence delaying flow separation over the top surface. Thus, a leading-edge slat increases the stalling angle of attack, and hence yields a higher c/>max, as shown by the two lift curves in Figure 4.40, one for the case without a leading-edge device and the other for the slat deployed. Note that the function of a leading-edge slat is inherently different from that of a trailing-edge flap. There is no change in aL=o; rather, the lift curve is simply extended to a higher stalling angle of attack, with the attendant increase in cymax. The streamlines of a flow field associated with an extended leading-edge slat are shown in Figure 4.41. The airfoil is in an NACA 4412 section. (Note: The flows shown in Figure 4.41 do not correspond exactly with the lift curves shown in Figure 4.40, although the general behavior is the same.) The stalling angle of attack for the NACA 4412 airfoil without slat extension is about 15°, but increases to about 30° when the slat is extended. In Figure 4.41a, the angle of attack is 10°. Note the flow through the gap between the slat and the leading edge. In Figure 4.4lb, the angle of attack is 25° and the flow is still attached. This prevails to an angle of attack slightly less than 30°, as shown in Figure 4.41c. At slightly higher than 30° flow separation suddenly occurs and the airfoil stalls.
Figure 4.41 Effect of a leading-edge slat on the streamline pattern over an NACA 4412 airfoil.
(The streamlines are drawn to scale from the experimental data in Reference 50.J
The high-lift devices used on modern, high-performance aircraft are usually a combination of leading-edge slats (or flaps) and multielement trailing-edge flaps. Typical airfoil configurations with these devices are sketched in Figure 4.42. Three configurations including the high-lift devices are shown: A—the cruise configuration, with no deployment of the high-lift devices; В—a typical configuration at takeoff, with both the leading – and trailing-edge devices partially deployed; and C—a typical configuration at landing, with all devices fully extended. Note that for configuration C, there is a gap between the slat and the leading edge and several gaps between the different elements of the multielement trailing-edge flap. The streamline pattern for the flow over such a configuration is shown in Figure 4.43. Flere, the leading-edge slat and the multielement trailing-edge flap are fully extended. The angle of attack is 25°. Although the main flow over the top surface of the airfoil is essentially separated, the local flow through the gaps in the multi-element flap is locally attached to the top surface of the flap; because of this locally attached flow, the lift coefficient is still quite high, on the order of 4.5.
With this, we end our discussion of the real flow over airfoils. In retrospect, we can say that the real flow at high angles of attack is dominated by flow separation—a phenomenon that is not properly modeled by the inviscid theories presented in this chapter. On the other hand, at lower angles of attack, such as those associated with the cruise conditions of an airplane, the inviscid theories presented here do an excellent job of predicting both lift and moments on an airfoil. Moreover, in this section, we have clearly seen the importance of airfoil thickness in determining the angle of
|

A: Cruise configuration
|
|
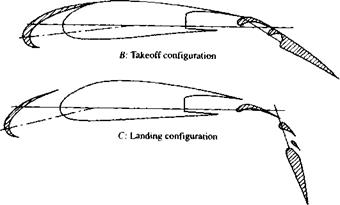
Figure 4.42 Airfoil with leading-edge and trailing-edge high-lift mechanisms. The trailing-edge device is a multi-element flap.
|
|
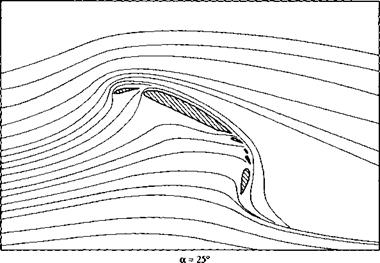
Figure 4.43 Effect of leading-edge and multi-element flaps on the
streamline pattern around an airfoil at angle of attack of 25°. (The streamlines are drawn to scale from the experimental data of Reference 50.)
|
attack at which flow separation will occur, and hence greatly affecting the maximum lift coefficient.
Common experience tells us that sound travels through air at some finite velocity. For example, you see a flash of lightning in the distance, but you hear the corresponding thunder at some later moment. What is the physical mechanism of the propagation of sound waves? How can we calculate the speed of sound? What properties of the gas does it depend on? The speed of sound is an extremely important quantity which dominates the physical properties of compressible flow, and hence the answers to the above questions are vital to our subsequent discussions. The purpose of this section is to address these questions.
The physical mechanism of sound propagation in a gas is based on molecular motion. For example, imagine that you are sitting in a room, and suppose that a firecracker goes off in one comer. When the firecracker detonates, chemical energy (basically a form of heat release) is transferred to the air molecules adjacent to the firecracker. These energized molecules are moving about in a random fashion. They eventually collide with some of their neighboring molecules and transfer their high energy to these neighbors. In turn, these neighboring molecules eventually collide with their neighbors and transfer energy in the process. By means of this “domino” effect, the energy released by the firecracker is propagated through the air by molecular collisions. Moreover, because T, p, and p for a gas are macroscopic averages of the detailed microscopic molecular motion, the regions of energized molecules are also regions of slight variations in the local temperature, pressure, and density. Hence, as this energy wave from the firecracker passes over our eardrums, we “hear” the slight pressure changes in the wave. This is sound, and the propagation of the energy wave is simply the propagation of a sound wave through the gas.
Because a sound wave is propagated by molecular collisions, and because the molecules of a gas are moving with an average velocity of lit given by ki
netic theory, then we would expect the velocity of propagation of a sound wave to be approximately the average molecular velocity. Indeed, the speed of sound is about three-quarters of the average molecular velocity. In turn, because the kinetic theory expression given above for the average molecular velocity depends only on the temperature of the gas, we might expect the speed of sound to also depend on temperature only. Let us explore this matter further; indeed, let us now derive an equation for the speed of sound in a gas. Although the propagation of sound is due to molecular collisions, we do not use such a microscopic picture for our derivation. Rather, we take advantage of the fact that the macroscopic properties p, T, p, etc., change across the wave, and we use our macroscopic equations of continuity, momentum, and energy to analyze these changes.
Consider a sound wave propagating through a gas with velocity a, as sketched in Figure 8.4a. Here, the sound wave is moving from right to left into a stagnant gas (region 1), where the local pressure, temperature, and density are p, T, and p, respectively. Behind the sound wave (region 2), the gas properties are slightly different and are given by p + dp, T + dT, and p + dp, respectively. Now imagine that you hop on the wave and ride with it. When you look upstream, into region 1,
you see the gas moving toward you with a relative velocity a, as sketched in Figure 8.4b. When you look downstream, into region 2, you see the gas receding away from you with a relative velocity a + da, as also shown in Figure 8.4. (We have enough fluid-dynamic intuition by now to realize that because the pressure changes across the wave by the amount dp, then the relative flow velocity must also change across the wave by some amount da. Hence, the relative flow velocity behind the wave is a + da.) Consequently, in Figure 8.4b, we have a picture of a stationary sound wave, with the flow ahead of it moving left to right with velocity a. The pictures in Figure 8.4a and b are analogous; only the perspective is different. For purposes of analysis, we use Figure 8.4b.
(Note: Figure 8.4b is similar to the picture of a normal shock wave shown in Figure 8.3. In Figure 8.3, the normal shock wave is stationary, and the upstream flow is moving left to right at a velocity u. If the upstream flow were to be suddenly shut off, then the normal shock wave in Figure 8.3 would suddenly propagate to the left with a wave velocity of u, similar to the moving sound wave shown in Figure 8.4a. The analysis of moving waves is slightly more subtle than the analysis of stationary waves; hence, it is simpler to begin a study of shock waves and sound waves with the pictures of stationary waves as shown in Figures 8.3 and 8.4b. Also, please note that the sound wave in Figure 8.4b is nothing more than an infinitely weak normal shock wave.)
Examine closely the flow through the sound wave sketched in Figure 8.4b. The flow is one-dimensional. Moreover, it is adiabatic, because we have no source of heat transfer into or out of the wave (e. g., we are not “zapping” the wave with a laser beam or heating it with a torch). Finally, the gradients within the wave are very small—the changes dp, dT, dp, and da are infinitesimal. Therefore, the influence of dissipative phenomena (viscosity and thermal conduction) is negligible. As a result, the flow through the sound wave is both adiabatic and reversible—the flow is isentropic. Since we have now established that the flow is one-dimensional and isentropic, let us apply the appropriate governing equations to the picture shown in Figure 8.4b.
Consider a flow field wherein all properties vary with spatial location and time, e. g., p — p(x, y,z, t). In this flow field, consider the fixed finite control volume shown in Figure 2.17. At a point on the control surface, the flow velocity is V and the vector elemental surface area is dS. Also dV is an elemental volume inside the control volume. Applied to this control volume, the above physical principle means
 Net mass flow out of control _ time rate of decrease of volume through surface S mass inside control volume V Net mass flow out of control _ time rate of decrease of volume through surface S mass inside control volume V
or В = C where В and C are just convenient symbols for the left and right sides, respectively, of Equation (2.45a). First, let us obtain an expression for В in terms of the quantities shown in Figure 2.17. From Equation (2.43), the elemental mass flow across the area dS is
pVn dS = p • dS
Examining Figure 2.17, note that by convention, dS always points in a direction out of the control volume. Hence, when V also points out of the control volume (as shown
|
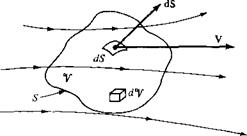
Figure 2.1 7 Finite control volume fixed in space.
|
|
in Figure 2.17), the product pV • dS is positive. Moreover, when V points out of the control volume, the mass flow is physically leaving the control volume; i. e., it is an outflow. Hence, a positive pV • dS denotes an outflow. In turn, when V points into the control volume, pV • dS is negative. Moreover, when V points inward, the mass flow is physically entering the control volume; i. e., it is an inflow. Hence, a negative pV • dS denotes an inflow. The net mass flow out of the entire control surface S is the summation over S of the elemental mass flows. In the limit, this becomes a surface integral, which is physically the left side of Equations (2.45a and b) i. e.,
physical principle of the conservation of mass to a finite control volume fixed in space. Equation (2.48) is called the continuity equation. It is one of the most fundamental equations of fluid dynamics.
Note that Equation (2.48) expresses the continuity equation in integral form. We will have numerous opportunities to use this form; it has the advantage of relating aerodynamic phenomena over a finite region of space without being concerned about the details of precisely what is happening at a given distinct point in the flow. On the other hand, there are many times when we are concerned with the details of a flow and we want to have equations that relate flow properties at a given point. In such a case, the integral form as expressed in Equation (2.48) is not particularly useful. However, Equation (2.48) can be reduced to another form that does relate flow properties at a given point, as follows. To begin with, since the control volume used to obtain Equation (2.48) is fixed in space, the limits of integration are also fixed. Hence, the time derivative can be placed inside the volume integral and Equation (2.48) can be written as
[2.49]
Applying the divergence theorem, Equation (2.26), we can express the right-hand term of Equation (2.49) as
Substituting Equation (2.50) into (2.49), we obtain
Examine the integrand of Equation (2.51). If the integrand were a finite number, then Equation (2.51) would require that the integral over part of the control volume be equal and opposite in sign to the integral over the remainder of the control volume, such that the net integration would be zero. However, the finite control volume is arbitrarily drawn in space; there is no reason to expect cancellation of one region by the other. Hence, the only way for the integral in Equation (2.51) to be zero for an
arbitrary control volume is for the integrand to be zero at all points within the control volume. Thus, from Equation (2.51), we have
Equation (2.52) is the continuity equation in the form of a partial differential equation. This equation relates the flow field variables at a point in the flow, as opposed to Equation (2.48), which deals with a finite space.
It is important to keep in mind that Equations (2.48) and (2.52) are equally valid statements of the physical principle of conservation of mass. They are mathematical representations, but always remember that they speak words—they say that mass can be neither created nor destroyed.
Note that in the derivation of the above equations, the only assumption about the nature of the fluid is that it is a continuum. Therefore, Equations (2.48) and (2.52) hold in general for the three-dimensional, unsteady flow of any type of fluid, inviscid or viscous, compressible or incompressible. (Note: It is important to keep track of all assumptions that are used in the derivation of any equation because they tell you the limitations on the final result, and therefore prevent you from using an equation for a situation in which it is not valid. In all our future derivations, develop the habit of noting all assumptions that go with the resulting equations.)
It is important to emphasize the difference between unsteady and steady flows. In an unsteady flow, the flow-field variables are a function of both spatial location and time, e. g.,
P – P(x, У, z, t)
This means that if you lock your eyes on one fixed point in space, the density at that point will change with time. Such unsteady fluctuations can be caused by time – varying boundaries (e. g., an airfoil pitching up and down with time or the supply valves of a wind tunnel being turned off and on). Equations (2.48) and (2.52) hold for such unsteady flows. On the other hand, the vast majority of practical aerodynamic problems involve steady flow. Here, the flow-field variables are a function of spatial location only, e. g.,
P = P(x, y, z)
|
![]()




 [2.129]

![Angular Velocity, Vorticity, and Strain Подпись: [2.131]](/img/3128/image331.gif) dv 3 и dx dy
dv 3 и dx dy


 V,
V,


