Category Fundamentals of Aerodynamics

Fundamental Equations in Terms of the Substantial Derivative

In this section, we express the continuity, momentum, and energy equations in terms of the substantial derivative. In the process, we make use of the following vector identity:

v. (pV) =pV-V + V-Vp [2.106]

In words, this identity states that the divergence of a scalar times a vector is equal to the scalar times the divergence of the vector plus the dot product of the vector and the gradient of the scalar.

First, consider the continuity equation given in the form of Equation (2.52):

^ + V • (pV) = 0 [2.52]

ot

Using the vector identity given by Equation (2.106), Equation (2.52) becomes

— +V-Vp + pV-V = 0 [2.107]

31

Подпись: Dp — + pV • V = 0 Dt и

However, the sum of the first two terms of Equation (2.107) is the substantial derivative of p [see Equation (2.104)]. Thus, from Equation (2.107),

Equation (2.108) is the form of the continuity equation written in terms of the sub­stantial derivative.

Next, consider the x component of the momentum equation given in the form of Equation (2.70a):

Fundamental Equations in Terms of the Substantial Derivative Fundamental Equations in Terms of the Substantial Derivative

[2.70a]


Fundamental Equations in Terms of the Substantial Derivative

The first terms can be expanded as

d{pu)

dt


[2.109]


image145image146

In the second term of Equation (2.70a), treat the scalar quantity as и and the vector quantity as pV. Then the term can be expanded using the vector identity in Equation (2.106):

V • (puV) = V • [a(pV)] = mV • (pV) + (pV)) • Vm [2.1 lO]

Substituting Equations (2.109) and (2.110) into (2.70a), we obtain

Fundamental Equations in Terms of the Substantial Derivative Fundamental Equations in Terms of the Substantial Derivative

Fundamental Equations in Terms of the Substantial Derivative

or

Подпись:+ (pV) • Vm = – —- + pfx + (Fx) viscous [2.1 11] dx

Examine the two terms inside the square brackets; they are precisely the left side of the continuity equation, Equation (2.52). Since the right side of Equation (2.52) is zero, the sum inside the square brackets is zero. Hence, Equation (2.11) becomes

Эм dp _

P~—b pV • Vm = — ——- — h pfx + (Fx(viscous

dt dx

/Эм dp

or P ( — +V • VmJ =-—+ pfx + (^(viscous [2.112]

Examine the two terms inside the parentheses in Equation (2.12); their sum is precisely the substantial derivative Du/Dt. Hence, Equation (2.12) becomes

Du

P~Dt ~


Fundamental Equations in Terms of the Substantial Derivative

In a similar manner, Equations (2.10b and c) yield

Fundamental Equations in Terms of the Substantial Derivative

[2.113b]


image148[2.113c]

Equations (2.113a to c) are the x, y, and z components of the momentum equation written in terms of the substantial derivative. Compare these equations with Equations (2.70a to c). Note that the right sides of both sets of equations are unchanged; only the left sides are different.

In an analogous fashion, the energy equation given in the form of Equation

(2.96) can be expressed in terms of the substantial derivative. The derivation is left as a homework problem; the result is

Подпись: VISCOUSimage149[2.114]

Again, the right-hand sides of Equations (2.96) and (2.114) are the same; only the form of the left sides is different.

In modem aerodynamics, it is conventional to call the form of Equations (2.52), (2.70a to c), and (2.96) the conservation form of the fundamental equations (some­times these equations are labeled as the divergence form because of the divergence terms on the left side). In contrast, the form of Equations (2.108), (2.113a to c), and (2.114), which deals with the substantial derivative on the left side, is called the nonconservation form. Both forms are equally valid statements of the fundamental principles, and in most cases, there is no particular reason to choose one form over the other. The nonconservation form is frequently found in textbooks and in aerodynamic theory. However, for the numerical solution of some aerodynamic problems, the con­servation form sometimes leads to more accurate results. Hence, the distinction between the conservation form and the nonconservation form has become important in the modem discipline of computational fluid dynamics. (See Reference 7 for more details.)

Incompressible Flow over Airfoils

Of the many problems now engaging attention, the following are considered of immediate importance and will be considered by the committee as rapidly as funds can be secured for the purpose…. The evolution of more efficient wing sections of practical form, embodying suitable dimensions for an economical structure, with moderate travel of the center-of-pressure and still affording a large range of angle-of-attack combined with efficient action.

From the first Annual Report of the NACA, 1915

4,1 Introduction

With the advent of successful powered flight at the turn of the twentieth century, the importance of aerodynamics ballooned almost overnight. In turn, interest grew in the understanding of the aerodynamic action of such lifting surfaces as fixed wings on airplanes and, later, rotors on helicopters. In the period 1912-1918, the analy­sis of airplane wings took a giant step forward when Ludwig Prandtl and his col­leagues at Gottingen, Germany, showed that the aerodynamic consideration of wings could be split into two parts: (1) the study of the section of a wing—an airfoil—and (2) the modification of such airfoil properties to account for the complete, finite wing. This approach is still used today; indeed, the theoretical calculation and experimental measurement of modem airfoil properties have been a major part of the aeronautics research carried out by the National Aeronautics and Space Administration (NASA) in the 1970s and 1980s. (See Chapter 5 of Reference 2 for a historical sketch on airfoil development and Reference 10 for a description of modem airfoil research.) Following Prandtl’s philosophy, the present chapter deals exclusively with airfoils,

image300

Figure 4.1 Definition of an airfoil.

whereas Chapter 5 treats the case of a complete, finite wing. Therefore, in this chapter and Chapter 5, we make a major excursion into aerodynamics as applied to airplanes.

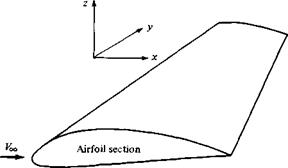
What is an airfoil? Consider a wing as drawn in perspective in Figure 4.1. The wing extends in the у direction (the span direction). The freestream velocity Voo is parallel to the xz plane. Any section of the wing cut by a plane parallel to the xz plane is called an airfoil. The purpose of this chapter is to present theoretical methods for the calculation of airfoil properties. Since we are dealing with inviscid flow, we are not able to predict airfoil drag; indeed, d’Alembert’s paradox says that the drag on an airfoil is zero—clearly not a realistic answer. We will have to wait until Chapter 15 and a discussion of viscous flow before predictions of drag can be made. However, the lift and moments on the airfoil are due mainly to the pressure distribution, which (below the stall) is dictated by inviscid flow. Therefore, this chapter concentrates on the theoretical prediction of airfoil lift and moments.

The road map for this chapter is given in Figure 4.2. After some initial discussion on airfoil nomenclature and characteristics, we present two approaches to low-speed airfoil theory. One is the classical thin airfoil theory developed during the period 1910-1920 (the right-hand branch of Figure 4.2). The other is the modem numerical approach for arbitrary airfoils using vortex panels (the left-hand branch of Figure 4.2). Please refer to this road map as you work your way through this chapter.

Applied Aerodynamics: The Flow Over a Sphere—The Real Case

The present section is a complement to Section 3.18, in which the real flow over a cir­cular cylinder was discussed. Since the present chapter deals with three-dimensional flows, it is fitting at this stage to discuss the three-dimensional analog of the circular cylinder, namely, the sphere. The qualitative features of the real flow over a sphere are similar to those discussed for a cylinder in Section 3.18—the phenomenon of flow separation, the variation of drag coefficient with a Reynolds number, the precip­itous drop in drag coefficient when the flow transits from laminar to turbulent ahead of the separation point at the critical Reynolds number, and the general structure of the wake. These items are similar for both cases. However, because of the three­dimensional relieving effect, the flow over a sphere is quantitatively different from that for a cylinder. These differences are the subject of the present section.

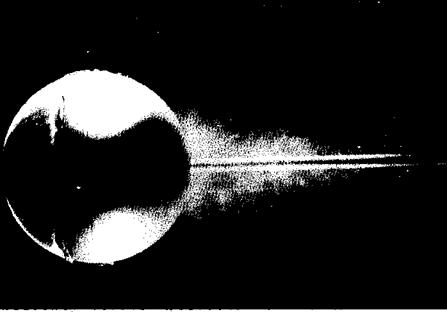
The laminar flow over a sphere is shown in Figure 6.9. Here, the Reynolds number is 15,000, certainly low enough to maintain laminar flow over the spherical

image482

Figure 6.9 Laminar flow case: Instantaneous flow past a sphere in water. Re = 15,000.

Flow is made visible by dye in the water. (Courtesy of H. Werle, ONERA, France. Also in Van Dyke, Milton, An Album of Fluid Motion, The Parabolic Press, Stanford, CA, 1982.)

surface. However, in response to the adverse pressure gradient on the back surface of the sphere predicted by inviscid, incompressible flow theory (see Section 6.4 and Figure 6.6), the laminar flow readily separates from the surface. Indeed, in Figure 6.9, separation is clearly seen on the. forward surface, slightly ahead of the vertical equator of the sphere. Thus, a large, fat wake trails downstream of the sphere, with a consequent large pressure drag on the body (analogous to that discussed in Section 3.18 for a cylinder.) In contrast, the turbulent flow case is shown in Figure 6.10. Here, the Reynolds number is 30,000, still a low number normally conducive to laminar flow. However, in this case, turbulent flow is induced artificially by the presence of a wire loop in a vertical plane on the forward face. (Trip wires are frequently used in experimental aerodynamics to induce transition to turbulent flow; this is in order to study such turbulent flows under conditions where they would not naturally exist.) Because the flow is turbulent, separation takes place much farther over the back surface, resulting in a thinner wake, as can be seen by comparing Figures 6.9 and 6.10. Consequently, the pressure drag is less for the turbulent case.

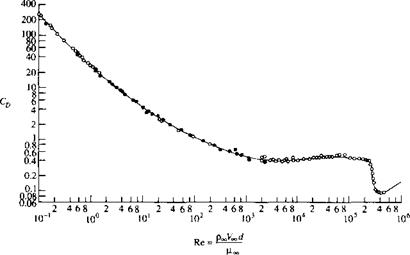
The variation of drag coefficient Co with the Reynolds number for a sphere, is shown in Figure 6.11. Compare this figure with Figure 3.39 for a circular cylinder;

image483

Figure 6.1 О Turbulent flow case: Instantaneous flow past a sphere in water. Re = 30,000. The turbulent flow is forced by a trip wire hoop ahead of the equator, causing the laminar flow to become turbulent suddenly. The flow is made visible by air bubbles in wafer. (Courtesy of H. Werle, ONERA, France. Also in Van Dyke, Milton, An Album of Fluid Motion, The Parabolic Press, Stanford, CA, I982.j

image484

Figure 6.1 1 Variation of drag coefficient with Reynolds number for a sphere. (From Schlichting, Reference 42.)

the С о variations are qualitatively similar, both with a precipitous decrease in Cp near a critical Reynolds number of 300,000, coinciding with natural transition from laminar to turbulent flow. However, quantitatively the two curves are quite different. In the Reynolds number range most appropriate to practical problems, that is, for Re > 1000, the values of CD for the sphere are considerably smaller than those for a cylinder—a classic example of the three-dimensional relieving effect. Reflecting on Figure 3.39 for the cylinder, note that the value of CD for Re slightly less than the critical value is about 1 and drops to 0.3 for Re slightly above the critical value. In contrast, for the sphere as shown in Figure 6.11, Cp is about 0.4 in the Reynolds number range below the critical value and drops to about 0.1 for Reynolds numbers above the critical value. These variations in Co for both the cylinder and sphere are classic results in aerodynamics; you should keep the actual Co values in mind for future reference and comparisons.

As a final point in regard to both Figures 3.39 and 6.11, the value of the critical Reynolds number at which transition to turbulent flow takes place upstream of the separation point is not a fixed, universal number. Quite the contrary, transition is influenced by many factors, as will be discussed in Part 4. Among these is the amount of turbulence in the freestream; the higher the freestream turbulence, the more readily transition takes place. In turn, the higher the freestream turbulence, the lower is the value of the critical Reynolds number. Because of this trend, calibrated spheres are used in wind-tunnel testing actually to assess the degree of freestream turbulence in the test section, simply by measuring the value of the critical Reynolds number on the sphere.

Historical Note: Aerodynamic Coefficients

In Section 1.5, we introduced the convention of expressing aerodynamic force in terms of an aerodynamic coefficient, such as

L = ^PocVISCl

Подпись: andD = pooVlSCD

where L and D are lift and drag, respectively, and Cl and Co are the lift coefficient and drag coefficient, respectively. This convention, expressed in the form shown above, dates from about 1920. But the use of some type of aerodynamic coefficients goes back much further. In this section, let us briefly trace the genealogy of aerodynamic coefficients. For more details, see the author’s recent book, A History of Aerodynamics and Its Impact on Flying Machines (Reference 62).

The first person to define and use aerodynamic force coefficients was Otto Lilien – thal, the famous German aviation pioneer at the end of the nineteenth century. Inter­ested in heavier-than-flight from his childhood, Lilienthal carried out the first defini­tive series of aerodynamic force measurements on cambered (curved) airfoil shapes using a whirling arm. His measurements were obtained over a period of 23 years, cul­minating in the publication of his book Der Vogelflug als Grundlage der Fliegekunst (Birdflight as the Basis of Aviation) in 1889. Many of the graphs in his book are plotted in the form that today we identify as a drag polar, i. e., a plot of drag coeffi­cient versus lift coefficient, with the different data points being measured at angles of attack ranging from below zero to 90°. Lilienthal had a degree in Mechanical Engineering, and his work reflected a technical professionalism greater than most at that time. Beginning in 1891, he put his research into practice by designing several gliders, and executing over 2000 successful glider flights before his untimely death in a crash on August 9, 1896. At the time of his death, Lilienthal was working on the design of an engine to power his machines. Had he lived, there is some conjecture that he would have beaten the Wright brothers in the race for the first heavier-than-air, piloted, powered flight.

In his book, Lilienthal introduced the following equations for the normal and axial forces, which he denoted by N and T, respectively (for normal and “tangential”)

N = 0.3r)FV2 T = 0A30FV2


[1.60]


and


[1.61]


where, in Lilienthal’s notation, F was the reference planform area of the wing in m2, V is the freestream velocity in m/s, and /V and T are in units of kilogram force (the force exerted on one kilogram of mass by gravity at sea level). The number 0.13 is Smeaton’s coefficient, a concept and quantity stemming from measurements made in the eighteenth century on flat plates oriented perpendicular to the flow. Smeaton’s coefficient is proportional to the density of the freestream; its use is archaic, and it went out of favor at the beginning of the twentieth century. By means of Equations

(1.60) and (1.61) Lilienthal introduced the “normal” and “tangential” coefficients, tj and в versus angle of attack. A copy of this table, reproduced in a paper by Octave Chanute in 1897, is shown in Figure 1.50. This became famous as the “Lilienthal Tables,” and was used by the Wright brothers for the design of their early gliders. It is proven in Reference 62 that Lilienthal did not use Equations (1.60) and (1.61) explicitly to reduce his experimental data to coefficient form, but rather determined his experimental values for i] and в by dividing the experimental measurements for N and T by his measured force on the wing at 90° angle of attack. In so doing, he divided out the influence of uncertainties in Smeaton’s coefficient and the veloc­ity, the former being particularly important because the classical value of Smeaton’s coefficient of 0.13 was in error by almost 40 percent. (See Reference 62 for more de­tails.) Nevertheless, we have Otto Lilienthal to thank for the concept of aerodynamic force coefficients, a tradition that has been followed in various modified forms to the present time.

Following on the heals of Lilienthal, Samuel Langley at the Smithsonian Institu­tion published whirling arm data for the resultant aerodynamic force R on a flat plate as a function of angle of attack, using the following equation:

R = kSV2F(ct) [1.62]

where S is the planform area, к is the more accurate value of Smeaton’s coefficient (explicitly measured by Langley on his whirling arm), and F (a ) was the correspond­ing force coefficient, a function of angle of attack.

The Wright brothers preferred to deal in terms of lift and drag, and used expres­sions patterned after Lilienthal and Langley to define lift and drag coefficients:

L = kSV2CL [1.63]

D = kSV2CD [1.64]

The Wrights were among the last to use expressions written explicitly in terms of Smeaton’s coefficient k. Gustave Eiffel in 1909 defined a “unit force coefficient” Ki as

R = KjSV2 [1.65]

In Equation (1.65), Smeaton’s coefficient is nowhere to be seen; it is buried in the direct measurement of A’,. (Eiffel, of Eiffel Tower fame, built a large wind tunnel in 1909, and for the next 14 years reigned as France’s leading aerodynamicist until his death in 1923.) After Eiffel’s work, Smeaton’s coefficient was never used in the aerodynamic literature—it was totally passe.

TABLE OF NORMAL AND TANGENTIAL PRESSURES

Deduced by Lilienthal from the diagrams on Plate VI., in his book “ Bird-flight as the Basis of the Flying Art”

a

Angle,

*

Normal.

a

Tangential.

a

Angle.

4

Normal.

»

Tangential.

-9°………………………………………………

OjOOO

+ 01070

i6°……………

0.909

— 0X275

— 8°…………………………………………

охцо

+ OX267

17°………………………………………

0.915

— 0X273

-7°………………………………………………

0x280

+ ОЛ64

18°……………………………………….

0.919

— ОЛ7О

— 6°…………………………………………

a 120

+ 0uo6o

*9°……………………………………….

0921

— OX265

-s°………………………………..

0.160

+ ОЛ55

ao°………………………………………

0922

— OX259

-4°…………………………………………

0.200

+ OX249

ai°………………………………………..

0933

— OX253

-3°……………………………………………..

0.242

+ 0X243

aa°………………………………………

0934

— 0X247

– 2°…………………………………………….

0.286

+ 0X237

*3°……………………………………….

0.934

— 0X241

— 1°…………..

0.33a

+ OX23I

4°………………………………………

0923

— ОЛ36

0°………….

0.381

+ 0X224

4°………………………………………….

0^23

— 0X231

+ 1°…………………………………………..

0434

+ OX2I6

26°………………………………………

0.920

— 0X226

+ 3°…………………………………………

0489

+ 0Л08

27°…………..

0.918

— 0031

+ 3°……………

0.546

OdOOO

28°…………..

0.915

— 0x216

+ 4°………….

0.600

— OU007

39а…………..

Q.9I2

— 0012

+ 5°………….

0.650

— 0014

30°…………..

0910

—ox»8

+ 6°………….

0.696

— 0031

33°…………..

0906

+ 7°………….

0.737

— ftprf

35°…………..

0896

+0x210

+ 8°………….

0.771

—OX23S

40°…………..

0^90

+0x216

+ 9°………….

O.8OO

— 0043

45°…………..

ОІИМ

+0x220

up………

0.825

— 0050

s°°….

0888

+0x223

n°……….

0.846

— 0x258

55a…………..

0^90

+0x226

i2°………

0864

— 0x264

6o°…………..

0900

+ 0x228

«3°.

0879

— 0070

70°…………..

0.930

+0x230

•4*………

0Л91

—0x274

8o°………….

0960

+0.015

«5°…..

0901

— 0x276

90°………

1.000

0.000

Figure 1.50 The Lilienthal Table of normal and axial force coefficients. This is a facsimile of the actual table that was published by Octave Chanute in an article entitled "Sailing Flight," The Aeronautical Annual,

1 897, which was subsequently used by the Wright Brothers.

Gorrell and Martin, in wind tunnel tests carried out in 1917 at MIT on various airfoil shapes, adopted Eiffel’s approach, giving expressions for lift and drag:

L = K, AV2 [1.66]

D = KXAV2 [1.67]

where A denoted planform area and K, and Kx were the lift and drag coefficients, respectively. For a short period, the use of Kx and Kx became popular in the United States.

However, also by 1917 the density p began to appear explicitly in expressions for force coefficients. In NACA Technical Report No. 20, entitled “Aerodynamic Coefficients and Transformation Tables,” we find the following expression:

F = CpSV2

where F is the total force acting on the body, p is the freestream density, and C is the force coefficient, which was described as “an abstract number, varying for a given airfoil with its angle of incidence, independent of the choice of units, provided these are consistently used for all four quantities (F, p, S, and V).”

Finally, by the end of World War I, Ludwig Prandtl at Gottingen University in Germany established the nomenclature that is accepted as standard today. Prandtl was already famous by 1918 for his pioneering work on airfoil and wing aerodynamics, and for his conception and development of boundary layer theory. (See Section 5.8 for a biographical description of Prandtl.) Prandtl reasoned that the dynamic pressure, (he called it “dynamical pressure”), was well suited to describe aerodynamic force. In his 1921 English-language review of works performed at Gottingen before and during World War I (Reference 63), he wrote for the aerodynamic force,

W — cFq [1.68]

where W is the force, F is the area of the surface, q is the dynamic pressure, and c is a “pure number,” i. e., the force coefficient. It was only a short, quick step to express lift and drag as

L=qxSCL І1.69]

and D=qocSCo [1.70]

where CL and C n are the “pure numbers” referred to by Prandtl (i. e., the lift and drag coefficients). And this is the way it has been ever since.

Fundamentals of Inviscid,. Incompressible Flow

Theoretical fluid dynamics, being a difficult subject, is for convenience, commonly divided into two branches, one treating of frictionless or perfect fluids, the other treating of viscous or imperfect fluids. The frictionless fluid has no existence in nature, but is hypothesized by mathematicians in order to facilitate the investigation of important laws and principles that may be approximately true of viscous or natural fluids.

Albert F. Zahm, 1912 (Professor of aeronautics, and developer of the first aeronautical laboratory in a U. S. university, The Catholic University of America)

3.1 Introduction and Road Map

The world of practical aviation was born on December 17, 1903, when, at 10:35 A. M., and in the face of cold, stiff, dangerous winds, Orville Wright piloted the Wright Flyer on its historic 12-s, 120-ft first flight. Figure 3.1 shows a photograph of the Wright Flyer at the instant of lift-off, with Wilbur Wright running along the right side of the machine, supporting the wing tip so that it will not drag the sand. This photograph is the most important picture in aviation history; the event it depicts launched the profession of aeronautical engineering into the mainstream of the twentieth century.1

I 1 See Reference 2 for historical details leading to the first flight by the Wright brothers.

Подпись: Figure 3.1 Historic photograph of the first successful heavier-than-air powered manned flight, achieved by the Wright brothers on December 17, 1903.
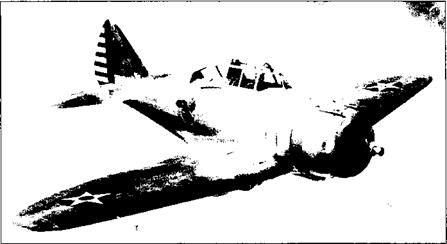
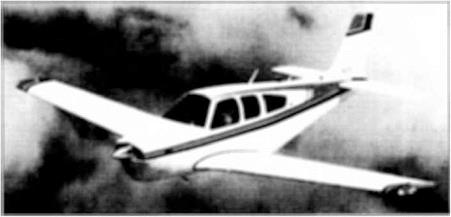
The flight velocity of the Wright Flyer was about 30 mi/h. Over the ensuing decades, the flight velocities of airplanes steadily increased. By means of more powerful engines and attention to drag reduction, the flight velocities of airplanes rose to approximately 300 mi/h just prior to World War II. Figure 3.2 shows a typical fighter airplane of the immediate pre-World War II era. From an aerodynamic point of view, at air velocities between 0 and 300 mi/h the air density remains essentially constant, varying by only a few percent. Hence, the aerodynamics of the family of airplanes spanning the period between the two photographs shown in Figures 3.1 and 3.2 could be described by incompressible flow. As a result, a huge bulk of experimental and theoretical aerodynamic results was acquired over the 40-year period beginning with the Wright Flyer—results that applied to incompressible flow. Today, we are still very interested in incompressible aerodynamics because most modern general aviation aircraft still fly at speeds below 300 mi/h; a typical light general aviation airplane is shown in Figure 3.3. In addition to low-speed aeronautical applications, the principles of incompressible flow apply to the flow of fluids, for example, water flow through pipes, the motion of submarines and ships through the ocean, the design of wind turbines (the modem term for windmills), and many other important applications.

For all the above reasons, the study of incompressible flow is as relevant today as it was at the time of the Wright brothers. Therefore, Chapters 3 to 6 deal exclusively with incompressible flow. Moreover, for the most part, we ignore any effects of friction, thermal conduction, or diffusion; that is, we deal with inviscid incompressible flow in these chapters.[5] Looking at our spectrum of aerodynamic flows as shown in Figure 1.38, the material contained in Chapters 3 to 6 falls within the combined blocks D and E.

image192

Figure 3.2 The Seversky P-35, fCourtesy of the U. S. Air Force.]

image193

Figure 3.3 The Beechcraft Bonanza F33A. (Courtesy of Beechcraft. j

The purpose of this chapter is to establish some fundamental relations applicable to inviscid, incompressible flows and to discuss some simple but important flow fields and applications. The material in this chapter is then used as a launching pad for the airfoil theory of Chapter 4 and the finite wing theory of Chapter 5.

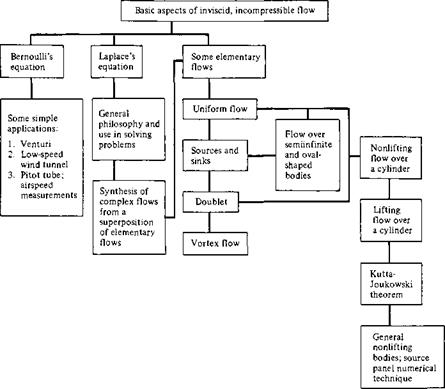
A road map for this chapter is given in Figure 3.4. There are three main avenues: (1) a development of Bernoulli’s equation, with some straightforward applications;

image194

Figure 3.4 Road map for Chapter 3.

(2) a discussion of Laplace’s equation, which is the governing equation for inviscid, incompressible, irrotational flow; (3) the presentation of some elementary flow pat­terns, how they can be superimposed to synthesize both the nonlifting and lifting flow over a circular cylinder, and how they form the basis of a general numerical technique, called the panel technique, for the solution of flows over bodies of general shape. As you progress through this chapter, occasionally refer to this road map so that you can maintain your orientation and see how the various sections are related.

. Lifting Flows over Arbitrary Bodies: The Vortex Panel Numerical Method

The thin airfoil theory described in Sections 4.7 and 4.8 is just what it says—it ap­plies only to thin airfoils at small angles of attack. (Make certain that you understand exactly where in the development of thin airfoil theory these assumptions are made and the reasons for making them.) The advantage of thin airfoil theory is that closed – form expressions are obtained for the aerodynamic coefficients. Moreover, the results compare favorably with experimental data for airfoils of about 12 percent thickness or less. However, the airfoils on many low-speed airplanes are thicker than 12 percent. Moreover, we are frequently interested in high angles of attack, such as occur during takeoff and landing. Finally, we are sometimes concerned with the generation of aerodynamic lift on other body shapes, such as automobiles or submarines. Hence, thin airfoil theory is quite restrictive when we consider the whole spectrum of aero­dynamic applications. We need a method that allows us to calculate the aerodynamic characteristics of bodies of arbitrary shape, thickness, and orientation. Such a method is described in this section. Specifically, we treat the vortex panel method, which is a numerical technique that has come into widespread use since the early 1970s. In reference to our road map in Figure 4.2, we now move to the left-hand branch. Also, since this chapter deals with airfoils, we limit our attention to two-dimensional bodies.

The vortex panel method is directly analogous to the source panel method de­scribed in Section 3.17. However, because a source has zero circulation, source panels are useful only for nonlifting cases. In contrast, vortices have circulation, and hence vortex panels can be used for lifting cases. (Because of the similarities between source and vortex panel methods, return to Section 3.17 and review the basic philosophy of the source panel method before proceeding further.)

The philosophy of covering a body surface with a vortex sheet of such a strength to make the surface a streamline of the flow was discussed in Section 4.4 We then went on to simplify this idea by placing the vortex sheet on the camber line of the airfoil as shown in Figure 4.11, thus establishing the basis for thin airfoil theory. We

now return to the original idea of wrapping the vortex sheet over the complete surface of the body, as shown in Figure 4.10. We wish to find у (s) such that the body surface becomes a streamline of the flow. There exists no closed-form analytical solution for y(s); rather, the solution must be obtained numerically. This is the purpose of the vortex panel method.

Let us approximate the vortex sheet shown in Figure 4.10 by a series of straight panels, as shown earlier in Figure 3.40. (In Chapter 3, Figure 3.40 was used to discuss source panels; here, we use the same sketch for discussion of vortex panels.) Let the vortex strength у (s) per unit length be constant over a given panel, but allow it to vary from one panel to the next. That is, for the n panels shown in Figure 3.40, the vortex panel strengths per unit length are y, y2,…, yj,…, y„. These panel strengths are unknowns; the main thrust of the panel technique is to solve for yj, j = 1 to n, such that the body surface becomes a streamline of the flow and such that the Kutta condition is satisfied. As explained in Section 3.17, the midpoint of each panel is a control point at which the boundary condition is applied; that is, at each control point, the normal component of the flow velocity is zero.

image347

Let P be a point located at (x, y) in the flow, and let rpj be the distance from any point on the yth panel to P, as shown in Figure 3.40. The radius rpl makes the angle 0Pj with respect to the. r axis. The velocity potential induced at P due to the y’th panel, Дг/),, is, from Equation (4.3),

In Equation (4.72), yj is constant over the y’th panel, and the integral is taken over the jth panel only. The angle 6PJ is given by

image348[4.73]

In turn, the potential at P due to all the panels is Equation (4.72) summed over all the panels:

image349[4.74]

Since point P is just an arbitrary point in the flow, let us put P at the control point of the ith panel shown in Figure 3.40. The coordinates of this control point are (*,-, уi). Then Equations (4.73) and (4.74) become

Подпись: and Подпись: [4.75]
Подпись: 6ij = tan

-і Уі – Уі Xi-Xj

Equation (4.75) is physically the contribution of all the panels to the potential at the control point of the ith panel.

At the control points, the normal component of the velocity is zero; this velocity is the superposition of the uniform flow velocity and the velocity induced by all the vortex panels. The component of VA normal to the / th panel is given by Equation (3.148):

V0o. n = V0C cos p, [3.148]

The normal component of velocity induced at (a, , v, ) by the vortex panels is

v„ = [4.76]

an.

Подпись: V„ Подпись: [4.77]
image351

Combining Equations (4.75) and (4.76), we have

where the summation is over all the panels. The normal component of the flow velocity at the ith control point is the sum of that due to the freestream [Equation (3.148)] and that due to the vortex panels [Equation (4.77)]. The boundary condition states that this sum must be zero:

Подпись: V 4_ у — о y 00.П і v П — Подпись: Voo cos p,image352[4.78]

Substituting Equations (3.148) and (4.77) into (4.78), we obtain

[4.79]

Equation (4.79) is the crux of the vortex panel method. The values of the integrals in Equation (4.79) depend simply on the panel geometry; they are not properties of the flow. Let Jij be the value of this integral when the control point is on the ith panel. Then Equation (4.79) can be written as

П

Езо cos p, – ~ Ji. j = 0 [4.80]

i=і 171

Equation (4.80) is a linear algebraic equation with n unknowns, jq, Y2- ■ ■ ■■ Yn• It represents the flow boundary condition evaluated at the control point of the ith panel. If Equation (4.80) is applied to the control points of all the panels, we obtain a system of n linear equations with n unknowns.

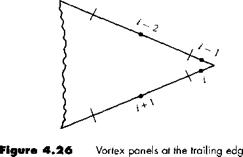
To this point, we have been deliberately paralleling the discussion of the source panel method given in Section 3.17; however, the similarity stops here. For the source panel method, the n equations for the n unknown source strengths are routinely solved, giving the flow over a nonlifting body. In contrast, for the lifting case with vortex panels, in addition to the n equations given by Equation (4.80) applied at all the panels, we must also satisfy the Kutta condition. This can be done in several ways. For example, consider Figure 4.26, which illustrates a detail of the vortex panel distribution at the trailing edge. Note that the length of each panel can be different; their length and distribution over the body are up to your discretion. Let the two panels at the trailing edge (panels і and і — 1 in Figure 4.26) be very small. The

image353

Kutta condition is applied precisely at the trailing edge and is given by у (ТЕ) = 0. To approximate this numerically, if points і and г — 1 are close enough to the trailing edge, we can write

Yi = ~Yi- [4.81]

such that the strengths of the two vortex panels і and і — 1 exactly cancel at the point where they touch at the trailing edge. Thus, in order to impose the Kutta condition on the solution of the flow, Equation (4.81) (or an equivalent expression) must be included. Note that Equation (4.80) evaluated at all the panels and Equation (4.81) constitute an overdetermined system of n unknowns with n + 1 equations. Therefore, to obtain a determined system, Equation (4.80) is not evaluated at one of the control points on the body. That is, we choose to ignore one of the control points, and we evaluate Equation (4.80) at the other n — 1 control points. This, in combination with Equation (4.81), now gives a system of n linear algebraic equations with n unknowns, which can be solved by standard techniques.

At this stage, we have conceptually obtained the values of y, y2,…, yn which make the body surface a streamline of the flow and which also satisfy the Kutta condition. In turn, the flow velocity tangent to the surface can be obtained directly from y. To see this more clearly, consider the airfoil shown in Figure 4.27. We are concerned only with the flow outside the airfoil and on its surface. Therefore, let the velocity be zero at every point inside the body, as shown in Figure 4.27. In particular, the velocity just inside the vortex sheet on the surface is zero. This corresponds to U2 = 0 in Equation (4.8). Hence, the velocity just outside the vortex sheet is, from Equation (4.8),

у = U — U2 = U — 0 = Ml

In Equation (4.8), и denotes the velocity tangential to the vortex sheet. In terms of the picture shown in Figure 4.27, we obtain Va = ya at point а, V/, = yh at point b, etc. Therefore, the local velocities tangential to the airfoil surface are equal to the local values of у. In turn, the local pressure distribution can be obtained from Bernoulli’s equation.

The total circulation and the resulting lift are obtained as follows. Let sj be the length of the yth panel. Then the circulation due to the у th panel is y, s r In turn, the

image354

Figure 4.27 Airfoil as a solid body, with zero velocity inside the profile.

total circulation due to all the panels is

n

г = &л [4-821

./=1

Hence, the lift per unit span is obtained from

П

L’ = Poo Too y. isJ [4.83]

./=>

The presentation in this section is intended to give only the general flavor of the vortex panel method. There are many variations of the method in use today, and you are encouraged to read the modem literature, especially as it appears in the A/A4 Journal and the Journal of Aircraft since 1970. The vortex panel method as described in this section is termed a “first-order” method because it assumes a constant value of у over a given panel. Although the method may appear to be straightforward, its numerical implementation can sometimes be frustrating. For example, the results for a given body are sensitive to the number of panels used, their various sizes, and the way they are distributed over the body surface (i. e., it is usually advantageous to place a large number of small panels near the leading and trailing edges of an airfoil and a smaller number of larger panels in the middle). The need to ignore one of the control points in order to have a determined system in n equations for n unknowns also introduces some arbitrariness in the numerical solution. Which control point do you ignore? Different choices sometimes yield different numerical answers for the distribution of у over the surface. Moreover, the resulting numerical distributions for у are not always smooth, but rather, they have oscillations from one panel to the next as a result of numerical inaccuracies. The problems mentioned above are usually overcome in different ways by different groups who have developed relatively sophisticated panel programs for practical use. For example, what is more common today is to use a combination of both source and vortex panels (source panels to basically simulate the airfoil thickness and vortex panels to introduce circulation) in a panel solution. This combination helps to mitigate some of the practical numerical problems just discussed. Again, you are encouraged to consult the literature for more information.

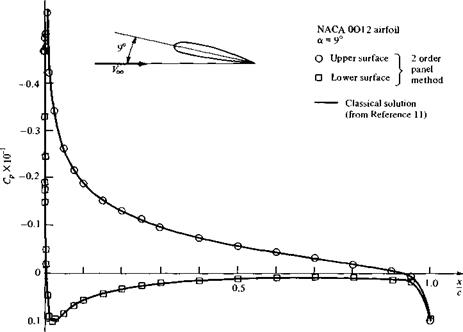
Such accuracy problems have also encouraged the development of higher-order panel techniques. For example, a “second-order” panel method assumes a linear variation of у over a given panel, as sketched in Figure 4.28. Here, the value of у at the edges of each panel is matched to its neighbors, and the values y, y2, уз, etc. at the boundary points become the unknowns to be solved. The flow-tangency boundary condition is still applied at the control point of each panel, as before. Some results using a second-order vortex panel technique are given in Figure 4.29, which shows

image355

Figure 4.28 Linear distribution of у over each panel—a second-order panel method.

image356

Figure 4.29 Pressure coefficient distribution over an NACA 0012 airfoil; comparison

between second-order vortex panel method and NACA theoretical results from Reference 1 1. The numerical panel results were obtained by one of the author’s graduate students, Mr. Tae-Hwan Cho.

the distribution of pressure coefficients over the upper and lower surfaces of an NACA 0012 airfoil at a 9° angle of attack. The circles and squares are numerical results from a second-order vortex panel technique developed at the University of Maryland, and the solid lines are from NACA results given in Reference 11. Excellent agreement is obtained.

Again, you are encouraged to consult the literature before embarking on any serious panel solutions of your own. For example, Reference 14 is a classic paper on panel methods, and Reference 15 highlights many of the basic concepts of panel methods along with actual computer program statement listings for simple applica­tions. Reference 66 is a modern compilation of papers, several of which deal with current panel techniques. Finally, Katz and Plotkin (Reference 67) give perhaps the most thorough discussion of panel techniques and their foundations to date.

Normal Shock Waves. and Related Topics

Shock wave: A large-amplitude compression wave, such as that produced by an explosion, caused by supersonic motion of a body in a medium.

From the American Heritage Dictionary of the English Language, 1969

8.1 Introduction

The purpose of this chapter and Chapter 9 is to develop shock-wave theory, thus giving us the means to calculate the changes in the flow properties across a wave. These changes were discussed qualitatively in Section 7.6; make certain that you are familiar with these changes before continuing.

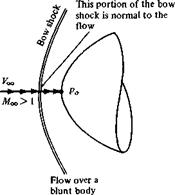
The focus of this chapter is on normal shock waves, as sketched in Figure lAb. At first thought, a shock wave that is normal to the upstream flow may seem to be a very special case—and therefore a case of little practical interest—but nothing could be further from the truth. Normal shocks occur frequently in nature. Two such ex­amples are sketched in Figure 8.1; there are many more. The supersonic flow over a blunt body is shown at the left of Figure 8.1. Here, a strong bow shock wave exists in front of the body. (We study such bow shocks in Chapter 9.) Although this wave is curved, the region of the shock closest to the nose is essentially nor­mal to the flow. Moreover, the streamline that passes through this normal portion of the bow shock later impinges on the nose of the body and controls the values

image522

Figure 8.1 Two examples where normal shock waves are of interest.


Normal shock inside the nozzle

image523

Overexpanded flow through a nozzle


of stagnation (total) pressure and temperature at the nose. Since the nose region of high-speed blunt bodies is of practical interest in the calculation of drag and aerodynamic heating, the properties of the flow behind the normal portion of the shock wave take on some importance. In another example, shown at the right of Figure 8.1, supersonic flow is established inside a nozzle (which can be a super­sonic wind tunnel, a rocket engine, etc.) where the back pressure is high enough to cause a normal shock wave to stand inside the nozzle. (We discuss such “over­expanded” nozzle flows in Chapter 10.) The conditions under which this shock wave will occur and the determination of flow properties at the nozzle exit down­stream of the normal shock are both important questions to be answered. In sum­mary, for these and many other applications, the study of normal shock waves is important.

Finally, we will find that many of the normal shock relations derived in this chapter carry over directly to the analysis of oblique shock waves, as discussed in Chapter 9. So once again, time spent on normal shock waves is time well spent.

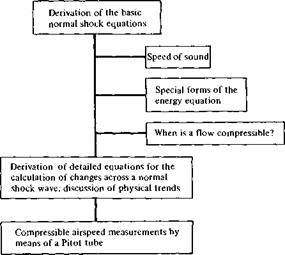
The road map for this chapter is given in Figure 8.2. As you can see, our objectives are fairly short and straightforward. We start with a derivation of the basic continuity, momentum, and energy equations for normal shock waves, and then we employ these basic relations to obtain detailed equations for the calculation of flow properties across the shock wave. In addition, we emphasize the physical trends indicated by the equations. On the way toward this objective, we take three side streets having to do with (1) the speed of sound, (2) special forms of the energy equation, and (3) a further discussion of the criteria used to judge when a flow must be treated as compressible. Finally, we apply the results of this chapter to the measurement of airspeed in a compressible flow using a Pitot tube. Keep the road map in Figure 8.2 in mind as you progress through the chapter.

image524

Figure 8.2 Road map for Chapter 8.

Specification of the Flow Field

In Section 2.2.3 we defined both scalar and vector fields. We now apply this concept of a field more directly to an aerodynamic flow. One of the most straightforward ways of describing the details of an aerodynamic flow is simply to visualize the flow in three-dimensional space, and to write the variation of the aerodynamic properties as a function of space and time. For example, in cartesian coordinates the equations

P = p(x, y, z, t) [2.33a]

p = p(x, y,z, t) [2.33b]

T = T(x, y, z, t) [2.33c]

and V = ui + vj + iuk [2.34a]

where и = u(x, y,z, t) [2.34b]

v = v(x, y,z, t) [2.34c]

w = w(x, y,z, t) [2.34<f]

represent the flow field. Equations (2.33a-c) give the variation of the scalar flow field variables pressure, density, and temperature, respectively. (In equilibrium thermody­namics, the specification of two state variables, such as p and p, uniquely defines the values of all other state variables, such as T. In this case, one of Equations (2.33) can be considered redundant.) Equations (ІЗАа-d) give the variation of the vector flow field variable velocity V, where the scalar components of V in the x, y. and г directions are u, v, and w, respectively.

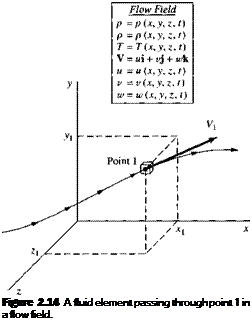
Figure 2.14 illustrates a given fluid element moving in a flow field specified by Equations (2.33) and (2.34). At the time t, the fluid element is at point 1, located at (xi, yi, zi) as shown in Figure 2.14.

At this instant, its velocity is V i and its pressure is given by

p = p(xi, y,z,t)

and similarly for its other flow variables.

By definition, an unsteady flow is one where the flow field variables at any given point are changing with time. For example, if you lock your eyes on point 1 in

Figure 2.14, and keep them fixed on point 1, if the flow is unsteady you will observe p, p, etc. fluctuating with time. Equations (2.33) and (2.34) describe an unsteady flow field because time t is included as one of the independent variables. In contrast, a steady flow is one where the flow field variables at any given point are invariant with time, that is, if you lock your eyes on point 1 you will continuously observe the same constant values for p, p, V etc. for all time. A steady flow field is specified by the relations

p = p(x, y,z) p = p(x, y,z) etc.

The concept of the flow field, and a specified fluid element moving through it as illustrated in Figure 2.14, will be revisited in Section 2.9 where we define and discuss the concept of the substantial derivative.

Подпись: Example 2.1

Подпись: Figure 2.14 A fluid element passing through point 1 in a flow field.

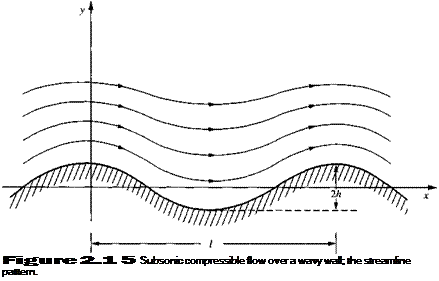
The subsonic compressible flow over a cosine-shaped (wavy) wall is illustrated in Figure 2.15. The wavelength and amplitude of the wall are l and h, respectively, as shown in Figure 2.15. The streamlines exhibit the same qualitative shape as the wall, but with diminishing amplitude as distance above the wall increases. Finally, as у —у oo, the streamline becomes straight. Along this straight streamline, the freestream velocity and Mach number are and M^,

Подпись: Figure 2.1 5 Subsonic compressible flow over a wavy wall; the streamline pattern.

Streamline at <»

Подпись: and Specification of the Flow Field Specification of the Flow Field

respectively. The velocity field in cartesian coordinates is given by

where p = У1 —

Consider the particular flow that exists for the case where і = 1.0 m, h = 0.01 m, = 240 m/s, and = 0.7. Also, consider a fluid element of fixed mass moving along a streamline in the flow field. The fluid element passes through the point (x/i, y/t) = (J, 1). At this point, calculate the time rate of change of the volume of the fluid element, per unit volume.

Solution

From Section 2.3.4, we know that the time rate of change of the volume of a moving fluid element of fixed mass, per unit volume, is given by the divergence of the velocity V • V. In

12,411

Equation (2.41) gives the time rate of change of the volume of the fluid element, per unit volume, as it passes through the point (x/i, у ft) = (j, 1). Note that it is a finite (nonzero) value; the volume of the fluid element is changing as it moves along the streamline. This is consistent with the definition of a compressible flow, where the density is a variable and hence the volume of a fixed mass must also be variable. Note from Equation (2.40) that V • V = 0 only along vertical lines denoted by x/l = 0, j, 1, 1 ^,…, where the sin(2jrx/£) goes to zero. This is a peculiarity associated with the cyclical nature of the flow field over the cosine-shaped wall. For the particular flow considered here, where і = 1.0 m, h = 0.01 m, Vx = 240 m/s, and Мы = 0.7, where

P = 7l – Ml = Vl – (0.7)2 = 0.714

Equation (2.41) yields

Подпись: -0.7327 s'1V • V = ^0.714 – (240)(0.01) e-2*<0’714) =
The physical significance of this result is that, as the fluid element is passing through the point (f, 1) in the flow, it is experiencing a 73 percent rate of decrease of volume per second (the negative quantity denotes a decrease in volume). That is, the density of the fluid element is increasing. Hence, the point (і, 1) is in a compression region of the flow, where the fluid element will experience a decrease in density. Expansion regions are defined by values of x 11 which yield negative values of the sine function in Equation (2.40), which in turn yields a positive value for V • V, which gives an increase in volume of the fluid element, hence a de­crease in density. Clearly, as the fluid element continues its path through this flow field, it experiences cyclical increases and decreases in density, as well as the other flow field properties.

Combination of a Uniform Flow with a Source and Sink

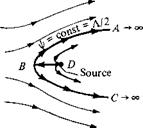
Consider a polar coordinate system with a source of strength Л located at the origin. Superimpose on this flow a uniform stream with velocity Vx moving from left to right, as sketched in Figure 3.22. The stream function for the resulting flow is the sum of Equations (3.57) and (3.72):

i/r = Loor sin в H—- 0 [3.74]

2тт

Since both Equations (3.57) and (3.72) are solutions of Laplace’s equation, we know that Equation (3.74) also satisfies Laplace’s equation; that is, Equation (3.74) de­scribes a viable irrotational, incompressible flow. The streamlines of the combined flow are obtained from Equation (3.74) as

jf = Vxr sin0 H—– в = const [3.75]

2jt

The resulting streamline shapes from Equation (3.75) are sketched at the right of Figure 3.22. The source is located at point D. The velocity field is obtained by

image237

Ф = looT sin в + в


+


Uniform stream


Source

image236


ф = Voor sin в


Combination of a Uniform Flow with a Source and Sink

Figure 3.22 Superposition of a uniform flow and a source; flow over a semi-infinite body.

differentiating Equation (3.75):

Подпись: A 2nr Подпись: [3.76]1 дф

Vr =——– = Voo cos в +

Подпись: and Подпись: Ve = = -VooSin0 dr Подпись: [3.77]

r dO

Note from Section 3.10 that the radial velocity from a source is А/2л r, and from Section 3.9 the component of the freestream velocity in the radial direction is Voo cos в. Hence, Equation (3.76) is simply the direct sum of the two velocity fields—a result which is consistent with the linear nature of Laplace’s equation. Therefore, not only can we add the values of ф or r/r to obtain more complex solutions, we can add their derivatives, that is, the velocities, as well.

The stagnation points in the flow can be obtained by setting Equations (3.76) and

(3.77)

Подпись: and Combination of a Uniform Flow with a Source and Sink Combination of a Uniform Flow with a Source and Sink

equal to zero:

Solving for r and в, we find that one stagnation point exists, located at (г, в) = (A/2jrV00, tt), which is labeled as point В in Figure 3.22. That is, the stagnation point is a distance (A/2jrV0O) directly upstream of the source. From this result, the distance DB clearly grows smaller if is increased and larger if A is increased— trends that also make sense based on intuition. For example, looking at Figure 3.22, you would expect that as the source strength is increased, keeping the same, the stagnation point В will be blown further upstream. Conversely, if V-y_ is increased, keeping the source strength the same, the stagnation point will be blown further downstream.

If the coordinates of the stagnation point at В are substituted into Equation (3.75), we obtain

Л

sin ті H—— tt = const

2 tt


image238

image239

Hence, the streamline that goes through the stagnation point is described by ijr = A/2. This streamline is shown as curve ABC in Figure 3.22.

Examining Figure 3.22, we now come to an important conclusion. Since we are dealing with inviscid flow, where the velocity at the surface of a solid body is tangent to the body, then any streamline of the combined flow at the right of Figure 3.22 could be replaced by a solid surface of the same shape. In particular, consider the streamline ABC. Because it contains the stagnation point at B, the streamline ABC is a dividing streamline; that is, it separates the fluid coming from the freestream and the fluid emanating from the source. All the fluid outside ABC is from the freestream, and all the fluid inside ABC is from the source. Therefore, as far as the freestream is concerned, the entire region inside ABC could be replaced with a solid body of the same shape, and the external flow, that is, the flow from the freestream, would not feel the difference. The streamline xfr — A/2 extends downstream to infinity, forming a semi-infinite body. Therefore, we are led to the following important interpretation. If we want to construct the flow over a solid semi-infinite body described by the curve ABC as shown in Figure 3.22, then all we need to do is take a uniform stream with velocity Voc and add to it a source of strength Л at point D. The resulting superposition will then represent the flow over the prescribed solid semi-infinite body of shape ABC. This illustrates the practicality of adding elementary flows to obtain a more complex flow over a body of interest.

The superposition illustrated in Figure 3.22 results in the flow over the semi­infinite body ABC. This is a half-body that stretches to infinity in the downstream direction (i. e., the body is not closed). However, if we take a sink of equal strength as the source and add it to the flow downstream of point D, then the resulting body shape will be closed. Let us examine this flow in more detail.

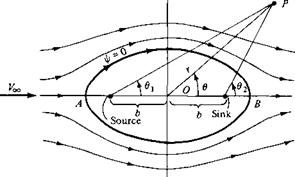
Consider a polar coordinate system with a source and sink placed a distance b to the left and right of the origin, respectively, as sketched in Figure 3.23. The strengths of the source and sink are A and —A, respectively (equal and opposite). In addition, superimpose a uniform stream with velocity Ex,, as shown in Figure 3.23. The stream function for the combined flow at any point P with coordinates (г. 0) is obtained from Equations (3.57) and (3.72):

A A

if = ExT Sin0 + —01 – —02 2л 2л

or if = Vxr sin 0 + — (01 – 02) [3.80]

The velocity field is obtained by differentiating Equation (3.80) according to Equa­tions (2.151a and b). Note from the geometry of Figure 3.23 that 0] and 02 in Equation (3.80) are functions of r, 0, and b. In turn, by setting V = 0, two stagnation points are found, namely, points A and В in Figure 3.23. These stagnation points are located

image240

Figure 3.23 Superposition of a uniform flow and a

source-sink pair; flow over a Rankine oval.

such that (see Problem 3.13)

J.b

О A — OB = b2 [3.81]

V ^Voo

The equation of the streamlines is given by Equation (3.80) as

Л r,

ф = V^r sin 0 H——- (0i — 02) = const [3.82]

2ix

The equation of the specific streamline going through the stagnation points is obtained from Equation (3.82) by noting that 0 = 0; = 02 = 7Г at point A and 0 = 0i = 02 = 0 at point B. Hence, for the stagnation streamline, Equation (3.82) yields a value of zero for the constant. Thus, the stagnation streamline is given by = 0, that is,

Л r,

Voor sin0 H——- (0i — 02) = 0 [3.83]

2tt

the equation of an oval, as sketched in Figure 3.23. Equation (3.83) is also the dividing streamline; all the flow from the source is consumed by the sink and is contained entirely inside the oval, whereas the flow outside the oval has originated with the uniform stream only. Therefore, in Figure 3.23, the region inside the oval can be replaced by a solid body with the shape given by т/r = 0, and the region outside the oval can be interpreted as the inviscid, potential (irrotational), incompressible flow over the solid body. This problem was first solved in the nineteenth century by the famous Scottish engineer W. J. M. Rankine; hence, the shape given by Equation (3.83) and sketched in Figure 3.23 is called a Rankine oval.

A Numerical Nonlinear Lifting-Line Method

The classical Prandtl lifting-line theory described in Section 5.3 assumes a linear vari­ation of с/ versus aeff. This is clearly seen in Equation (5.19). However, as the angle of attack approaches and exceeds the stall angle, the lift curve becomes nonlinear, as shown in Figure 4.4. This high-angle-of-attack regime is of interest to modern aero – dynamicists. For example, when an airplane is in a spin, the angle of attack can range from 40 to 90°; an understanding of high-angle-of-attack aerodynamics is essential to the prevention of such spins. In addition, modern fighter airplanes achieve optimum maneuverability by pulling high angles of attack at subsonic speeds. Therefore, there are practical reasons for extending Prandtl’s classical theory to account for a nonlinear lift curve. One simple extension is described in this section.

The classical theory developed in Section 5.4 is essentially closed form; that is, the results are analytical equations as opposed to a purely numerical solution. Of course, in the end, the Fourier coefficients A„ for a given wing must come from a solution of a system of simultaneous linear algebraic equations. Until the advent of the modern digital computer, these coefficients were calculated by hand. Today, they are readily solved on a computer using standard matrix methods. However, the elements of the lifting-line theory lend themselves to a straightforward purely numerical solution which allows the treatment of nonlinear effects. Moreover, this
numerical solution emphasizes the fundamental aspects of lifting-line theory. For these reasons, such a numerical solution is outlined in this section.

Consider the most general case of a finite wing of given planform and geometric twist, with different airfoil sections at different spanwise stations. Assume that we have experimental data for the lift curves of the airfoil sections, including the nonlinear regime (i. e., assume we have the conditions of Figure 4.4 for all the given airfoil sections). A numerical iterative solution for the finite-wing properties can be obtained as follows:

1. Divide the wing into a number of spanwise stations, as shown in Figure 5.26. Here к + 1 stations are shown, with n designating any specific station.

2. For the given wing at a given a, assume the lift distribution along the span; that is, assume values for Г at all the stations Г і, Г2,…, Г„,…, Г*+1. An elliptical lift distribution is satisfactory for such an assumed distribution.

3.

Подпись: Оіі(Уп) Подпись: 1 ґ2 (dT/dy)dy 4л- Foo J_b/2 Уп-У Подпись: [5.75]

With this assumed variation of Г, calculate the induced angle of attack a, from Equation (5.18) at each of the stations:

The integral is evaluated numerically. If Simpson’s rule is used, Equation (5.75) becomes

Подпись: ОіііУп)1 Ay ул (dr/dy)j_i | ^ (dr/dy)j | {dr/dy)j+l [5 y6] 4nVoc 3 j^6(yn ~ У]-) Уп-Уі Уп-yj+i ‘

where Ay is the distance between stations. In Equation (5.76), when yn = yj-1, у,, or yj+1, a singularity occurs (a denominator goes to zero). When this singularity occurs, it can be avoided by replacing the given term by its average value based on the two adjacent sections.

4. Using a, from step 3, obtain the effective angle of attack o^ff at each station from

aeff(y«) = a – a,(y„)

5.

image439

With the distribution of o^ff calculated from step 4, obtain the section lift coeffi­cient (c/)„ at each station. These values are read from the known lift curve for the airfoil.

Figure 5.26 Stations along the span for a numerical solution.

6. From (c;)„ obtained in step 5, a new circulation distribution is calculated from the Kutta-Joukowski theorem and the definition of lift coefficient:

^ (У«) = Рэо^эсГСУл) = 2 Poo (u)«

Hence, nj„) = iy00c„(c,)„

where c„ is the local section chord. Keep in mind that in all the above steps, n ranges from 1 to к + 1.

7. The new distribution of Г obtained in step 6 is compared with the values that were initially fed into step 3. If the results from step 6 do not agree with the input to step 3, then a new input is generated. If the previous input to step 3 is designated as Told and the result of step 6 is designated as rnew, then the new input to step 3 is determined from

Подпись: input= Told + £(Tnew — Told)

where D is a damping factor for the iterations. Experience has found that the iterative procedure requires heavy damping, with typical values of D on the order of 0.05.

8. Steps 3 to 7 are repeated a sufficient number of cycles until Tnew and Told agree at each spanwise station to within acceptable accuracy. If this accuracy is stipulated to be within 0.01 percent for a stretch of five previous iterations, then a minimum of 50 and sometimes as many as 150 iterations may be required for convergence.

9. From the converged Г (у), the lift and induced drag coefficients are obtained from Equations (5.26) and (5.30), respectively. The integrations in these equations can again be carried out by Simpson’s rule.

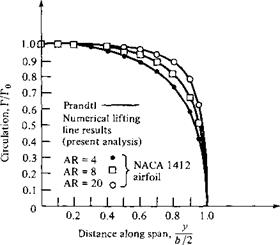
The procedure outlined above generally works smoothly and quickly on a high­speed digital computer. Typical results are shown in Figure 5.27, which shows the circulation distributions for rectangular wings with three different aspect ratios. The solid lines are from the classical calculations of Prandtl (Section 5.3), and the symbols are from the numerical method described above. Excellent agreement is obtained, thus verifying the integrity and accuracy of the numerical method. Also, Figure 5.27 should be studied as an example of typical circulation distributions over general finite wings, with Г reasonably high over the center section of the wing but rapidly dropping to zero at the tips.

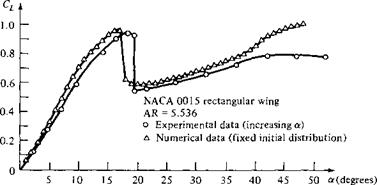
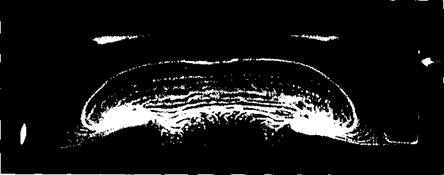
An example of the use of the numerical method for the nonlinear regime is shown in Figure 5.28. Here, Cl versus a is given for a rectangular wing up to an angle of attack of 50°—well beyond stall. The numerical results are compared with existing experimental data obtained at the University of Maryland (Reference 19). The numerical lifting-line solution at high angle of attack agrees with the experiment to within 20 percent, and much closer for many cases. Therefore, such solutions given reasonable preliminary engineering results for the high-angle-of-attack poststall region. However, it is wise not to stretch the applicability of lifting-line theory too far. At high angles of attack, the flow is highly three-dimensional. This is clearly seen in the surface oil pattern on a rectangular wing at high angle of attack shown in Figure

image440

Figure 5.27 Lift distribution for a rectangular wing;

comparison between Prandtl’s classical theory and the numerical lifting-line method of Reference 20.

image441

Figure 5.28 Lift coefficient versus angle of attack; comparison between experimental and numerical results.

5.29. At high a, there is a strong spanwise flow, in combination with mushroom­shaped flow separation regions. Clearly, the basic assumptions of lifting-line theory, classical or numerical, cannot properly account for such three-dimensional flows.

For more details and results on the numerical lifting-line method, please see Reference 20.

image442

Figure 5.29 Surface oil flow pattern on a stalled, finite rectangular wing with a Clark Y-14 airfoil section. AR = 3.5, a = 22.8°, Re = 245,000 (based on chord length). This pattern was established by coating the wing surface with pigmented mineral oil and inserting the model in a low-speed subsonic wind tunnel. In the photograph shown, flow is from top to bottom. Note the highly three-dimensional flow pattern. (Courte$y of Allen E. Winkelmann, University of Maryland.}