Category Fundamentals of Aerodynamics

How Do We Solve the Equations?

This chapter is full of mathematical equations—equations that represent the basic physical fundamentals that dictate the characteristics of aerodynamic flow fields. For the most part, the equations are either in partial differential form or integral form. These equations are powerful and by themselves represent a sophisticated intellectual construct of our understanding of the fundamentals of a fluid flow. However, the equations by themselves are not very practical. They must be solved in order to obtain the actual flow fields over specific body shapes with specific flow conditions. For example, if we are interested in calculating the flow field around a Boeing 777 jet transport flying at a velocity of 800 ft/s at an altitude of 30,000 ft, we have to obtain a solution of the governing equations for this case—a solution that will give us the results for the dependent flow-field variables p, p, V, etc. as a function of the independent variables of spatial location and time. Then we have to squeeze this solution for extra practical information, such as lift, drag, and moments exerted on the vehicle. How do we do this? The purpose of the present section is to discuss two philosophical answers to this question. As for practical solutions to specific problems of interest, there are literally hundreds of different answers to this question, many of which make up the content of the rest of this book. However, all these solutions fall under one or the other of the two philosophical approaches described next.

Classical Thin Airfoil Theory: The Symmetric Airfoil

Some experimentally observed characteristics of airfoils and a philosophy for the theoretical prediction of these characteristics have been discussed in the preceding sections. Referring to our chapter road map in Figure 4.2, we have now completed the central branch. In this section, we move to the right-hand branch of Figure 4.2, namely a quantitative development of thin airfoil theory. The basic equations necessary for the calculation of airfoil lift and moments are established in this section, with an application to symmetric airfoils. The case of cambered airfoils will be treated in Section 4.8.

For the time being, we deal with thin airfoils; for such a case, the airfoil can be simulated by a vortex sheet placed along the camber line, as discussed in Section 4.4. Our purpose is to calculate the variation of у (s) such that the camber line becomes a streamline of the flow and such that the Kutta condition is satisfied at the trailing edge; that is, у (ТЕ) = 0 [see Equation (4.10)]. Once we have found the particular y(s) that satisfies these conditions, then the total circulation Г around the airfoil is found by integrating y(s) from the leading edge to the trailing edge. In turn, the lift is calculated from Г via the Kutta-Joukowski theorem.

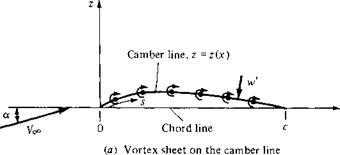
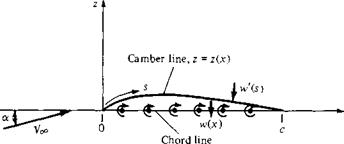
Consider a vortex sheet placed on the camber line of an airfoil, as sketched in Figure 4.17a. The freestream velocity is Voo, and the airfoil is at the angle of attack a. The x axis is oriented along the chord line, and the z axis is perpendicular to the chord. The distance measured along the camber line is denoted by 5. The shape of the camber line is given by z = z(x). The chord length is c. In Figure 4.17a, w’ is the component of velocity normal to the camber line induced by the vortex sheet; w’ = w'(s). For a thin airfoil, we rationalized in Section 4.4 that the distribution of a vortex sheet over the surface of the airfoil, when viewed from a distance, looks almost the same as a vortex sheet placed on the camber line. Let us stand back once again and view Figure 4.17a from a distance. If the airfoil is thin, the camber line is close to the

image322

image323

(b) Vortex sheet on the chord line Figure 4.1 7 Placement of the vortex sheet for thin airfoil analysis.

chord line, and viewed from a distance, the vortex sheet appears to fall approximately on the chord line. Therefore, once again, let us reorient our thinking and place the vortex sheet on the chord line, as sketched in Figure 4.17b. Here, у = у (дг). We still wish the camber line to be a streamline of the flow, and у = y(x) is calculated to satisfy this condition as well as the Kutta condition y(c) = 0. That is, the strength of the vortex sheet on the chord line is determined such that the camber line (not the chord line) is a streamline.

For the camber line to be a streamline, the component of velocity normal to the camber line must be zero at all points along the camber line. The velocity at any point in the flow is the sum of the uniform freestream velocity and the velocity induced by the vortex sheet. Let V^,, be the component of the freestream velocity normal to the camber line. Thus, for the camber line to be a streamline,

Voc. n + u/(.v) = 0 [4.12]

at every point along the camber line.

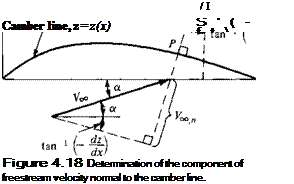
An expression for Vco. n in Equation (4.12) is obtained by the inspection of Fig­ure 4.18. At any point P on the camber line, where the slope of the camber line is

z


/1

/I

/ I


Classical Thin Airfoil Theory: The Symmetric Airfoil

Classical Thin Airfoil Theory: The Symmetric Airfoil

dz/dx, the geometry of Figure 4.18 yields

Подпись: Voo.n = So sin a + tanimage325[4.13]

For a thin airfoil at small angle of attack, both a and tan-1 (—dz/dx) are small values. Using the approximation that sin в ~ tan 0 яа 9 for small 9, where 9 is in radians, Equation (4.13) reduces to

image326[4.14]

Equation (4.14) gives the expression for to be used in Equation (4.12). Keep in mind that, in Equation (4.14), a is in radians.

Returning to Equation (4.12), let us develop an expression for w'(s) in terms of the strength of the vortex sheet. Refer again to Figure 4.17b. Here, the vortex sheet is along the chord line, and w'(s) is the component of velocity normal to the camber line induced by the vortex sheet. Let w(x) denote the component of velocity normal to the chord line induced by the vortex sheet, as also shown in Figure 4.17Й. If the airfoil is thin, the camber line is close to the chord line, and it is consistent with thin airfoil theory to make the approximation that

Подпись: [4.15]w'(s) ЯИ w(x)

An expression for w(x) in terms of the strength of the vortex sheet is easily obtained from Equation (4.1), as follows. Consider Figure 4.19, which shows the vortex sheet along the chord line. We wish to calculate the value of w(x) at the location*. Consider an elemental vortex of strength у d% located at a distance f from the origin along the chord line, as shown in Figure 4.19. The strength of the vortex sheet у varies with

z


* w

£—0-^0—О – e—e4-e—0-

Figure 4.1 9 Calculation of the induced velocity at the chord line.

the distance along the chord; that is, у = у (£). The velocity dw at point x induced by the elemental vortex at point § is given by Equation (4.1) as

Подпись: [4.16]Y<M)dS

2tz (x — I)

Подпись: w(x) = Подпись: Г У (£)<*$ о 2n(x-%) Подпись: [4.17]

In turn, the velocity w(x) induced at point x by all the elemental vortices along the chord line is obtained by integrating Equation (4,16) from the leading edge (£ = 0) to the trailing edge (| = c):

Combined with the approximation stated by Equation (4.15), Equation (4.17) gives the expression for w'(s) to be used in Equation (4.12).

Подпись: or Подпись: [4.18]
image327

Recall that Equation (4.12) is the boundary condition necessary for the camber line to be a streamline. Substituting Equations (4.14), (4.15), and (4.17) into (4.12), we obtain

the fundamental equation of thin airfoil theory, it is simply a statement that the camber line is a streamline of the flow.

Note that Equation (4.18) is written at a given point x on the chord line, and that dz/dx is evaluated at that point x. The variable § is simply a dummy variable of integration which varies from 0 to c along the chord line, as shown in Figure 4.19. The vortex strength у = у (|) is a variable along the chord line. For a given airfoil at a given angle of attack, both a and dz/dx are known values in Equation (4.18). Indeed, the only unknown in Equation (4.18) is the vortex strength y(£). Hence, Equation (4.18) is an integral equation, the solution of which yields the variation of у (I) such that the camber line is a streamline of the flow. The central problem of

thin airfoil theory is to solve Equation (4.18) for у (f), subject to the Kutta condition, namely, y(c) = 0.

In this section, we treat the case of a symmetric airfoil. As stated in Section 4.2, a symmetric airfoil has no camber; the camber line is coincident with the chord line. Hence, for this case, dz/dx = 0, and Equation (4.18) becomes

Classical Thin Airfoil Theory: The Symmetric Airfoil

[4.19]


In essence, within the framework of thin airfoil theory, a symmetric airfoil is treated the same as a flat plate; note that our theoretical development does not account for the airfoil thickness distribution. Equation (4.19) is an exact expression for the inviscid, incompressible flow over a flat plate at angle of attack.

To help deal with the integral in Equations (4.18) and (4.19), let us transform f into 0 via the following transformation;

£ = ^(1 — cos 0) [4.20]

Since x is a fixed point in Equations (4.18) and (4.19), it corresponds to a particular value of 0, namely, 0q, such that

Подпись: COS во)image328[4.21]

Also, from Equation (4.20),

Подпись: [4.22]– sin в dd 2

Substituting Equations (4.20) to (4.22) into (4.19), and noting that the limits of inte­gration become в = 0 at the leading edge (where £ = 0) and в = л at the trailing edge (where £ = c), we obtain

1 Подпись: [4.23]f71 y(e)sine dd

2л Jo cos в — cos e0

A rigorous solution of Equation (4.23) for у (в) can be obtained from the mathematical theory of integral equations, which is beyond the scope of this book. Instead, we simply state that the solution is

Classical Thin Airfoil Theory: The Symmetric Airfoil

[4.24]


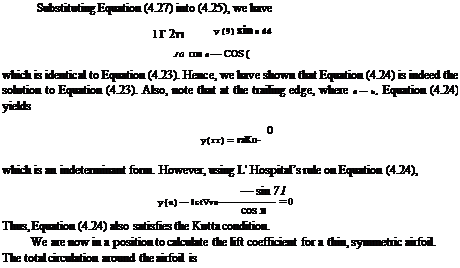
We can verify this solution by substituting Equation (4.24) into (4.23) yielding

Classical Thin Airfoil Theory: The Symmetric Airfoil

Подпись: Л sin «00 sin 00 cosпв dd
о cos в — cos во

Using Equation (4.26) in the right-hand side of Equation (4.25), we find that

Eoo a f71 (1+cos 6)d6 V^a / f71 d0 f71 cos Odd

Jo cos в – cos 90 7t Jo

Classical Thin Airfoil Theory: The Symmetric Airfoil

COS в — COS во


71


Classical Thin Airfoil Theory: The Symmetric Airfoil

Jo


[4.28]


Using Equations (4.20) and (4.22), Equation (4.28) transforms to

Г = – f у (в) sin в dd 2 Jo

Substituting Equation (4.24) into (4.29), we obtain

Г = acVoo / (1 +cos0) dd = TtacVoo Jo


[4.29]


[4.30]


Substituting Equation (4.30) into the Kutta-Joukowski theorem, we find that the lift per unit span is


L’ = РсоУсоГ = nacpocV^


[4.31]


The lift coefficient is


Classical Thin Airfoil Theory: The Symmetric Airfoil

Substituting Equation (4.31) into (4.32), we have _ тгасрорУ^

1 і Pocked)

Подпись: [4.33]Подпись:

Classical Thin Airfoil Theory: The Symmetric Airfoil Подпись: 2л Подпись: [4.34] Подпись: Lift slope :

сі = 2ла

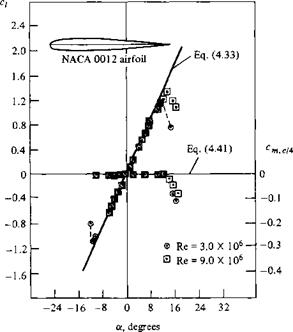
Equations (4.33) and (4.34) are important results; they state the theoretical result that the lift coefficient is linearly proportional to angle of attack, which is supported by the experimental results discussed in Section 4.3. They also state that the theoret­ical lift slope is equal to 2л rad-1, which is 0.11 degree-1. The experimental lift coefficient data for an NACA 0012 symmetric airfoil are given in Figure 4.20; note that Equation (4.33) accurately predicts с/ over a large range of angle of attack. (The NACA 0012 airfoil section is commonly used on airplane tails and helicopter blades.)

Classical Thin Airfoil Theory: The Symmetric Airfoil

image329

Figure 4.30 Comparison between theory and experiment for the lift and moment coefficients for an NACA 0012 airfoil. (Source: Abbott and von Doenhoff, Reference 11.)


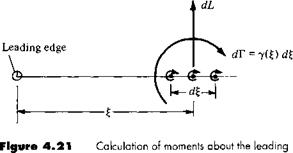
The moment about the leading edge can be calculated as follows. Consider the elemental vortex of strength у (£) located a distance £ from the leading edge, as sketched in Figure 4.21. The circulation associated with this elemental vortex is dF = y(%)d%. In turn, the increment of lift dl. contributed by the elemental vortex is dL = Poo Voc This increment of lift creates a moment about the leading edge dM = — £ (dL). The total moment about the leading edge (LE) (per unit span) due to the entire vortex sheet is therefore

Classical Thin Airfoil Theory: The Symmetric Airfoil

, 2 7ta

MLE = —q0qC —-


[4.36]


The moment coefficient is


_ Кь

qxSc


where S = c(l). Hence,


= MLE = _™

qxc2 2


[4.37]


However, from Equation (4.33),


Cl

жа — —

2

Combining Equations (4.37) and (4.38), we obtain


[4.38]


[4.39]


image331

edge.


image330

Classical Thin Airfoil Theory: The Symmetric Airfoil

From Equation (1.22), the moment coefficient about the quarter-chord point is

Подпись:Cm, с/4 — Cm. le T ^

Combining Equations (4.39) and (4.40), we have

[4.41]

In Section 1.6, a definition is given for the center of pressure as that point about which the moments are zero. Clearly, Equation (4.41) demonstrates the theoretical result that the center of pressure is at the quarter-chord point for a symmetric airfoil.

By the definition given in Section 4.3, that point on an airfoil where moments are independent of angle of attack is called the aerodynamic center. From Equation (4.41), the moment about the quarter chord is zero for all values of a. Hence, for a symmetric airfoil, we have the theoretical result that the quarter-chord point is both the center of pressure and the aerodynamic center.

The above theoretical result for cm>c/4 = 0 is supported by the experimental data given in Figure 4.20. Also, note that the experimental value of cmc/4 is constant over a wide range of a, thus demonstrating that the real aerodynamic center is essentially at the quarter chord.

Let us summarize the above results. The essence of thin airfoil theory is to find a distribution of vortex sheet strength along the chord line that will make the camber line a streamline of the flow while satisfying the Kutta condition у (ТЕ) = 0. Such a vortex distribution is obtained by solving Equation (4.18) for y(%), or in terms of the transformed independent variable в, solving Equation (4.23) for у (в) [recall that Equation (4.23) is written for a symmetric airfoil]. The resulting vortex distribution у (в) for a symmetric airfoil is given by Equation (4.24). In turn, this vortex distribu­tion, when inserted into the Kutta-Joukowski theorem, gives the following important theoretical results for a symmetric airfoil:

1. сі = 2л a.

2. Lift slope = 27Г.

3. The center of pressure and the aerodynamic center are both located at the quarter-

chord point.

Definition of Compressibility

All real substances are compressible to some greater or lesser extent; that is, when you squeeze or press on them, their density will change. This is particularly true of gases, much less so for liquids, and virtually unnoticeable for solids. The amount by which a substance can be compressed is given by a specific property of the substance called the compressibility, defined below.

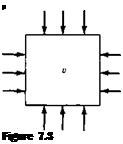
Consider a small element of fluid of volume v, as sketched in Figure 7.3. The pressure exerted on the sides of the element is p. Assume the pressure is now in­creased by an infinitesimal amount dp. The volume of the element will change by a corresponding amount d v; here, the volume will decrease; hence, d v shown in Figure

7.3 is a negative quantity. By definition, the compressibility r of the fluid is

Подпись: [7.33]1 d v v dp

Physically, the compressibility is the fractional change in volume of the fluid element per unit change in pressure. However, Equation (7.33) is not precise enough. We know from experience that when a gas is compressed (say, in a bicycle pump), its temperature tends to increase, depending on the amount of heat transferred into or out of the gas through the boundaries of the system. If the temperature of the fluid element in Figure 7.3 is held constant (due to some heat transfer mechanism), then r is identified as the isothermal compressibility rt, defined from Equation (7.33) as

Подпись: 1 Tj = V image497[7.34]

On the other hand, if no heat is added to or taken away from the fluid element, and if friction is ignored, the compression of the fluid element takes place isentropically, and t is identified as the isentropic compressibility rs, defined from Equation (7.33) as

Definition of Compressibility

1 /dv’


[7.35]


?s =


v dPJs


where the subscript 5 denotes that the partial derivative is taken at constant entropy. Both Xj and r, are precise thermodynamic properties of the fluid; their values for

Подпись: p Figure 7.3 Definition of compressibility.

different gases and liquids can be obtained from various handbooks of physical prop­erties. In general, the compressibility of gases is several orders of magnitude larger than that of liquids.

The role of the compressibility r in determining the properties of a fluid in motion is seen as follows. Define v as the specific volume (i. e., the volume per unit mass). Hence, v = 1 / p. Substituting this definition into Equation (7.33), we obtain

Подпись: [7.36]1 dp P dp

Thus, whenever the fluid experiences a change in pressure dp, the corresponding change in density dp from Equation (7.36) is

Подпись: [7.37]dp = p x dp

Consider a fluid flow, say, for example, the flow over an airfoil. If the fluid is a liquid, where the compressibility r is very small, then for a given pressure change dp from one point to another in the flow, Equation (7.37) states that dp will be negligibly small. In turn, we can reasonably assume that p is constant and that the flow of a liquid is incompressible. On the other hand, if the fluid is a gas, where the compressibility r is large, then for a given pressure change dp from one point to another in the flow, Equation (7.37) states that dp can be large. Thus, p is not constant, and in general, the flow of a gas is a compressible flow. The exception to this is the low-speed flow of a gas; in such flows, the actual magnitude of the pressure changes throughout the flow field is small compared with the pressure itself. Thus, for a low-speed flow, dp in Equation (7.37) is small, and even though r is large, the value of dp can be dominated by the small dp. In such cases, p can be assumed to be constant, hence allowing us to analyze low-speed gas flows as incompressible flows (such as discussed in Chapters 3 to 6).

Later, we demonstrate that the most convenient index to gage whether a gas flow can be considered incompressible, or whether it must be treated as compressible, is the Mach number M, defined in Chapter 1 as the ratio of local flow velocity V to the local speed of sound a:

V

M = — [7.38]

a

We show that, when M > 0.3, the flow should be considered compressible, Also, we show that the speed of sound in a gas is related to the isentropic compressibility rs, given by Equation (7.35).

Volume Integrals

Consider a volume V in space. Let p be a scalar field in this space. The volume integral over the volume V of the quantity p is written as

image99p dV = volume integral of a scalar p over the
volume V (the result is a scalar)

image100

Figure 2.9 Sketch for surface integrals. The

three-dimensional surface area S is bounded by the closed curve C.


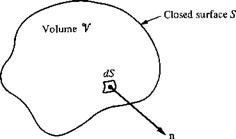
image101

Figure 2.10 Volume V enclosed by the closed surface S.


Let A be a vector field in space. The volume integral over the volume V of the quantity A is written as


A dV = volume integral of a vector A over the volume V (the result is a vector)


2.2.11 Relations Between Line, Surface, and Volume Integrals


Consider again the open area S bounded by the closed curve C, as shown in Figure 2.9. Let A be a vector field. The line integral of A over C is related to the surface integral of A over S by Stokes ’ theorem:


[2.25]


Consider again the volume V enclosed by the closed surface S, as shown in Figure 2.10. The surface and volume integrals of the vector field A are related through the divergence theorem:


image104

s


(V. A) dV


[2.26]


v


If p represents a scalar field, a vector relationship analogous to Equation (2.26) is given by the gradient theorem:


[2.27]


VpdV


image102image103image105

2.2.12 Summary

This section has provided a concise review of those elements of vector analysis which we will use as tools in our subsequent discussions. Make certain to review these tools until you feel comfortable with them, especially the relations in boxes.

Infinity Boundary Conditions

Far away from the body (toward infinity), in all directions, the flow approaches the uniform freestream conditions. Let be aligned with the x direction as shown in Figure 3.18. Hence, at infinity,

Подпись: [3.47a]З Ф дф

и = — = — = Lx дх 3 у

Infinity Boundary Conditions

Подпись:Boundary conditions at infinity and on a body; inviscid flow.

Подпись: [3.47b]дф дф ду дх

Equations (3.47a and b) are the boundary conditions on velocity at infinity. They apply at an infinite distance from the body in all directions, above and below, and to the left and right of the body, as indicated in Figure 3.18.

Prandtl’s Classical Lifting-Line Theory

The first practical theory for predicting the aerodynamic properties of a finite wing was developed by Ludwig Prandtl and his colleagues at Gottingen, Germany, during the period 1911-1918, spanning World War I. The utility of Prandtl’s theory is so great

that it is still in use today for preliminary calculations of finite-wing characteristics. The purpose of this section is to describe Prandtl’s theory and to lay the groundwork for the modern numerical methods described in subsequent sections.

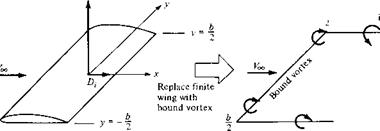
Prandtl reasoned as follows. A vortex filament of strength Г that is somehow bound to a fixed location in a flow—a so-called bound vortex—will experience a force L = Poo ‘oc Г from the Kutta-Joukowski theorem. This bound vortex is in contrast to a free vortex, which moves with the same fluid elements throughout a flow. Therefore, let us replace a finite wing of span b with a bound vortex, extending from у = —b/2 to у = b/2, as sketched in Figure 5.10. However, due to Helmholtz’s theorem, a vortex filament cannot end in the fluid. Therefore, assume the vortex filament continues as two free vortices trailing downstream from the wing tips to infinity, as also shown in Figure 5.10. This vortex (the bound plus the two free) is in the shape of a horseshoe, and therefore is called a horseshoe vortex.

Подпись: w(y) — -
Prandtl’s Classical Lifting-Line Theory Подпись: [5.13]

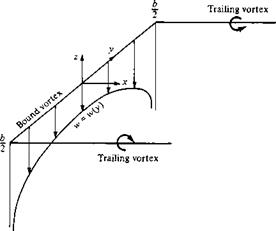
A single horseshoe vortex is shown in Figure 5.11. Consider the down wash w induced along the bound vortex from — b/2 to b/2 by the horseshoe vortex. Examining Figure 5.11, we see that the bound vortex induces no velocity along itself; however, the two trailing vortices both contribute to the induced velocity along the bound vortex, and both contributions are in the downward direction. Consistent with the xyz coordinate system in Figure 5.11, such a downward velocity is negative; that is, w (which is in the г direction) is a negative value when directed downward and a positive value when directed upward. If the origin is taken at the center of the bound vortex, then the velocity at any point у along the bound vortex induced by the trailing semi-infinite vortices is, from Equation (5.11),

In Equation (5.12), the first term on the right-hand side is the contribution from the left trailing vortex (trailing from —b/2), and the second term is the contribution from the right trailing vortex (trailing from b/2). Equation (5.12) reduces to

image415[5.13]

Подпись: LПодпись: tПодпись: Free-trailing vortexПодпись: Finite wingПодпись: Horseshoe vortexПодпись:image4164 Free-trailing vortex

image417

Figure 5.1 1 Downwash distribution along the у axis for a single horseshoe vertex.

This variation of w(y) is sketched in Figure 5.11. Note that w approaches —oo as у approaches —b/2 or b/2.

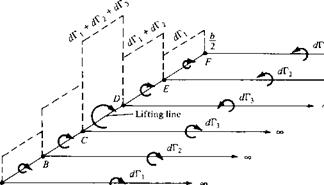
The downwash distribution due to the single horseshoe vortex shown in Figure 5.11 does not realistically simulate that of a finite wing; the downwash approaching an infinite value at the tips is especially disconcerting. During the early evolution of finite-wing theory, this problem perplexed Prandtl and his colleagues. After several years of effort, a resolution of this problem was obtained which, in hindsight, was simple and straightforward. Instead of representing the wing by a single horseshoe vortex, let us superimpose a large number of horseshoe vortices, each with a different length of the bound vortex, but with all the bound vortices coincident along a single line, called the lifting line. This concept is illustrated in Figure 5.12, where only three horseshoe vortices are shown for the sake of clarity. In Figure 5.12, a horseshoe vortex of strength <іГі is shown, where the bound vortex spans the entire wing from —b/2 to b/2 (from point A to point F). Superimposed on this is a second horseshoe vortex of strength (ІГ2, where its bound vortex spans only part of the wing, from point В to point E. Finally, superimposed on this is a third horseshoe vortex of strength tf Г3, where its bound vortex spans only the part of the wing from point C to point D. Asa result, the circulation varies along the line of bound vortices—the lifting line defined above. Along A В and EF, where only one vortex is present, the circulation is dV . However, along BC and DE, where two vortices are superimposed, the circulation is the sum of their strengths dV]+dr2- Along CD, three vortices are superimposed, and hence the circulation is dVi + dT2 + dT3. This variation of Г along the lifting line is denoted by the vertical bars in Figure 5.12. Also, note from Figure 5.12 that we now have a series of trailing vortices distributed over the span, rather than just two vortices trailing downstream of the tips as shown in Figure 5.11. The series of

oo


oo


Prandtl’s Classical Lifting-Line Theory

Figure 5.12 Superposition of a finite number of horseshoe vortices along the lifting line.


image418

trailing vortices in Figure 5.12 represents pairs of vortices, each pair associated with a given horseshoe vortex. Note that the strength of each trailing vortex is equal to the change in circulation along the lifting line.

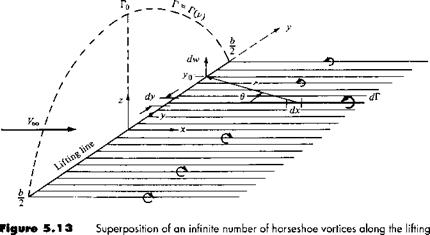
Let us extrapolate Figure 5.12 to the case where an infinite number of horseshoe vortices are superimposed along the lifting line, each with a vanishingly small strength dV. This case is illustrated in Figure 5.13. Note that the vertical bars in Figure 5.12 have now become a continuous distribution of Г(у) along the lifting line in Figure 5.13. The value of the circulation at the origin is Г0. Also, note that the finite number of trailing vortices in Figure 5.12 have become a continuous vortex sheet trailing downstream of the lifting line in Figure 5.13. This vortex sheet is parallel to the direction of Too. The total strength of the sheet integrated across the span of the wing is zero, because it consists of pairs of trailing vortices of equal strength but in opposite directions.

Let us single out an infinitesimally small segment of the lifting line dy located at the coordinate у as shown in Figure 5.13. The circulation at у is Г(у), and the change in circulation over the segment dy is dV = (dГ/dy) dy. In turn, the strength of the trailing vortex at у must equal the change in circulation dГ along the lifting line; this is simply an extrapolation of our result obtained for the strength of the finite trailing vortices in Figure 5.12. Consider more closely the trailing vortex of strength dГ which intersects the lifting line at coordinate y, as shown in Figure 5.13. Also consider the arbitrary location yo along the lifting line. Any segment of the trailing vortex dx will induce a velocity at yo with a magnitude and direction given by the Biot-Savart law, Equation (5.5). In turn, the velocity dw at yo induced by the entire semi-infinite trailing vortex located at у is given by Equation (5.11), which in terms of the picture given in Figure 5.13 yields

Prandtl’s Classical Lifting-Line Theory

[5.14]


image419

line.


The minus sign in Equation (5.14) is needed for consistency with the picture shown in Figure 5.13; for the trailing vortex shown, the direction of dw at yo is upward and hence is a positive value, whereas Г is decreasing in the у direction, making dV/dy a negative quantity. The minus sign in Equation (5.14) makes the positive dw consistent with the negative dV/dy.

The total velocity w induced at y(l by the entire trailing vortex sheet is the summa­tion of Equation (5.14) over all the vortex filaments, that is, the integral of Equation

(5.14)

Подпись: w(yo) = Подпись: [5.15]

from – b/2tob/2:

Equation (5.15) is important in that it gives the value of the downwash at y(l due to all the trailing vortices. (Keep in mind that although we label w as downwash, w is treated as positive in the upward direction in order to be consistent with the normal convention in an xyz rectangular coordinate system.)

Pause for a moment and assess the status of our discussion so far. We have replaced the finite wing with the model of a lifting line along which the circulation Г (у) varies continuously, as shown in Figure 5.13. In turn, we have obtained an ex­pression for the downwash along the lifting line, given by Equation (5.15). However, our central problem still remains to be solved; that is, we want to calculate T(y) for a given finite wing, along with its corresponding total lift and induced drag. Therefore, we must press on.

Return to Figure 5.4, which shows the local airfoil section of a finite wing. Assume this section is located at the arbitrary spanwise station yo. From Figure 5.4,

Подпись:Prandtl’s Classical Lifting-Line Theory
the induced angle of attack a, is given by

-w(yp)

Prandtl’s Classical Lifting-Line Theory Prandtl’s Classical Lifting-Line Theory

[Note in Figure 5.4 that w is downward, and hence is a negative quantity. Since a, in Figure 5.4 is positive, the negative sign in Equation (5.16) is necessary for consistency.] Generally, w is much smaller than VJ, and hence a, is a small angle, on the order of a few degrees at most. For small angles, Equation (5.16) yields

that is, an expression for the induced angle of attack in terms of the circulation distribution Г(у) along the wing.

Consider again the effective angle of attack aeff, as shown in Figure 5.4. As explained in Section 5.1, oy-n is the angle of attack actually seen by the local airfoil section. Since the downwash varies across the span, then оуц is also variable; ауп = ateff (jo)• The lift coefficient for the airfoil section located at у = y0 is

Ci = ao[aeff(>’o) — «/.= ol = 27r[aeff(yo) — аТ=о] [5.19]

Подпись: і ■i In Equation (5.19), the local section lift slope ao has been replaced by the thin airfoil theoretical value of 2n-(rad-1). Also, for a wing with aerodynamic twist, the angle of zero lift ai=o in Equation (5.19) varies with vy. If there is no aerodynamic twist, aL=0 is constant across the span. In any event, aL=0 is a known property of the local airfoil sections. From the definition of lift coefficient and from the Kutta-Joukowski theorem, we have, for the local airfoil section located at yo.

L’ = {pccV£,c(yo)ci = РооЕооГ(уо) [5.20]

From Equation (5.20), we obtain

Подпись:_ 2Г (yo)

C> V’coc(y0)

Подпись: Г(уо) л-Еосс(у0) Подпись: <*L= 0 Подпись: [5.22]

Substituting Equation (5.21) into (5.19) and solving for оуц, we have

The above results come into focus if we refer to Equation (5.1):

Подпись: [5.1]«eff = a – a.

Prandtl’s Classical Lifting-Line Theory

Substituting Equations (5.18) and (5.22) into (5.1), we obtain


Prandtl’s Classical Lifting-Line Theory

[5.33]


the fundamental equation of Prandtl’s lifting-line theory, it simply states that the geometric angle of attack is equal to the sum of the effective angle plus the induced angle of attack. In Equation (5.23), aeff is expressed in terms of Г, and a, is expressed in terms of an integral containing dT/dy. Hence, Equation (5.23) is an integro – differential equation, in which the only unknown is Г; all the other quantities, a, c, Voo, and a£=o, are known for a finite wing of given design at a given geometric angle of attack in a freestream with given velocity. Thus, a solution of Equation (5.23) yields Г = Г(уо), where y0 ranges along the span from —h/2 to h/2.

The solution Г = Г(Ч’о) obtained from Equation (5.23) gives us the three main aerodynamic characteristics of a finite wing, as follows:

1. The lift distribution is obtained from the Kutta-Joukowski theorem:


Prandtl’s Classical Lifting-Line Theory

[5.34]


fb/ 2

L= L'(y) dy J-b/2

fb/2

L = PooVoo r(y)dy

J-b/2


[5.35]


or


(Note that we have dropped the subscript on y, for simplicity.) The lift coefficient follows immediately from Equation (5.25):


Prandtl’s Classical Lifting-Line Theory

CL


[5.36]


image424

An important geometric property of a finite wing is the aspect ratio, denoted by AR and defined as

Подпись: a; Подпись: CL л-AR Подпись: [5.42]

Hence, Equation (5.41) becomes

Equation (5.42) is a useful expression for the induced angle of attack, as shown below.

Prandtl’s Classical Lifting-Line Theory Подпись: 2a І Fab VXS 2 Подпись: sin2 9 d9 Подпись: TtajF{)b 2VXS Подпись: [5.42a]
image425

The induced drag coefficient is obtained from Equation (5.30), noting that a, is constant:

Substituting Equations (5.40) and (5.42) into (5.42a), we obtain

Подпись: or Подпись: CDJ Подпись: C2 ж AR Подпись: [5.43]

nb / CL 2VqcSCl 2 Voo S tr AR ) bn

Equation (5.43) is an important result. It states that the induced drag coefficient is directly proportional to the square of the lift coefficient. The dependence of induced drag on the lift is not surprising, for the following reason. In Section 5.1, we saw that induced drag is a consequence of the presence of the wing-tip vortices, which in turn are produced by the difference in pressure between the lower and upper wing surfaces. The lift is produced by this same pressure difference. Hence, induced drag is intimately related to the production of lift on a finite wing; indeed, induced drag is frequently called the drag due to lift. Equation (5.43) dramatically illustrates this point. Clearly, an airplane cannot generate lift for free; the induced drag is the price for the generation of lift. The power required from an aircraft engine to overcome the induced drag is simply the power required to generate the lift of the aircraft. Also, note that because Co. і cx C, the induced drag coefficient increases rapidly as CL increases and becomes a substantial part of the total drag coefficient when Cl is high (e. g., when the airplane is flying slowly such as on takeoff or landing). Even at relatively high cruising speeds, induced drag is typically 25 percent of the total drag.

Another important aspect of induced drag is evident in Equation (5.43); that is, Co. і is inversely proportional to aspect ratio. Hence, to reduce the induced drag, we want a finite wing with the highest possible aspect ratio. Wings with high and low aspect ratios are sketched in Figure 5.14. Unfortunately, the design of very high aspect ratio wings with sufficient structural strength is difficult. Therefore, the aspect ratio of a conventional aircraft is a compromise between conflicting aerodynamic and structural requirements. It is interesting to note that the aspect ratio of the 1903 Wright

AR = b2/S


c


High AR (low induced drag)


b


Low AR (high induced drag)


Figure 5.14 Schematic of high-and low-aspect-ratio wings.


image426

Prandtl’s Classical Lifting-Line Theory

Flyer was 6 and that today the aspect ratios of conventional subsonic aircraft range typically from 6 to 8. (Exceptions are the Lockheed U-2 high-altitude reconnaissance aircraft with AR = 14.3 and sailplanes with aspect ratios in the 10 to 22 range.)

Another property of the elliptical lift distribution is as follows. Consider a wing with no geometric twist (i. e., a is constant along the span) and no aerodynamic twist (i. e., a/ =o is constant along the span). From Equation (5.42), we have seen that o’, is constant along the span. Hence, — a — cti is also constant along the span. Since the local section lift coefficient q is given by

ci = a0(aeS – aL=o)

then assuming that ao is the same for each section (ag = 2л from thin airfoil theory), ci must be constant along the span. The lift per unit span is given by

Подпись: [5.44]L'(y) = qcaCCi

Prandtl’s Classical Lifting-Line Theory Подпись: [5.45]

Solving Equation (5.44) for the chord, we have

In Equation (5.45), q00 and c; are constant along the span. However, L'(y) varies elliptically along the span. Thus, Equation (5.45) dictates that for such an elliptic lift distribution, the chord must vary elliptically along the spam, that is, for the conditions given above, the wing planform is elliptical.

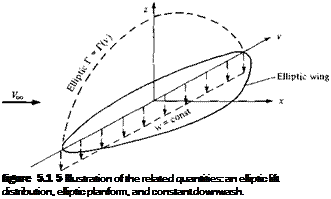
The related characteristics—the elliptic lift distribution, the elliptic planform, and the constant downwash—are sketched in Figure 5.15. Although an elliptical lift distribution may appear to be a restricted, isolated case, in reality it gives a reasonable approximation for the induced drag coefficient for an arbitrary finite wing. The form

Подпись: figure 5.1 5 Illustration of the related quantities: an elliptic lift distribution, elliptic planform, and constant downwash.

of Сил given by Equation (5.43) is only slightly modified for the general case. Let us now consider the case of a finite wing with a general lift distribution.

Thoughts

The term “aerodynamics” is generally used for problems arising from flight and other topics involving the flow of air.

Ludwig Prandtl, 1949

Aerodynamics: The dynamics of gases, especially atmospheric interactions with moving objects.

The American Heritage Dictionary of the English Language, 1969

1.1 Importance of Aerodynamics: Historical Examples

On August 8, 1588, the waters of the English Channel churned with the gyrations of hundreds of warships. The great Spanish Armada had arrived to carry out an invasion of Elizabethan England and was met head-on by the English fleet under the command of Sir Francis Drake. The Spanish ships were large and heavy; they were packed with soldiers and carried formidable cannons that fired 50 lb round shot that could devastate any ship of that era. In contrast, the English ships were smaller and lighter; they carried no soldiers and were armed with lighter, shorter-range cannons.

The balance of power in Europe hinged on the outcome of this naval encounter. King Philip II of Catholic Spain was attempting to squash Protestant England’s rising influence in the political and religious affairs of Europe; in turn, Queen Elizabeth I was attempting to defend the very existence of England as a sovereign state. In fact, on that crucial day in 1588, when the English floated six fire ships into the Spanish formation and then drove headlong into the ensuing confusion, the future history of Europe was in the balance. In the final outcome, the heavier, sluggish, Spanish ships were no match for the faster, more maneuverable, English craft, and by that evening the Spanish Armada lay in disarray, no longer a threat to England. This naval battle is of particular importance because it was the first in history to be fought by ships on both sides powered completely by sail (in contrast to earlier combinations of oars and sail), and it taught the world that political power was going to be synonymous with naval power. In turn, naval power was going to depend greatly on the speed and maneuverability of ships. To increase the speed of a ship, it is important to reduce the resistance created by the water flow around the ship’s hull. Suddenly, the drag on ship hulls became an engineering problem of great interest, thus giving impetus to the study of fluid mechanics.

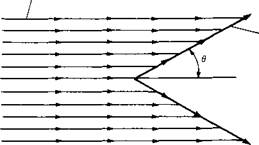
This impetus hit its stride almost a century later, when, in 1687, Isaac Newton (1642-1727) published his famous Principia, in which the entire second book was devoted to fluid mechanics. Newton encountered the same difficulty as others before him, namely, that the analysis of fluid flow is conceptually more difficult than the dynamics of solid bodies. A solid body is usually geometrically well defined, and its motion is therefore relatively easy to describe. On the other hand, a fluid is a “squishy” substance, and in Newton’s time it was difficult to decide even how to qualitatively model its motion, let alone obtain quantitative relationships. Newton considered a fluid flow as a uniform, rectilinear stream of particles, much like a cloud of pellets from a shotgun blast. As sketched in Figure 1.1, Newton assumed that upon striking a surface inclined at an angle в to the stream, the particles would

Rectilinear stream of discrete particles


Upon impacting the body, the particles give up their momentum normal to the surface, and travel downstream along the surface.


Figure 1«1 Isaac Newton’s model of fluid flow in the year 1687.

This model was widely adopted in the seventeenth and eighteenth centuries but was later found to be conceptually inaccurate for most fluid flows.


image6

transfer their normal momentum to the surface but their tangential momentum would be preserved. Hence, after collision with the surface, the particles would then move along the surface. This led to an expression for the hydrodynamic force on the surface which varies as sin2 9. This is Newton’s famous sine-squared law (described in detail in Chapter 14). Although its accuracy left much to be desired, its simplicity led to wide application in naval architecture. Later, in 1777, a series of experiments was carried out by Jean LeRond d’Alembert (1717-1783), under the support of the French government, in order to measure the resistance of ships in canals. The results showed that “the rule that for oblique planes resistance varies with the sine square of the angle of incidence holds good only for angles between 50 and 90° and must be abandoned for lesser angles.” Also, in 1781, Leonhard Euler(1707-1783)pointed out the physical inconsistency of Newton’s model (Figure 1.1) consisting of a rectilinear stream of particles impacting without warning on a surface. In contrast to this model, Euler noted that the fluid moving toward a body “before reaching the latter, bends its direction and its velocity so that when it reaches the body it flows past it along the surface, and exercises no other force on the body except the pressure corresponding to the single points of contact.” Euler went on to present a formula for resistance which attempted to take into account the shear stress distribution along the surface, as well as the pressure distribution. This expression became proportional to sin2 в for large incidence angles, whereas it was proportional to sin 9 at small incidence angles. Euler noted that such a variation was in reasonable agreement with the ship-hull experiments carried out by d’Alembert.

This early work in fluid dynamics has now been superseded by modern concepts and techniques. (However, amazingly enough, Newton’s sine-squared law has found new application in very high-speed aerodynamics, to be discussed in Chapter 14.) The major point here is that the rapid rise in the importance of naval architecture after the sixteenth century made fluid dynamics an important science, occupying the minds of Newton, d’Alembert, and Euler, among many others. Today, the modem ideas of fluid dynamics, presented in this book, are still driven in part by the importance of reducing hull drag on ships.

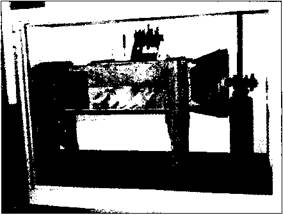
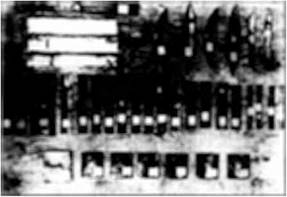
Consider a second historical example. The scene shifts to Kill Devil Hills, 4 mi south of Kitty Hawk, North Carolina. It is summer of 1901, and Wilbur and Orville Wright are struggling with their second major glider design, the first being a stunning failure the previous year. The airfoil shape and wing design of their glider are based on aerodynamic data published in the 1890s by the great German aviation pioneer Otto Lilienthal (1848-1896) and by Samuel Pierpont Langley (1934-1906), secretary of the Smithsonian Institution—the most prestigious scientific position in the United States at that time. Because their first glider in 1900 produced no meaningful lift, the Wright brothers have increased the wing area from 165 to 290 ft2 and have increased the wing camber (a measure of the airfoil curvature—the larger the camber, the more “arched” is the thin airfoil shape) by almost a factor of 2. But something is still wrong. In Wilbur’s words, the glider’s “lifting capacity seemed scarcely one-third of the calculated amount.” Frustration sets in. The glider is not performing even close to their expectations, although it is designed on the basis of the best available aerodynamic data. On August 20, the Wright brothers despairingly pack themselves

aboard a train going back to Dayton, Ohio. On the ride back, Wilbur mutters that “nobody will fly for a thousand years.” However, one of the hallmarks of the Wrights is perseverance, and within weeks of returning to Dayton, they decide on a complete departure from their previous approach. Wilbur later wrote that “having set out with absolute faith in the existing scientific data, we were driven to doubt one thing after another, until finally after two years of experiment, we cast it all aside, and decided to rely entirely upon our own investigations.” Since their 1901 glider was of poor aerodynamic design, the Wrights set about determining what constitutes good aerodynamic design. In the fall of 1901, they design and build a 6 ft long, 16 in square wind tunnel powered by a two-bladed fan connected to a gasoline engine. An original photograph of the Wrights’ tunnel in their Dayton bicycle shop is shown in Figure 1.2a. In this wind tunnel they test over 200 different wing and airfoil shapes, including flat plates, curved plates, rounded leading edges, rectangular and curved planforms, and various monoplane and multiplane configurations. A sample of their test models is shown in Figure 1.2b. The aerodynamic data is taken logically and carefully. It shows a major departure from the existing “state-of-the-art” data. Armed with their new aerodynamic information, the Wrights design a new glider in the spring of 1902. The airfoil is much more efficient; the camber is reduced considerably, and the location of the maximum rise of the airfoil is moved closer to the front of the wing. The most obvious change, however, is that the ratio of the length of the wing (wingspan) to the distance from the front to the rear of the airfoil (chord length) is increased from 3 to 6. The success of this glider during the summer and fall of 1902 is astounding; Orville and Wilbur accumulate over a thousand flights during this period. In contrast to the previous year, the Wrights return to Dayton flushed with success and devote all their subsequent efforts to powered flight. The rest is history.

The major point here is that good aerodynamics was vital to the ultimate success of the Wright brothers and, of course, to all subsequent successful airplane designs up to the present day. The importance of aerodynamics to successful manned flight goes without saying, and a major thrust of this book is to present the aerodynamic fundamentals that govern such flight.

Consider a third historical example of the importance of aerodynamics, this time as it relates to rockets and space flight. High-speed, supersonic flight had become a dominant feature of aerodynamics by the end of World War II. By this time, aerody – namicists appreciated the advantages of using slender, pointed body shapes to reduce the drag of supersonic vehicles. The more pointed and slender the body, the weaker the shock wave attached to the nose, and hence the smaller the wave drag. Conse­quently, the German V-2 rocket used during the last stages of World War II had a pointed nose, and all short-range rocket vehicles flown during the next decade fol­lowed suit. Then, in 1953, the first hydrogen bomb was exploded by the United States. This immediately spurred the development of long-range intercontinental ballistic missiles (ICBMs) to deliver such bombs. These vehicles were designed to fly outside the region of the earth’s atmosphere for distances of 5000 mi or more and to reenter the atmosphere at suborbital speeds of from 20,000 to 22,000 ft/s. At such high velocities, the aerodynamic heating of the reentry vehicle becomes severe, and this heating problem dominated the minds of high-speed aerodynamicists. Their first

image7

(a)

image8

(b)

Figure 1 Л (a) Wind tunnel designed, built, and used by the Wright brothers in Dayton, Ohio, during 1901-1902. (b) Wing models tested by the Wright brothers in their wind tunnel during 1901-1902.

thinking was conventional—a sharp-pointed, slender reentry body. Efforts to min­imize aerodynamic heating centered on the maintenance of laminar boundary layer flow on the vehicle’s surface; such laminar flow produces far less heating than turbu­lent flow (discussed in Chapters 15 and 19). However, nature much prefers turbulent flow, and reentry vehicles are no exception. Therefore, the pointed-nose reentry body was doomed to failure because it would burn up in the atmosphere before reaching the earth’s surface.

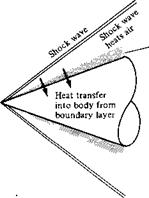
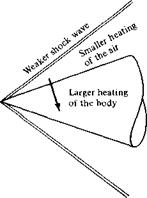
However, in 1951, one of those major breakthroughs that come very infrequently in engineering was created by H. Julian Allen at the NACA (National Advisory Com­mittee for Aeronautics) Ames Aeronautical Laboratory—he introduced the concept of the blunt reentry body. His thinking was paced by the following concepts. At the beginning of reentry, near the outer edge of the atmosphere, the vehicle has a large amount of kinetic energy due to its high velocity and a large amount of potential en­ergy due to its high altitude. However, by the time the vehicle reaches the surface of the earth, its velocity is relatively small and its altitude is zero; hence, it has virtually no kinetic or potential energy. Where has all the energy gone? The answer is that it has gone into (1) heating the body and (2) heating the airflow around the body. This is illustrated in Figure 1.3. Here, the shock wave from the nose of the vehicle heats the airflow around the vehicle; at the same time, the vehicle is heated by the intense frictional dissipation within the boundary layer on the surface. Allen reasoned that if more of the total reentry energy could be dumped into the airflow, then less would be available to be transferred to the vehicle itself in the form of heating. In turn, the way to increase the heating of the airflow is to create a stronger shock wave at the nose, i. e., to use a blunt-nosed body. The contrast between slender and blunt reentry bodies is illustrated in Figure 1.4. This was a stunning conclusion—to minimize aerodynamic heating, you actually want a blunt rather than a slender body. The result was so important that it was bottled up in a secret government document. Moreover, because it was so foreign to contemporary intuition, the blunt-reentry-body concept was accepted only gradually by the technical community. Over the next few years, additional aerodynamic analyses and experiments confirmed the validity of blunt reentry bodies. By 1955, Allen was publicly recognized for his work, receiving the Sylvanus Albert Reed Award of the Institute of the Aeronautical Sciences (now the American Institute of Aeronautics and Astronautics). Finally, in 1958, his work was made available to the public in the pioneering document NACA Report 1381 entitled “A Study of the Motion and Aerodynamic Heating of Ballistic Missiles Entering the

Подпись: Hot boundary layerПодпись: Energy of reentry goes into heating both the body and the air around the body.image9"Very high­speed flow

Figure 1.3

Very high­speed flow


Thoughts

image10

Thoughts

Earth’s Atmosphere at High Supersonic Speeds.” Since Harvey Allen’s early work, all successful reentry bodies, from the first Atlas ICBM to the manned Apollo lunar capsule, have been blunt. Incidentally, Allen went on to distinguish himself in many other areas, becoming the director of the NASA Ames Research Center in 1965, and retiring in 1970. His work on the blunt reentry body is an excellent example of the importance of aerodynamics to space vehicle design.

In summary, the purpose of this section has been to underscore the importance of aerodynamics in historical context. The goal of this book is to introduce the fundamentals of aerodynamics and to give the reader a much deeper insight to many technical applications in addition to the few described above. Aerodynamics is also a subject of intellectual beauty, composed and drawn by many great minds over the centuries. If you are challenged and interested by these thoughts, or even the least bit curious, then read on.

Physical principle Energy can be neither created nor destroyed; it can only change in form

This physical principle is embodied in the first law of thermodynamics. A brief review of thermodynamics is given in Chapter 7. Thermodynamics is essential to the study of compressible flow; however, at this stage, we will only introduce the first law, and we defer any substantial discussion of thermodynamics until Chapter 7, where we begin to concentrate on compressible flow.

Consider a fixed amount of matter contained within a closed boundary. This matter defines the system. Because the molecules and atoms within the system are constantly in motion, the system contains a certain amount of energy. For simplicity, let the system contain a unit mass; in turn, denote the internal energy per unit mass by e.

The region outside the system defines the surroundings. Let an incremental amount of heat 8q be added to the system from the surroundings. Also, let 8w be the work done on the system by the surroundings. (The quantities 8q and 8w are discussed in more detail in Chapter 7.) Both heat and work are forms of energy, and when added to the system, they change the amount of internal energy in the system. Denote this change of internal energy by de. From our physical principle that energy is conserved, we have for the system

8q + 8w = de [2.85]

Equation (2.85) is a statement of the first law of thermodynamics.

Let us apply the first law to the fluid flowing through the fixed control volume shown in Figure 2.17. Let

B = rate of heat added to fluid inside control volume from surroundings

Z?2 = rate of work done on fluid inside control volume

Вт, = rate of change of energy of fluid as it flows through control volume

From the first law,

Note that each term in Equation (2.86) involves the time rate of energy change; hence, Equation (2.86) is, strictly speaking, a power equation. However, because it is a statement of the fundamental principle of conservation of energy, the equation is conventionally termed the “energy equation.” We continue this convention here.

Подпись: Rate of volumetric
Подпись: heating = Подпись: qpdV Подпись: [2.87]

First, consider the rate of heat transferred to or from the fluid. This can be visual­ized as volumetric heating of the fluid inside the control volume due to absorption of radiation originating outside the system or the local emission of radiation by the fluid itself, if the temperature inside the control volume is high enough. In addition, there may be chemical combustion processes taking place inside the control volume, such as fuel-air combustion in a jet engine. Let this volumetric rate of heat addition per unit mass be denoted by q. Typical units for q are J/s • kg or ft • lb/s • slug. Examining Figure 2.17, the mass contained within an elemental volume is p dV hence, the rate of heat addition to this mass is q{p dV). Summing over the complete control volume, we obtain

In addition, if the flow is viscous, heat can be transferred into the control volume by means of thermal conduction and mass diffusion across the control surface. At this stage, a detailed development of these viscous heat-addition terms is not warranted; they are considered in detail in Chapter 15. Rather, let us denote the rate of heat addition to the control volume due to viscous effects simply by Qviscous – Therefore, in Equation (2.86), the total rate of heat addition is given by Equation (2.87) plus

Q viscous*

Physical principle Energy can be neither created nor destroyed; it can only change in form

[2.88]


в 1


V


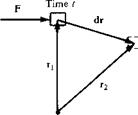
Before considering the rate of work done on the fluid inside the control volume, consider a simpler case of a solid object in motion, with a force F being exerted on the object, as sketched in Figure 2.23. The position of the object is measured from a fixed origin by the radius vector r. In moving from position Г] to Г2 over an interval


Later time, t + dt


Figure 2.23 Schematic for the rate of doing work by a force F exerted on a moving body.


image137image138

of time dt, the object is displaced through dr. By definition, the work done on the object in time dt is F • dr. Hence, the time rate of doing work is simply F • йт/dt. However, йт/dt = V, the velocity of the moving object. Hence, we can state that

Rate of doing work on moving body = F • V

In words, the rate of work done on a moving body is equal to the product of its velocity and the component of force in the direction of the velocity.

Physical principle Energy can be neither created nor destroyed; it can only change in form

This result leads to an expression for B2, as follows. Consider the elemental area dS of the control surface in Figure 2.17. The pressure force on this elemental area is —p dS. From the above result, the rate of work done on the fluid passing through dS with velocity V is (—p dS) • V. Hence, summing over the complete control surface, we have

If the flow is viscous, the shear stress on the control surface will also perform work on the fluid as it passes across the surface. Once again, a detailed development of this term is deferred until Chapter 15. Let us denote this contribution simply by VTViSCOUS. Then the total rate of work done on the fluid inside the control volume is the sum of Equations (2.89) and (2.90) and VTviscou

Подпись: ШПодпись: [2.91]Подпись: p(f • Y)dV + Wvi +

S V

To visualize the energy inside the control volume, recall that in the first law of thermodynamics as stated in Equation (2.85), the internal energy e is due to the random motion of the atoms and molecules inside the system. Equation (2.85) is written for a stationary system. However, the fluid inside the control volume in Figure 2.17 is not stationary; it is moving at the local velocity V with a consequent kinetic energy per unit mass of Vі/2. Hence, the energy per unit mass of the moving fluid is the sum of both internal and kinetic energies e + Vі/2. This sum is called the total energy per unit mass.

We are now ready to obtain an expression for ZL, the rate of change of total energy of the fluid as it flows through the control volume. Keep in mind that mass flows into the control volume of Figure 2.17 bringing with it a certain total energy; at the same time mass flows out of the control volume taking with it a generally different amount of total energy. The elemental mass flow across dS is pV • dS, and therefore

Подпись: Net rate of flow of total energy across control surface Подпись: [2.92]
image139 image140

the elemental flow of total energy across dS is (pV • dS)(e + V2/2). Summing over the complete control surface, we obtain

In addition, if the flow is unsteady, there is a time rate of change of total energy inside the control volume due to the transient fluctuations of the flow-field variables. The total energy contained in the elemental volume dV is p(<? + V2/2) dV, and hence the total energy inside the complete control volume at any instant in time is

Therefore,

Подпись: dVimage141"Подпись: v and (2.93): Подпись: [2.93]Time rate of change of total energy
inside V due to transient variations
of flow-field variables

Подпись: S3 Physical principle Energy can be neither created nor destroyed; it can only change in form Physical principle Energy can be neither created nor destroyed; it can only change in form Подпись: [2.94]
image142

In turn, S3 is the sum of Equations (2.92)

image143

Repeating the physical principle stated at the beginning of this section, the rate of heat added to the fluid plus the rate of work done on the fluid is equal to the rate of change of total energy of the fluid as it flows through the control volume; i. e., energy is conserved. In turn, these words can be directly translated into an equation by combining Equations (2.86), (2.88), (2.91), and (2.94):

Equation (2.95) is the energy equation in integral form; it is essentially the first law of thermodynamics applied to a fluid flow.

For the sake of completeness, note that if a shaft penetrates the control surface in Figure 2.17, driving some power machinery located inside the control volume (say, a compressor of a jet engine), then the rate of work delivered by the shaft, lVShafb must be added to the left side of Equation (2.95). Also note that the potential energy does not appear explicitly in Equation (2.95). Changes in potential energy are contained in the body force term when the force of gravity is included in f. For the aerodynamic

problems considered in this book, shaft work is not treated, and changes in potential energy are always negligible.

Following the approach established in Sections 2.4 and 2.5, we can obtain a partial differential equation for total energy from the integral form given in Equation

(2.95) . Applying the divergence theorem to the surface integrals in Equation (2.95), collecting all terms inside the same volume integral, and setting the integrand equal to zero, we obtain

3

Г ( v2X

г / v2 1

dt

/Т + т)_

+ V.

4c+t)v

= pq-V • (p) + p(f ■ V)

+ &. + w!-

1 ^ VISCOUS 1 VISCOUS

[2.96]

where <2viscous and ^viscous represent the proper forms of the viscous terms, to be obtained in Chapter 15. Equation (2.96) is a partial differential equation which relates the flow-field variables at a given point in space.

If the flow is steady (3/31 = 0), inviscid ((/viscous = 0 and Wviscous = 0), adiabatic (no heat addition, q = 0), without body forces (f = 0), then Equations

(2.95) aEquations (2.97) and (2.98) are discussed and applied at length beginning with Chapter 7.

With the energy equation, we have introduced another unknown flow-field vari­able e. We now have three equations, continuity, momentum, and energy, which involve four dependent variables, p, p, V, and e. A fourth equation can be obtained from a thermodynamic state relation for e (see Chapter 7). If the gas is calorically perfect, then

e = cvT [2.99]

where cv is the specific heat at constant volume. Equation (2.99) introduces temper­ature as yet another dependent variable. However, the system can be completed by using the perfect gas equation of state

p — pRT [2.100]

where R is the specific gas constant. Therefore, the continuity, momentum, and energy equations, along with Equations (2.99) and (2.100) are five independent equations

for the five unknowns, p p, V, e, and T. The matter of a perfect gas and related equations of state are reviewed in detail in Chapter 7; Equations (2.99) and (2.100) are presented here only to round out our development of the fundamental equations of fluid flow.

Applied Aerodynamics: the Flow over a Circular Cylinder—the Real Case

The inviscid, incompressible flow over a circular cylinder was treated in Section 3.13. The resulting theoretical streamlines are sketched in Figure 3.26, characterized by a

symmetrical pattern where the flow “closes in” behind the cylinder. As a result, the pressure distribution over the front of the cylinder is the same as that over the rear (see Figure 3.29). This leads to the theoretical result that the pressure drag is zero—d’Alembert’s paradox.

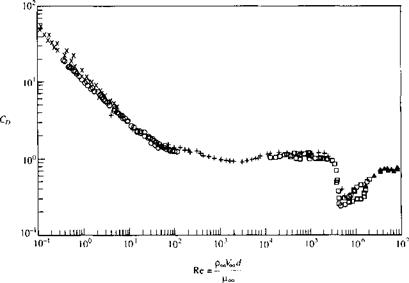
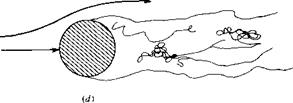
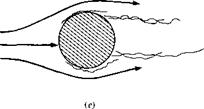
The real flow over a circular cylinder is quite different from that studied in Section 3.13, the difference due to the influence of friction. Moreover, the drag coefficient for the real flow over a cylinder is certainly not zero. For a viscous incompressible flow, the results of dimensional analysis (Section 1.7) clearly demonstrate that the drag coefficient is a function of the Reynolds number. The variation of Co = /(Re) for a circular cylinder is shown in Figure 3.44, which is based on a wealth of experimental data. Here, Re = (PooFoo^O/P-co. where d is the diameter of the cylinder. Note that Co is very large for the extremely small values of Re < 1, but decreases monotonically until Re ^ 300, 000. At this Reynolds number, there is a precipitous drop of CD from a value near 1 to about 0.3, then a slight recovery to about 0.6 for Re = 107. (Note: These results are consistent with the comparison shown in Figure 139d and e, contrasting С о for a circular cylinder at low and high Re.) What cause this precipitous drop in Co when the Reynolds number reaches about 300,000? A detailed answer must await our discussion of viscous flow in Part 4. However, we state now that the phenomenon is caused by a sudden transition of laminar flow within the boundary layer at the lower values of Re to a turbulent boundary layer at the higher values of Re. Why does a turbulent boundary layer result in a smaller Co for this case? Stay tuned; the answer is given in Part 4.

image287

Figure 3.44 Variation of cylinder-drag coefficient with Reynolds number.

(Source: Experimental data as compiled in Panton, Ronald, Incompressible Flow, Wiley-lnterscience, New York, 1 984.)

The variation of Сд shown in Figure 3.44 across a range of Re from 10-1 to 107 is accompanied by tremendous variations in the qualitative aspects of the flow field, as itemized, and as sketched in Figure 3.45.

image288

(el

image289

image290

(0

image291

image292

Figure 3.45 Various types of flow over a circular cylinder.

[Source: Panton, Ronald, Incompressible Flow, Wiley-lnterscience, New York, 1984.)

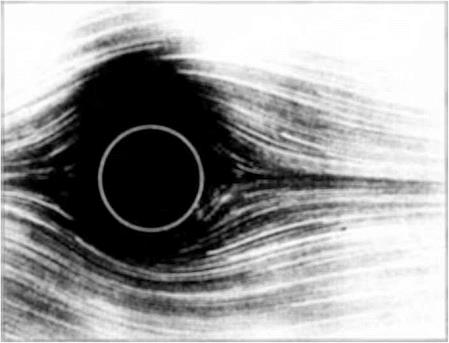
1. For very low values of Re, say, 0 < Re < 4, the streamlines are almost (but not exactly) symmetrical, and the flow is attached, as sketched in Figure 3.45a. This regime of viscous flow is called Stokes flow, it is characterized by a near balance of pressure forces with friction forces acting on any given fluid element; the flow velocity is so low that inertia effects are very small. A photograph of this type of flow is shown in Figure 3.46, which shows the flow of water around a circular cylinder where Re = 1.54. The streamlines are made visible by aluminum powder on the surface, along with a time exposure of the film.

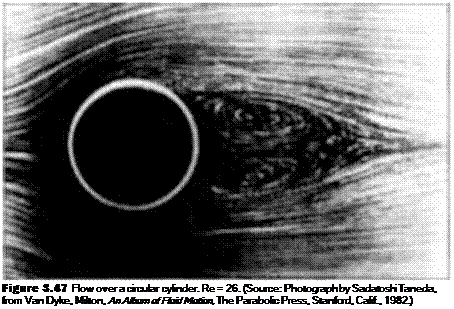
2. For 4 < Re < 40, the flow becomes separated on the back of the cylinder, forming two distinct, stable vortices that remain in the position shown in Figure 3.45b. A photograph of this type of flow is given in Figure 3.47, where Re = 26.

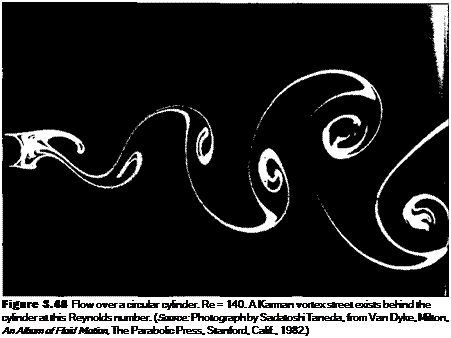
3. As Re is increased above 40, the flow behind the cylinder becomes unstable; the vortices which were in a fixed position in Figure 3.45b now are alternately shed from the body in a regular fashion and flow downstream. This flow is sketched in Figure 3.45c. A photograph of this type of flow is shown in Figure 3.48, where Re = 140. This is a water flow where the streaklines are made visible by the electrolytic precipitation method. (In this method, metal plating on the cylinder

image293

Figure 3.46 Flow over a circular cylinder. Re = 1.54. (Source: Photograph by

Sadatoshi Taneda, from Van Dyke, Milton, An Album of Fluid Motion, The Parabolic Press, Stanford, Calif., 1982.)

Подпись: Figure 3.47 Flow over a circular cylinder. Re = 26. (Source: Photograph by Sadatoshi Taneda, from Van Dyke, Milton, An Album of Fluid Motion, The Parabolic Press, Stanford, Calif., 1982.)
surface acts as an anode, white particles are precipitated by electrolysis near the anode, and these particles subsequently flow downstream, forming a streakline. The definition of a streakline is given in Section 2.11) The alternately shed vortex pattern shown in Figures 3.45c and 3.48 is called a Karman vortex street, named after Theodore von Karman, who began to study and analyze this pattern in 1911 while at Gottingen University in Germany, (von Karman subsequently had a long and very distinguished career in aerodynamics, moving to the California Institute of Technology in 1930, and becoming America’s best-known aerodynamicist in the mid-twentieth century. An autobiography of von Karman was published in 1967; see Reference 49. This reference is “must” reading for anyone interested in a riveting perspective on the history of aerodynamics in the twentieth century.)

4. As the Reynolds number is increased to large numbers, the Karman vortex street becomes turbulent and begins to metamorphose into a distinct wake. The laminar boundary layer on the cylinder separates from the surface on the forward face, at a point about 80° from the stagnation point. This is sketched in Figure 3.45J. The value of the Reynolds number for this flow is on the order of 105. Note, from Figure 3.44, that Co is a relatively constant value near unity for 103 < Re < 3 x 10⁵.

5. For 3 x 10⁵ < Re < З X 106, the separation of the laminar boundary layer still takes place on’the forward face of the cylinder. However, in the free shear layer over the top of the separated region, transition to turbulent flow takes place. The

Подпись: Figure 3.48 Flow over a circular cylinder. Re = 140. A Karman vortex street exists behind the cylinder at this Reynolds number. (Source: Photograph by Sadatoshi Taneda, from Van Dyke, Milton, An Album of Fluid Motion, The Parabolic Press, Stanford, Calif., 1982.)

flow then reattaches on the back face of the cylinder, but separates again at about 120° around the body measured from the stagnation point. This flow is sketched in Figure 3.45e. This transition to turbulent flow, and the corresponding thinner wake (comparing Figure 3.45e with Figure 3.45d), reduces the pressure drag on the cylinder and is responsible for the precipitous drop in Co at Re = 3 x 10⁵ shown in Figure 3.44. (More details on this phenomenon are covered in Part 4.)

6. For Re < 3 x 10⁶, the boundary layer transits directly to turbulent flow at some point on the forward face, and the boundary layer remains totally attached over the surface until it separates at an angular location slightly less than 120° on the back surface. For this regime of flow, CD actually increases slightly with increasing Re because the separation points on the back surface begin to move closer to the top and bottom of the cylinder, producing a fatter wake, and hence larger pressure drag.

In summary, from the photographs and sketches in this section, we see that the real flow over a circular cylinder is dominated by friction effects, namely, the separation of the flow over the rearward face of the cylinder. In turn, a finite pressure drag is created on the cylinder, and d’Alembert’s paradox is resolved.

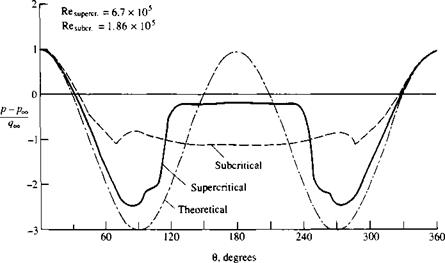
Let us examine the production of drag more closely. The theoretical pressure distribution over the surface of a cylinder in an inviscid, incompressible flow was given

image296

Figure 3.49 Pressure distribution over a circular cylinder in low-speed flow. Comparison of the theoretical pressure distribution with two experimental pressure distributions—one for a subcritical Re and the other for a supercritical Re.

in Figure 3.29. In contrast, several real pressure distributions based on experimental measurements for different Reynolds numbers are shown in Figure 3.49, and are compared with the theoretical inviscid flow results obtained in Section 3.13. Note that theory and experiment agree well on the forward face of the cylinder, but that dramatic differences occur over the rearward face. The theoretical results show the pressure decreasing around the forward face from the initial total pressure at the stagnation point, reaching a minimum pressure at the top and bottom of the cylinder (i9 — 90° and 270°), and then increasing again over the rearward face, recovering to the total pressure at the rear stagnation point. In contrast, in the real case where flow separation occurs, the pressures are relatively constant in the separated region over the rearward face and have values slightly less than freestream pressure. (In regions of separated flow, the pressure frequently exhibits a nearly constant value.) In the separated region over the rearward face, the pressure clearly does not recover to the higher values that exist on the front face. There is a net imbalance of the pressure distribution between the front and back faces, with the pressures on the front being higher than on the back, and this imbalance produces the drag on the cylinder.

Return to Figure 3.44, and examine again the variation of CD as a function of Re. The regimes associated with the very low Reynolds numbers, such as Stokes flow for Re «5 1, are usually of no interest to aeronautical applications. For example, consider a circular cylinder in an airflow of 30 m/s (about 100 ft/s, or 68 mi/h) at standard sea level conditions, where Poo = 1-23 kg/m3 and = 1.79 x 10“5 kg/(m • s). The smaller the diameter of the cylinder, the smaller will be the Reynolds number.

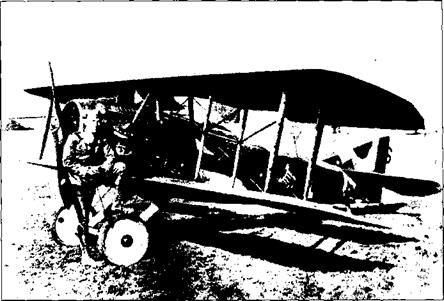
speed of the SPAD was 130 mi/h, or 57.8 m/s. For this velocity at standard sea level, we have

With this value of Re, we are beginning to enter the world of practical aerodynamics

Applied Aerodynamics: the Flow over a Circular Cylinder—the Real Case

image297

Figure 3.50 The French SPAD XIII, an example of a strut-and-wire biplane from World War I. Captain Eddie Rickenbacker is shown at the front of the airplane. (Courtesy of U. S. Air Force.)


for the flow over cylinders. It is interesting to note that, from Figure 3.44, Сд = 1 for the wires on the SPAD. In terms of airplane aerodynamics, this is a high drag coefficient for any component of an aircraft. Indeed, the bracing wires used on biplanes of the World War I era were a source of high drag for the aircraft, so much so that early in the war, bracing wire with a symmetric airfoil-like cross section was utilized to help reduce this drag. Such wire was developed by the British at the Royal Aircraft Factory at Farnborough, and was first tested experimentally as early as 1914 on an SE-4 biplane. Interestingly enough, the SPAD used ordinary round wire, and in spite of this was the fastest of all World War I aircraft.

This author was struck by another example of the effect of cylinder drag while traveling in Charleston, South Carolina, shortly after hurricane Hugo devastated the area on September 28, 1989. Traveling north out of Charleston on U. S. Route 17, near the small fishing town of McClellanville, one passes through the Francis Marion National Forest. This forest was virtually destroyed by the hurricane; 60-ft pine trees were snapped off near their base, and approximately 8 out of every 10 trees were down. The sight bore an eerie resemblance to scenes from the battlefields in France during World War I. What type of force can destroy an entire forest in this fashion? To answer this question, we note that the Weather Bureau measured wind gusts as high as 175 mi/h during the hurricane. Let us approximate the wind force on a typical 60-ft pine tree by the aerodynamic drag on a cylinder of a length of 60 ft and a diameter of 5 ft. Since V = 175 mi/h = 256.7 ft/s, Poo = 0.002377 slug/ft3, and

(0.002377) (256.7)(5)
3.7373 x 10-[11]

= 8.16 x 10[12]

Подпись: Poo vxd До©

= 3.7373 x 10⁻⁷ slug/(ft • s), then the Reynolds number is

Examining Figure 3.44, we see that Сд = 0.7. Since Сд is based on the drag per unit length of the cylinder as well as the projected frontal area, we have for the total drag exerted on an entire tree that is 60 ft tall

D = qocSCo = PooVl(d)(60)CD

= і (0.002377)(256.7)2(5)(60)(0.7) = 16,446 lb

a 16,000 lb force on the tree—it is no wonder a whole forest was destroyed. (In the above analysis, we neglected the end effects of the flow over the end of the vertical cylinder. Moreover, we did not correct the standard sea level density for the local reduction in barometric pressure experienced inside a hurricane. However, these are relatively small effects in comparison to the overall force on the cylinder.) The aerodynamics of a tree, and especially that of a forest, are more sophisticated than discussed here. Indeed, the aerodynamics of trees have been studied experimentally with trees actually mounted in a wind tunnel.6

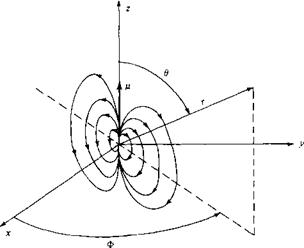
Three-Dimensional Doublet

Подпись: or image471 Подпись: [6.8]

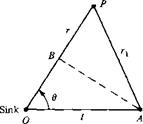
Consider a sink and source of equal but opposite strength located at points О and A, as sketched in Figure 6.2. The distance between the source and sink is l. Consider an arbitrary point P located a distance r from the sink and a distance rx from the source. From Equation (6.7), the velocity potential at P is

Let the source approach the sink as their strengths become infinite; that is, let

In the limit, as / —> 0, r — rx —> OB = l cosd, and rrx —»■ r2. Thus, in the limit, Equation (6.8) becomes

Подпись: X lcos 9 An r2, X r-rx

Ф = — hm————–

An rrx

Three-Dimensional Doublet

Three-Dimensional Doublet

or


[6.9]


image472

Figure 6.2 Source-sink pair. In the limit as / -»• 0, a three-dimensional doublet is obtained.


where д = Л/. The flow field produced by Equation (6.9) is a three-dimensional dou­blet’ д is defined as the strength of the doublet. Compare Equation (6.9) with its two­dimensional counterpart given in Equation (3.88). Note that the three-dimensional effects lead to an inverse r-squared variation and introduce a factor 47Г, versus 2тг for the two-dimensional case.

Three-Dimensional Doublet Подпись: [6.10]

From Equations (2.18) and (6.9), we find

The streamlines of this velocity field are sketched in Figure 6.3. Shown are the streamlines in the zr plane; they are the same in all the zr planes (i. e., for all values of Ф). Hence, the flow induced by the three-dimensional doublet is a series of stream surfaces generated by revolving the streamlines in Figure 6.3 about the г axis. Compare these streamlines with the two-dimensional case illustrated in Figure 3.18; they are qualitatively similar but quantitatively different.

Note that the flow in Figure 6.3 is independent of Ф; indeed, Equation (6.10) clearly shows that the velocity field depends only on r and 9. Such a flow is defined as axisymmetric flow. Once again, we have a flow with two independent variables. For this reason, axisymmetric flow is sometimes labeled “two-dimensional” flow. However, it is quite different from the two-dimensional planar flows discussed ear­lier. In reality, axisymmetric flow is a degenerate three-dimensional flow, and it is somewhat misleading to refer to it as “two-dimensional.” Mathematically, it has only two independent variables, but it exhibits some of the same physical characteristics as general three-dimensional flows, such as the three-dimensional relieving effect to be discussed later.

Three-Dimensional Doublet

image473

Figure 6.3 Sketch of the streamlines in the zr plane

(Ф = constant plane) for a three-dimensional doublet.