Category Noise Sources in Turbulent Shear Flows

Sound Radiation by a Baffled Panel Subject to TBL Exciation

The formulation presented in the section above has provided a general modelling framework for the structural-acoustic coupled response of a closed shell, which is excited by the pressure field exerted by the TBL fluid flow. A simplified model problem is now considered in order to identify the principal properties of the interior sound radiation generated by a flexible wall subject to a TBL pressure field. As schematically shown in Figure 7, the model problem considered here comprises a thin flat rectangular panel, which is baffled and immerged in an unbounded fluid. The panel is excited by a TBL pressure field on the outer side and radiates sound to the inner side. The panel is considered to be immerged in air, in which case, based on the considerations presented in Section 1.5, the so called “weakly coupled response” is derived by neglecting the fluid loading effects on both sides of the panel. This type of model provides the principal features for the sound radiation to the interior of a large and heavily damped enclosure produced by a section of the enclosure wall.

For this type of problem, the interior sound radiation is expressed in terms of the time-averaged total radiated sound power Pr, which can be derived with the following formula:

[29] Also for this system, as shown in shown in Figure 7, the standard notation used for the Helmholtz integral equation is used where the vector n points away from the acoustic domain, thus vn (x s) = – W (x s) .

[30] NVH stands for Noise Vibration Harness

Active Treatments to Reduce Sound Radiation

In parallel to passive treatments, active control systems can also be added to shell structures in order to reduce their vibration and sound radiation (Maury et al. 2001; Maury et al. 2002c). The fundamental principles of active noise control dates back to the 1930’ (Gardonio 2010), however it took more than 50 years before the first applications were developed. This was due to both intrinsic limitations in the speed of the electronics for the controllers and to the limited technologies available for the sensor and actuator transducers. Nevertheless, the progress in digital electronics occurred in the second half of the twentieth century has brought to the development of fast processors with high computing power that enables the implementation of multi-channel controllers, which can manage the small time delays allowed for the implementation of noise and vibration control algorithms. In parallel, new types of transducers were developed, which have brought to the conception of new control systems. For example arrays of small size piezoelectric patch actuators or thin piezoelectric films were embedded in thin plates or shells to form composite structures with active layers (Bianchi et al. 2004; Aoki et al. 2008; Gardonio et al. 2010; Gardonio 2012). Alternatively electromechanical or magnetostrictive transducers were used to build small size proof-mass actuators that can be attached to thin structures to produce localised active effects (Preumont 2002; Preumont 2006; Gonzalez Diaz et al. 2008a; Gonzalez Diaz et al. 2008b; Gardonio and Alujevic 2010; Alujevic et al. 2011; Rohlfing et al. 2011). Such “smart structures” can be effectively used for the implementation of the so called “Active Structural Acoustic Control” (ASAC) systems for the reduction of the sound radiation by thin structures (Fuller et al. 1996; Gardonio and Elliott 2004; Gardonio and Elliott 2005b; Gardonio 2012).

In this section the basic principles of ASAC control are reviewed and then two examples of ASAC smart panels are described in more details with reference to the control of vibration and sound radiation due to a TBL excitation pressure field. Section 2 has shown that sound radiation is a rather complex phenomenon, which depends on the self and mutual radiation efficiencies between pair of modes of the structure. The fact that, as shown in Figure 8, at certain frequency bands the mutual radiation efficiencies may assume negative values indicates that the interaction between the vibration of pair of modes may lead to a “natural” reduction of the total radiation of noise. Thus, it is not so clear-cut that reducing the response of clusters of structural modes, for example of low order modes, leads to the control of the sound radiation at low frequencies. On the contrary it may bring to an increment of the sound radiation at some narrow frequency bands since the natural reduction of sound radiation between certain pairs of modes has been prevented. Several authors have studied the implementation of specific vibration control approaches aimed at the reduction of the sound radiation by structures. In this chapter the formulation proposed by Elliott and Johnson (1993) for the description of the sound radiation in terms of a new set of modes of the structure, which radiates sound independently, is considered. This is a simple and elegant formulation which directly leads to the conception of a new control paradigm where the sound radiation is reduced by controlling the vibration field of the most efficient radiation mode(s) of the structure. The formulation is based on the fact that the matrix a (®) with the self and mutual radiation efficiencies defined in Eq. (65) is normal, i. e. it is real, symmetric and positive definite. Thus the following eigenvalue-eigenvector decomposition can be implemented,

A»=P(®)rfi(®)P(®) , (85)

where p(®) is the [r x m ] orthogonal matrix of eigenvectors and a(®) is the [r x r ] diagonal matrix with real and positive eigenvalues. Therefore, the expression for the radiated sound power PSD in Eq. (64) can be rewritten as follows

Active Treatments to Reduce Sound Radiation

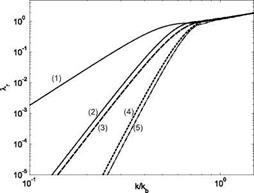
Figure 15. First five radiation efficiencies of the radition modes derived from the eigenvalue-eigenvector problem in Eq. (85).

SPr = 1 ®2Tr[П(®)Saa (®)] , (86)

where Saa (®) is the matrix of PSDs of the transformed complex modal responses а(®) that radiate sound independently from each other

a(ffl) = P (ffl)b (®) . (87)

Thus, considering Eq. (66), the matrix of the new modal responses Saa(a) is given by

Saa(®) – P(®)Y(®)Spp(®)Y"(w)P(w) . (88)

According to Eq. (85), the diagonal matrix with the eigenvalues П(«) provides the self radiation efficiencies of the new set of vibration modes, whose shapes can be reconstructed by linearly combining the natural modes of the panel with the eigenvectors. Thus the j-th radiation mode is given by

¥j (x, У, а) = ф(*, y)PT (®) (89)

where P,(®) is the j-th row of the matrix P(®). This expression indicates that the

radiation modes are frequency dependent. The plot in Figure 15 shows the first six eigenvalues, that is the first six radiation efficiencies, with reference to the ratio between the acoustic and flexural wave numbers k/kb in logarithmic scale.

Active Treatments to Reduce Sound Radiation Active Treatments to Reduce Sound Radiation

(2,1)

Подпись: (3) Подпись: (3)

(1,2)

Подпись: (4) Подпись: (4)

(3,1)

Active Treatments to Reduce Sound Radiation

(2,2)

The graph shows that, similarly to the self radiation efficiencies of the structural modes, the radiation modes are also characterised by rather small radiation efficiencies at low frequencies, which however rise rapidly with frequency up to the critical frequency where к = kb. At higher frequencies the radiation rises

further but at a lower rate. At low frequencies the radiation efficiency of the second and higher order radiation modes is much lower than that of the first radiation mode. Thus it is expected that controlling the vibration field related to

Подпись: (a) 3 x 3 array of velocity feedback loops with point sensors/actuators Подпись: (b) single velocity feedback loop with distributed sensor/actuator

Figure 17. Sound radiation induced by TBL pressure field on smart panels
composed of: (a) a 3×3 array of decentralised velocity feedback loops using
idealised point velocity and point force sensor-actuator pairs and (b) a single
velocity feedback using an idealised distributed volume velocity sensor and an
idealised distributed uniform force actuator pair.

the first radiation mode should lead to a consistent reduction in the sound
radiation particularly at low frequencies below the critical frequency where
к = kb. The graphs in Figure 16 show the first five structural modes (column a)

and then the first five radiation modes at 100 and 800 Hz (respectively columns b and c) for the panel considered in this study. The first and most efficient radiation mode is therefore characterised by a volumetric shape, which tends to be rounded off along the borders as the frequency rises. This leads to the conclusion that, in order to control the vibration field of the panel associated to the first radiation mode, and thus to control the low frequency sound radiation, it is necessary to reduce the volumetric vibration of the panel. This may be achieved with an active system, which uses a distributed actuator that exerts a uniform force over the panel surface in such a way as to minimise an error signal provided by a sensor that measures the volumetric vibration of the panel. In principle, a multiple channel controller can be used, which simultaneously controls two or more radiation modes. However, this would be a rather complex system that marginally increments the control effects at low frequencies. In general, the active control of sound and vibration is based on two control architectures. When the primary disturbance to be controlled can be detected in advance, a feed-forward control architecture is implemented, which drives the control actuators in such a way as to produce a secondary acoustic or vibration field that destructively interferes with the primary disturbance field (Gardonio 2012). Alternatively, when the primary disturbance cannot be detected in advance, a feedback control architecture is used, which tends to modify the dynamic response of the system in such a way as to reduce the effect of the
primary disturbance (Gardonio 2012). Since the pressure field generated by TBL excitations is stochastic (both in time and in space domains) it is rather difficult to collect the reference signals that would allow the implementation of feed­forward control systems. Thus, feedback control systems are normally implemented to contrast the effects produced by TBL disturbances. In this chapter the two smart panels with the feedback systems shown in Figure 17 will be considered. System (a) comprises a 3x 3 array of decentralised feedback loops composed of an idealised force actuator with a collocated velocity sensor. The second system consists of a distributed uniform force actuator with a matched volume velocity sensor that implements a single absolute velocity feedback loop. In this case the feedback loop is aimed at controlling the volumetric vibration field of the panel, which, as discussed above, is the major contributor to sound radiation. The control of both feedback loops is proportional to velocity, thus it produces a damping effect. For this reason, these control systems are often reported as “active damping systems”. When the feedback loop or loops are implemented, the structural modal admittance matrix Y used to derive the kinetic energy PSD and radiated sound power PSDs is derived from the following modified version of Eq. (70)

[-аз2M + K(1 + Jrj) + JaDbr = fr, (90)

thus Y = [- a2M + K(1 + j^) + J«d] 1. The elements of the “active damping matrix” D for the system with the 3x 3 array of feedback loops are given by

Dpq =Z (X aMq (X s, ) , (91)

г-1

where g s is the gain implemented in the feedback loops and the vectors X a, i and Xs, i identify the positions of the i-th control actuator and i-th error sensor, which

are collocated in the specific case under consideration. The elements of the “active damping matrix” D for the system with the distributed uniform force actuator and distributed volume velocity sensor are instead given by

Dpq = gs Фр (xs)dSb JS фч (xs)dSb. (92)

where gs is the gain implemented in the feedback loop. In summary the total kinetic energy PSD and total radiated sound power PSD for the smart panels with arrays of point feedback loops or with a single feedback loop using distributed transducers have been derived from Eqs. (55) and (64) with the matrix of modal response PSDs S bbO) derived with Eq. (66) using the

Подпись: (b) 3x3 decentralised velocity feedback 102 1 03 1 04 Frequency [Hz]
Active Treatments to Reduce Sound Radiation

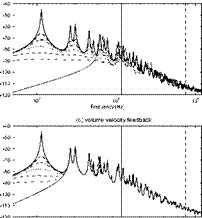
Figure 18. PSD of the total kinetic energy (left-hand side plots) and total radiated sound power (right-hand side plots) per unit TBL pressure field PSD. Thick solid lines reference panel. Broken and solid-faint lines in plots (a, b) reference panel with 3×3 array of point velocity feedback loops with increasing feedback gains up to the optimal value that minimises the radiated sound power. Broken and solid-faint lines in plots (c, d) reference panel with the volume velocity-uniform force feedback loop with increasing feedback gains.

following expression for the matrix of modal addmittances У(ю) = [- су2 M + K (1 + jq) + jaDt]1.

Plots (a) and (b) in Figure 18 show the spectra of the total kinetic energy PSD and total radiated sound power PSD as the control gains of the 3×3 array of velocity feedback loops are increased. The broken and solid-faint lines in the two plots indicates that, as the feedback control gains are increased, the active damping action exerted by the feedback loops smoothens the resonance peaks of the low order modes of the panel. Thus, this system can effectively reduce both the response and sound radiation at low frequencies where, as discussed in Section 3, passive treatments are less effective. The principal reason why this active system is so effective at low frequencies is because the damping effect produced by the feedback loops is proportional to the absolute transverse velocity of the panel. Thus the so called “sky-hook” active damping effect is produced (Preumont 2002), which effectively reduces the flexural response and sound radiation of the panel. In contrast, the action of a passive damping
treatment is proportional to the strain rate in the structure, which is particularly small at low frequencies where the response is controlled by the lower order modes whose shapes are shown in column (a) of Figure 16. Plots (a) and (b) show that, if the control gains are set to very large values, the response and sound radiation at mid frequencies become even larger than those of the reference panel without control system. This phenomenon is due to the fact that for very large feedback gains, control loops tend to pin the panel at the control positions (Gardonio and Elliott 2005a). Thus the loops do not absorb energy, that is they do not produce active damping anymore. They in fact introduce new boundary conditions, which lead to new set of modes with higher natural frequency. Thus the response and sound radiation of the panel become those of a new, stiffened, panel, with the natural frequencies of the fundamental and low order modes shifted to higher frequencies. As a result, the mid frequency response and sound radiation are increased with respect to those of the reference panel. In conclusion, the 3×3 array of velocity feedback loops produces a very effective sky-hook active damping action which is maximum for a given set of feedback gains. The optimal feedback gains for the minimisation of the response, and thus sound radiation, are very similar to each other (Gardonio and Elliott, 2004). Zilletti et al. (2010) have shown that these correspond to the condition of locally maximising the power absorbed by each feedback loop. This is a very interesting result since it indicates that the feedback loops can be locally tuned without the need of a global cost function to be minimised. Moreover, since the control force is proportional to velocity, the power absorbed given by the product of the control force and control velocity, is in practice proportional to the square of the control velocity. Thus the velocity control sensor signal can be used to implement both the feedback loop and the tuning algorithm necessary to set the optimal control gain.

Plots (c) and (d) in Figure 18 show the kinetic energy PSD and radiated sound power PSD as the control gain of the single feedback loop using a volume velocity distributed sensor and a uniform force distributed actuator is increased. In this case, the control system tends to smoothen the response and sound radiation of selected resonances of the panel. This is because the system can act only on those modes that have a non zero net volumetric component, that is those modes with both mode orders odd. Thus, for example, it cannot be effective on the (1,2), or (2,1) modes, which cause the second and third resonance peaks in the two spectra. However, in this case, since the control system acts on the approximated shape of the first radiation mode, the feedback effect rises indefinitely with the control gain. Thus, provided the control gain is set to large enough values, there is no need of an online tuning system of the control gain. Nevertheless, the control effect produced by this control configuration is relatively lower than that obtained with the decentralised system. It should be highlighted that this result is peculiar to the TBL pressure field primary excitation, which, as discussed in Section 2, effectively excites both volumetric and non volumetric modes.

The short analysis presented in this section about the implementation of active systems for the reduction of vibration and sound radiation by a thin panel excited by a TBL pressure field has been focused on the physics of these control systems. No discussion has been presented on the stability and practical implementation of the feedback loops. This is a very important aspect of the systems, which however lies outside the scope of this chapter. The reader who would like to learn more on this topic is referred to specialised text and articles, as for example those in references (Fuller et al. 1996; Clark et al. 1998; Preumont 2002; Fahy and Gardonio 2007; Gardonio 2012).

3. Acknowledgements

The author is very grateful to Dr Jens Rohlfing and Dr Michele Zilletti for their precious help in the production of simulation graphs and the editing of the text and formulation. Also a special thank goes to Silvia for her support throughout the preparation of the chapter.

[1] d2rp’ d2rp’

c2 dt2 dr2

[3] Identical results are obtained if the analysis is performed in the fixed reference frame if the fixed reference frame cross correlation is obtained by a coordinate transformation from the moving frame as given by Eqn. (22). (See Morris et al. (2002)).

[4]The inclusion of (1 – kM) eliminates the first derivative from the differential operator in the resulting equation.

[5]There are some exceptions to this statement. These cases are described in Section 6.1

[6]ln fact the wave equation can, alternatively, be expressed in terms of a velocity poten­tial, ф, from which density (p = dt), pressure (p = ) and velocity (u = V0) can

all be derived.

[7] In what follows we will see that the flow equations can be manipulated such that this source represents the turbulent jet.

[8]This region is now known to be one of the most important in terms of sound production, but was not known at the time of Lighthill’s first estimates of the sound power radiated by a flow

[9]In 1952 measurement and computational capabilities were such that it was not possible to access full-field data; the two-point correlations were about the best that could be achieved.

[10]The power spectrum is given by taking the Fourier transform

[11]see section 5 for an exposition of POD

[12]This shows that the arbitrary introduction of disturbances to, and subsequent com­parison of, two different analogies cannot provide an unambiguous assessment, in an absolute sense, of the relative robustness of the two formulations. For, if the gradients

[13] Or, stated otherwise, the extent to which that mode is aligned with the propagation operator. If we find that certain modes are not so aligned, this will be an indication that there neglect constitutes a pertinent modelling simplification.

[14]It is true that the LES does not provide a full Navier Stokes solution, being based on filtered equations; we nonetheless consider that it provides a relatively complete rep­resentation of the behaviour of the larger structures, which are those we are interested in here.

[15]In the first study this filter is rather heuristic, being based simply on flow visualisation following the application of Fourier and wavelet transforms; in the second, the filter has a rigorous mathematical definition.

[16]A detalied presentation of LSE is provided in section §5.

[17]The wavelet transform is presented in section §5.

[18]where the pressure is concerned it is, in zone C, predominantly hydrodynamic, while in zone B it contains a increasing proportion of acoustic fluctuation as we move radially away from the jet through zone B

[19] Note that a could comprise both space and time coordinates, and the averaging oper­ation, over b, could be, for example, a phase – or ensemble-average.

[20]In what follows we will drop the the subscript t.

[21]See section §5 for details.

[22]see Noack et al. (2011) for details

[23]The notation evidencing the retarded time is not reported for clarity. Interested readers

in Chapters 1 and 2.

can find a more detailed presentation of this equation and of its theoretical framework

[26] V-n —jn (Junger and Feit 1986).

[27]Ep = ®2Tr[Sqq (Ю)] > (47)

2pc0

where Tr[…] is the trace of the matrix Sqq with the self and mutual PSDs of the acoustic modal responses, which is given by

Passive Treatments to Reduce Sound Radiation

The previous section has shown that the sound radiated to the interior of a distributed thin wall structure is a complex phenomenon that depends on the characteristics of the excitation field, the flexural response of the structure and the radiation properties of the structure. Normally, for a NVH[30] engineer it is rather difficult to work on the excitation and sound radiation aspects in a transportation vehicle, since they strongly depend on the operation conditions and interior design of the vehicle. Thus, the most common option left to reduce noise transmission to the interior is to modify the flexural response of the body of the vehicle. In general, the flexural response of a thin structure is determined by three parameters: a) the mass per unit area, b) the flexural stiffness and c) the structural or fluid damping. Normally structural energy dissipation is modelled

by considering a complex modulus of elasticity E = E(1+jrj), where n is the

Подпись: (b) stiffness tretment (c) damping tretment increased Young s modulus Ep>Ep increased loss factor

(a) mass tretment

Подпись: чЭ ^ чЭ чЗ^ чЭ ^ чЗ S I 12

increased density: Pp>Pp

Figure 13. Sound radiation induced by a TBL pressure field acting on a panel
with (a) mass treatment; (b) stiffness treatment and (c) damping treatment.

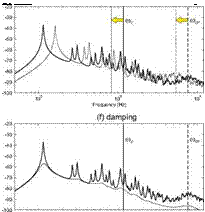
loss factor (Cremer et al. 1988; Fahy and Gardonio 2007). As discussed in Section 1.5, the energy dissipation arising from the fluid loading on the structure is a complex phenomenon, which however, for light fluids can be modelled in terms of modal damping ratios. In practice, the implementation of passive sound insulation treatments always produces a combination of mass, stiffness and damping effects. However, the treatment can be focused on one of the three properties and described as a mass, or stiffness, or damping treatment. Thus, as schematically depicted in Figure 13, in this section the sound radiation of the panel excited by the TBL pressure field considered in the previous section is analysed with reference to variations in turn of the density (mass-treatment), Young modulus of elasticity (stiffness treatment) and structural loss factor (damping treatment) of the panel. Figure 14 shows the spectra for the total kinetic energy PSD (left-hand side plots a, c, e) and total radiated sound power PSD (right-hand side plots b, d, f) in presence of mass (plots a, b), stiffness (plots c, d) and damping (plots e, f) treatments. The thick-solid lines in the plots show the kinetic energy and radiated sound power spectra for the reference panel considered in the previous section. The solid faint lines show the spectra when one of the three properties are varied. Also, the variations of the acoustic coincidence frequency (thick-dashed vertical line) and convective coincidence frequencies (thick-solid vertical line) are indicated by a thin-dashed vertical line and a thin-solid vertical line respectively.

The effect of increasing by a factor 2 the mass density of the panel is analysed first. Plots (a) and (b) show that the first few resonance frequencies shift to lower values. Also, the transition from a spectrum with well separated resonance frequencies to a smoother spectrum characterised by the overlap of multiple resonant modes at each frequency occurs at lower frequencies. In fact, according to Eq. (80), the modal overlap grows more rapidly with frequency as the mass density is increased. The thick-solid (for the reference panel) and faint – solid (for the heavier panel) vertical lines in the two plots highlight that the increment of mass density shifts to higher frequencies the convective coincidence effect. In particular, as can be deduced from Eq. (83), the convective coincidence frequency of the reference panel at about 1.17 kHz is increased by a factor ^m’p/mp = 42 to about 1.65 kHz for the panel with double density. At

higher frequencies the spectra for the reference and heavier panels become increasingly smoother. It is interesting to note that the levels of the two spectra for the kinetic energy nearly coincide while the levels of the two spectra for the radiated sound power are about 6 dB apart. This discrepancy between the two plots should not mislead the reader. In fact, the kinetic energy plot gives the level of the response of the panel weighted by the mass of the panel. Thus, if the spectrum of the spatially averaged squared transverse velocity PSD was plotted,

Passive Treatments to Reduce Sound Radiation Passive Treatments to Reduce Sound Radiation

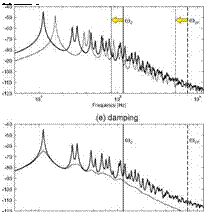
Figure 14. PSD of the total kinetic energy (left-hand plots) and total radiated sound power (right-hand plots) per unit turbulent boundary layer pressure field PSD. Thick solid lines reference panel; faint solid lines (a, b) panel with double mass density; (c, d) panel with double Young’s modulus; (e, f) panel with ten times higher loss factor. Solid and dashed vertical lines identify the convective coincidence frequency and acoustic critical frequency for the reference panel (thick-lines) and for the panel with passive treatments (faint-lines).

when Np > 1, the two spectra for the reference and heavier panel would be

separated by a factor proportional to mp/m’p = 1/2, which corresponds to -6 dB.

Finally, considering the spectra for the radiated sound power PSD in plot (b), it is noted that, when the panel density is increased, the typical wide band ridge due to efficient sound radiation of all modes of the panel is shifted up in frequency. In fact, according to Eq. (82) the critical frequency for the heavier

panel is increased by a factor ^mpjmp = 42 with respect to that of the reference
panel. Thus, as highlighted by the thick-dashed and thin-dashed vertical lines in plot (b), the critical frequency of the reference panel at about 7.54 kHz is shifted up to about 10.67 kHz for the heavier panel.

The effect of increasing by a factor 2 the panel material Young’s modulus of the panel is considered next. Plots (c) and (d) of Figure 14 show that the increased stiffness of the panel shifts the resonance frequencies of the fundamental and low order modes of the panel to higher values. Also, the transition from a spectrum with well separated resonance frequencies to a smoother spectrum occurs at relatively higher frequencies. This is because, as can be deduced from Eq. (80), when the stiffness of the panel is increased, the modal overlap factor grows less rapidly with frequency. The thick-solid and faint-solid vertical lines in the two plots indicate that, when the stiffness of the panel is increased, the convective coincidence effect in the two spectra is shifted down from about 1.17 kHz to about 826 Hz. In fact, according to Eq. (83), the convective coincidence frequency of the stiffer panel is varied by a factor proportional to pp/B’p = 1/V2 . At higher frequencies, where Np > 1 and thus

the two spectra become increasingly smoother, the spectrum of the kinetic energy of the stiffer panel is about 3 dB lower than that of the reference panel, while the levels of the spectra of the radiated sound power for the reference and stiffer panel are the same. Finally, the spectra for the radiated sound power in plot (d), show that, in this case, the typical wide band ridge due to efficient sound radiation of all modes of the panel is shifted down in frequency. In fact, according to Eq. (82) the critical frequency for the stiffer panel is varied by a factor ifBjB’P = 1/V2 with respect to that of the reference panel. Thus, as

highlighted by the thick-dashed and faint-dashed vertical lines in plot (d), the critical frequency of the reference panel at about 7.54 kHz is shifted down to about 5.33 kHz for the stiffer panel.

At last, the effect of increasing by a factor 10 the material loss factor of the panel is considered. According to Eqs. (82) and (83), damping has no effects on the acoustic and the convective coincidence phenomena. Thus the thick and faint solid or dashed vertical lines shown in plots (e) and (f) overlap. The two graphs also show that the damping does not shift the resonance frequencies of the lower order modes. However, as can be deduced from Eq. (80), damping has an important effect on the modal overlap factor. In particular, the doubling of the loss factor produces a doubling of the overlap factor so that the transition from a response characterised by well separated resonances to a smoother spectrum characterised by the overlap of multiple modes is shifted to lower frequencies. The spectra in plots (e) and (f) show that the increment of damping in the panel also reduces the amplitudes of the resonance peaks, due to the fundamental and low order modes, which are still well separated from each other. Finally, the two plots show how an increase in the loss factor effectively reduces the levels of the spectra of the kinetic energy and radiated sound power as the frequency rises. For instance, when the frequency approaches the critical frequency at about 7.54 kHz, both the kinetic energy and the radiated sound power spectra have fallen by about 10 dB in contrast to the values for the reference panel.

In summary, adding mass to a partition produces two important beneficial effects: first it reduces the level of the response and sound radiation and second it moves to higher frequencies the convective and acoustic coincidence effects. This second effect is particularly important since human annoyance to noise is particularly important at mid audio frequencies, thus in the range from 1 to 4 kHz. Increasing the stiffness of the partition shifts to higher frequencies the resonances of the fundamental and lower order modes of the panel. However it has little effects on the level of the response and radiated sound power and, more importantly, it tends to shift to lower frequencies the convective and acoustic coincidence effects. This is a rather undesirable effect since it tends to compress the two coincidence phenomena towards the mid audio frequency range, which is particularly critical in terms of noise annoyance perception. Finally, increasing damping is generally beneficial although it normally affects the higher frequency portion of the spectrum where the response and sound radiation of the structure are in any case relatively low.

TBL excitation

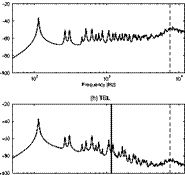
The response and sound radiation of the panel when it is excited by the fully developed TBL pressure field is finally studied with reference to the spectra of the total kinetic energy PSD and total sound power radiated PSD shown in plots (g) and (h) of Figure 11. At low frequencies, the spectrum of the kinetic energy PSD is similar to that for the panel excited by the uncorrelated pressure field shown in plot (e). In fact, the response is characterised by well separated sharp resonance peaks of all natural modes with either odd or even mode orders. However, in contrast to what found with the ROR excitation, in this case the amplitude of the resonance peaks is uneven. These effects are produced by two concomitant properties of the TBL excitation. On one hand, as seen for the ROR excitation, the TBL pressure field is composed by a stochastic distribution of small patches of transverse force excitations that couples efficiently with all modes of the panel. On the other hand, the convected fluid tends to smear these excitations in a waved pattern along the stram-wise direction. Thus the coupling of the waved excitation field with the resonant modes varies depending on the plate mode order in the direction of the fluid flow. At about 1.17 kHz, the spectrum of the response PSD shows a small ridge, which is due to the so called “convective coincidence” or “aerodynamic coincidence” effect. As discussed in Chapter 6, the vortexes that develop in the TBL fluid flow are conveyed in the stream-wise direction at the convective velocity Uc. Thus the pressure field generated over the panel is characterised by an exponentially decaying correlation function in span-wise direction and a weaved exponentially decaying correlation function in stream-wise direction, whose characteristic wave length is given by Xc = 2^/kc, where kc = co/Uc is the convective wave number. As a

result, the panel is efficiently excited at frequencies close to the so called “convective coincidence frequency”, where the wavelength of the flexural vibration in the flow direction coincides with the correlation wavelength that characterises the TBL pressure field in the stream-wise direction, i. e. =XC. This condition implies that kb = kc and thus, considering that

TBL excitation Подпись: (83)

kb =^cb =4a{mpjBp and kc = a/Uc, the convective coincidence frequency can be readily derived as follows:

This expression suggests that the convective coincidence frequency grows with the square of the convective speed Uc. Recalling that the convective speed is a

fraction of the flow velocity, i. e. Uc = KUm with 0.6 <K<0.85 and comparing

Eq. (83) and Eq. (82) for the lower acoustic coincidence frequency, it is noted that

TBL excitation(84)

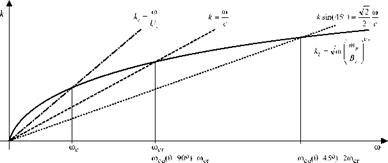
Thus, even for a sonic speed of the flow, i. e. Um – c, the convective coincidence frequency is 1.4 to 2.8times smaller than the critical frequency. When the speed of the flow is lower than the speed of sound, the convective coincidence frequency becomes much smaller than the lowest acoustic coincidence frequency. Thus, for most vehicles, the convective coincidence effect is likely to occur in the low to mid audio frequency range where noise is mostly perceived as a source of annoyance and, as will be discussed in the next section, passive sound insulation treatments are less effective. Indeed, as can be noted in plot (g), the spectrum of the kinetic energy is characterised by a wide band ridge around the convective coincidence frequency that, as highlighted by the thick-solid vertical line, for the panel and flow conditions at hand, occurs around 1.17 kHz. As seen for the acoustic coincidence phenomenon, the convective coincidence can also be analysed in terms of dispersion curves for the flexural wave and for the fluid-dynamic convective effect. As an example, Figure 12 shows the dispersion curves for the plate flexural wave and for the TBL fluid flow considered in this study. The two curves intersect at kb = kc, that is at the convective critical frequency a>c.

Moving back to the analysis of plot (g), at frequencies above the convective coincidence frequency, which is highlighted by the thick-solid vertical line, the spectrum of the kinetic energy becomes increasingly smoother, since the response of the panel at each frequency is due to the overlap of an increasing larger number of modes. As a result, the spectrum is characterised by wide frequency band crests with multiple resonant modes, spaced out by wide frequency band troughs. The spectrum of the kinetic energy falls rapidly with a 12 dB / octave slope, thus following the so called “stiffness law”, since the response is controlled by the stiffness of the panel. The spectrum continues to fall rapidly even at very high frequencies around acoustic coincidence.

Considering now the sound power radiated, by contrasting plots (h) and (f), it is noted that, below and around the convective coincidence frequency, which is highlighted by the thick-solid vertical line, the spectrum of the radiated sound power generated by the TBL excitation is quite similar to that produced by the ROR excitation, although the spectrum in plot (h) shows a much uneven sequence of resonance peaks. This is due to two phenomena. Firstly, as discussed above, the convected stochastic excitation field couples with all modes but
unevenly. Secondly, at frequencies below the acoustic critical frequency, the sound radiation efficiency varies from mode to mode. As seen for the kinetic energy in plot (g), at frequencies above the convective coincidence frequency, the spectrum of the radiated sound power in plot (h) becomes increasingly smoother, since the response of the structure is given by the overlap of an increasingly larger number of modes. Similarly to the spectra obtained for acoustic excitations in plots (b) and (d), the mean value of the spectrum in plot (h) tends to fall with a 6 dB / octave slope up to higher frequencies around the acoustic coincidence frequency, where the spectrum shows the characteristic wide band ridge with multiple resonance peaks due to the enhanced sound radiation properties of all modes. At further higher frequencies, the spectrum resumes the 6 dB / octave slope.

ROR excitation

The effects produced by the rain on the roof excitation are now analysed considering plots (e) and (f) of Figure 11. Considering first plot (e), it is noted that also in this case the spectrum of the kinetic energy is characterised by well separated resonances, which tend to become wide band crests as the frequency, and thus modal overlap effect, grows. However, contrasting this graph with the two kinetic energy graphs (a) and (c), it is clear that, when the panel is excited by a uniform distribution of uncorrelated forces, all resonant modes are efficiently actuated. This is due to the fact that, in contrast to acoustic excitations, the rain on the roof excitation is composed by a uniform distribution of fully uncorrelated forces, which equally couples with all natural modes of the panel. Hence the amplitude of the resonance peaks in the spectrum for the kinetic energy tends to be uniform, since the coupling between the ROR excitation field and modal response of the panel does not vary from one mode to another. The relative amplitude of the resonance peaks are solely dictated by the damping effect and by the overlap with neighbouring modes. As a result, at frequencies above the fundamental resonance of the panel, the amplitudes of the resonance peaks are rather uniform and the mean spectrum falls with a 3 dB/octave rate instead of the 6 dB/octave rate found for the plane wave and diffuse acoustic excitations. Thus, as one would expect, the mean spectrum of the panel kinetic energy due to a rain on the roof excitation follows that of the squared point mobility function for the ratio between the transverse velocity and transverse force. This trend carries on also around and beyond the critical frequency at about 7.54 kHz. This is due to the fact that there are no favoured frequencies, such as the acoustic coincidence frequency, where the excitation field effectively couples with the structural response of the panel.

Moving on to the radiated sound power, comparing plot (f) with plots (b) and (d), it is noted that the spectrum of the radiated sound power generated by a rain on the roof excitation presents remarkable differences with respect to the spectra generated by an acoustic plane wave or diffuse field excitations. For instance, in contrast to what found with the acoustic excitations, at low frequencies the sound radiation is characterised by many more resonance peaks, which are due to efficiently and non efficiently radiating modes. Thus the radiated sound power is characterised by a comparatively denser distribution of resonance peaks, which, at low frequency, are well separated and then, as the frequency and modal overlap rise, become wide frequency band crests characterised by the overlap of multiple resonant modes. Moreover the level of the spectrum of the radiated sound power remains constant up to about the critical frequency where it shows the typical wide band ridge. All this is due to two concomitant effects. Firstly, as discussed above, the rain on the roof uniform distribution of uncorrelated point forces equally excites all natural modes of the panel. Secondly, as discussed in (Fahy and Gardonio 2007), in contrast with the modal sound radiation, the sound radiation produced by point forces is constant with frequencies, thus it is very effective also at frequencies well below the critical frequency. Moving back to plot (f), at higher frequencies around the critical frequency at about 7.54 kHz, the sound radiation shows the typical wide frequency band ridge with multiple resonance peaks, which is due to the fact that all structural modes effectively radiates sound.

ADF excitation

The effects produced by the acoustic diffuse field excitations are considered next with reference to the spectra of the total kinetic energy PSD and total radiated sound power PSD shown in plots (c) and (d) of Figure 11. At frequencies below acoustic coincidence, the spectrum of the kinetic energy is similar to that found for the 45o acoustic plane wave excitation (thick-solid line in plot (a)). Thus, above the first resonance frequency of the plate, the spectrum of the kinetic energy tends to fall following the mass law with a 6 dB/octave slope. Also, the spectrum becomes increasingly smooth and characterised by wide band crests due to the overlapping of a linearly increasing number of modal responses. Around the critical frequency at about 7.54 kHz, the spectrum shows the wide frequency band ridge with multiple resonance peaks. However, this ridge is relatively modest in comparison to that found for the grazing acoustic plane wave excitation and extends over a wider frequency band. This is because, as schematically shown in Figure 9(b), the acoustic diffuse field excitation is composed by acoustic plane waves with a uniform distribution of angles of incidence. Thus the excitation coincidence phenomenon extends to all frequencies starting from the critical frequency (highlighted by the thick-dashed vertical line) to infinity. Since the energy of the diffuse excitation field is equally divided between waves at all angles of incidence, the excitation coincidence phenomenon at every frequency, and thus for every angle of incidence, is not as strong as that for the single plane wave with a fixed angle of incidence. However, it spans over a much wider frequency range, ideally up to infinity.

In general the observations made for the spectrum for the total kinetic energy also apply to the spectrum for the total radiated sound power. In fact, for frequencies below acoustic coincidence, the radiated sound power shown in plot (d) is similar to that found for the 45o acoustic plane wave excitation (solid line in plot b). Thus, at low frequencies, the spectrum of the radiated sound power PSD is characterised by a smaller number of well separated resonances since the sound radiation mechanism tends to filter out those resonances due to plate natural modes with both or one even mode orders. As the frequency rises above the fundamental resonance frequency of the plate, the spectrum of the mean radiated sound power tends to fall according to the mass law with a slope of 6 dB/octave. When the frequency reaches the critical frequency at about 7.54 kHz (highlighted by the thick-dashed vertical line), the spectrum shows a wide band ridge, which is less marked than that visible in plot (b) for the 45o acoustic plane wave excitation (thick-solid line) but is much more noticeable than that found in plot (c) for the kinetic energy due to the diffuse acoustic field excitation. This phenomenon is due to the fact that, on one hand, the diffuse acoustic field distributes the energy to plane waves with all angles of incidence and thus distributes the excitation coincidence effect over all frequencies above the critical frequency and, on the other hand, the sound radiation becomes very effective around the critical frequency.

APW excitation

The effects produced by the acoustic plane wave excitations are considered first. The three lines in plots (a) and (b) of Figure 11 show the spectra of the time – averaged total kinetic energy and total radiated sound power by the panel due to acoustic plane waves at grazing, 45o and normal angles of incidence as depicted in Figure 9a. Considering first the kinetic energy plot (a), the three lines show that, at low frequency the spectra are characterised by sharp and well separated peaks due to the natural modes of the panel. The spectrum for the acoustic plane wave excitation with normal angle of incidence (dotted line) is characterised by fewer resonance peaks, as this type of wave excites only the modes with a net non-zero volumetric displacement, that is modes with both odd mode orders. At frequencies above the first resonance frequency of the panel, the mean kinetic energy spectra tend to fall with a typical 6 dB/octave slope, i. e. the so called “mass law”, which is due to the mass effect of the panel. As the frequency rises, the resonance peaks in the kinetic energy spectra progressively overlap so that the spectra show wide rounded crests spaced out by wide troughs, which are due to the clustering of many resonance peaks at given frequency bands. This effect is specific to the structure at hand and is quantified by the “modal overlap” factor

(a) APW

Подпись: Frequency [Hz] (e) ROR 20 Frequency [Hz]
APW excitation

(c)ADF

-40

-60

-80

00

0

10

Frequency [Hz]

0

Figure 11. Spectra of the total kinetic energy (left-hand side plots) and total radiated sound power (right-hand side plots) per unit exciation due to (a, b) APWat grazing (dashed line) 45o (thick-solid line) and normal (faint-solid line) angles of incidence; (c, d) ADF; (e, f) ROR and (g, h) TBL pressure fields.

(Cremer et al. 1988), which gives the number of structural modes of the structure significantly excited at any one excitation frequency. For instance, the modal overlap for thin rectangular plates increases linearly with frequency and is given by

Подпись:Подпись: (80)m

p

V Bp J

where np(fi) is the plate “modal density”. For the plate considered in this section

the modal overlap reaches the threshold value of 1 at about 3.6 kHz. Starting from this frequency, the response of the panel at each frequency is characterised by the overlap of two or more resonant responses. For frequencies above 5 kHz, the kinetic energy spectra produced by the grazing (dashed line) and 45o (thick – solid line) acoustic plane waves show distinct wide frequency band ridges, which are characterised by multiple resonance peaks. These phenomena are generated by the so called “coincidence effect” where the projection of the acoustic wavelength into the plane of the panel equals the frequency-dependent bending wavelength, i. e. 4/sin0 = Xb, and thus the waved pressure field produced on the plate by the incident acoustic plane wave couples effectively with the structural wave motion (Fahy and Gardonio 2007). Consequently, for frequencies close to the “acoustic coincidence frequency” a>m, such that 4/sin0 = 4b, the response of

the panel increases and forms the wide frequency band crests with multiple resonance peaks that can be seen in the kinetic energy spectra produced by the grazing and 45o incident acoustic waves (dashed and thick-solid lines respectively). Since for acoustic waves 2x/k, with the wavenumber given by

k = , and since for thin plates Xb = 2njkb, with the wavenumber given by

APW excitation APW excitation Подпись: (81)

kb =^cb =^[a{rnpjBpthe acoustic coincidence frequency can be readily derived as follows:

where

( Y/2

Подпись: (82)Подпись: = cmP

v B? J is the so called “critical frequency”, which is highlighted with the thick-dashed vertical lines in the plots of Figure 11 and represents the smallest coincidence frequency that occurs for acoustic waves incident at grazing angle, that is 0=9C°. For the panel at hand, the critical frequency occurs at about 7.54 kHz. Eq. (81) indicates that the coincidence frequency tends to infinity as 0^0, thus as the acoustic wave approaches normal angle of incidence. Indeed the kinetic energy spectra produced by the normal acoustic plane wave excitation (faint-solid line) do not show the wide frequency band ridge found for the grazing and 45o excitations (dashed and thick-solid lines respectively). Normally, the coincidence phenomenon between flexural waves in the structure and acoustic waves in the

APW excitation

Figure 12. Dispersion curves relative to a) flexural waves in a thin plate (solid line), b) acoustic trace wave for grazing incidence (dashed line), c) acoustic trace wave for 45o incidence and d) convective flow (dash-dotted line).

fluid is analysed with reference to the dispersion curves for the two types of waves. For instance, Figure 12 shows that the dispersion curve for the trace of the acoustic wave at grazing angle with the panel (dashed line) intersects the dispersion curve for flexural wave propagating in the plate (solid line) exactly at the critical frequency, so that coco(0=90)=a)cr. Moreover, the dispersion curve for the trace of the acoustic wave at 45o with the panel (dotted line) intersects the dispersion curve for flexural wave propagation on the thin plate (solid line) at higher frequency than the critical frequency, that is rnco (0 = 45°) = 2a>cr. Moving

back to plot (a) of Figure 11, the dashed and thick-solid lines show that for very high frequencies above the coincidence region, the mean kinetic energy spectrum falls rapidly with a typical 18 dB/octave slope, i. e. following the so called “stiffness law”, which is due to the bending stiffness effect of the panel (Fahy and Gardonio 2007).

Considering now plot (b) in Figure 11, it is noted that the spectra of the radiated sound power by the panel due to acoustic plane waves at grazing, 45o and normal angles of incidence (dashed, thick-solid, faint-solid lines respectively) are similar to those found for the kinetic energy. However, at low frequencies where the spectra of the kinetic energy are characterised by well separated resonance peaks, the co-respective spectra of the radiated sound power are characterised by fewer resonance peaks. This is because, as discussed in Section 2.1, at low frequencies such that k/kb <1, the natural modes characterised by one or both even mode orders are poor sound radiators. As a result the resonant vibration responses due to those natural modes do not turn into a high sound radiation. For example the resonant responses due to the (1,2) and (2,1) natural modes of the panel produce the second and third sharp resonance peaks in the kinetic energy spectra and the comparatively much smaller second and third resonance peaks in the radiated sound power spectra. For frequencies above the first resonance frequency of the panel, the spectra of the mean radiated sound power tend to fall following the so called mass law, i. e. with a typical 6 dB/octave slope. As found for the kinetic energy spectra, at higher frequencies where the response of the panel at every frequency is characterised by the overlap of multiple modes the sound radiation spectra are characterised by increasingly smoother wide frequency band crests and troughs, which are generated by the resonant response of clusters of natural modes. When the frequency approaches the critical frequency at about 7.54 kHz (highlighted by the thick-dashed vertical line), in all three cases under consideration the sound radiation tends to rise. This is due to the fact that к/кь ~1 and thus, as can be noted in Figure 8a, all modes become efficient sound radiators. In particular, when the plate is excited by the plane wave at grazing angle (dashed line), this phenomenon is magnified by the concomitant efficient acoustic excitation effect described above. Thus, the coincidence ridge in the sound radiation spectrum becomes very high. Alternatively, when the plate is excited by the plane wave with a 45o angle of incidence, the spectrum is characterised by a small crest around the critical frequency, which is due to the efficient sound radiation of all modes, and then, at higher frequencies, by another comparatively bigger ridge, which is due to the efficient excitation of the waved pressure field generated on the panel by the acoustic plane wave. Finally, the radiated sound power spectrum of the plate excited by the plane wave with normal angle of incidence (faint-solid line) is characterised only by a small ridge around the critical frequency due to the efficient sound radiation of all modes.

Physics of TBL sound radiation by a baffled panel

In order to better understand the physics of the interior sound radiation generated by a TBL pressure field on the panel (Figure 9d), three typical sound radiation problems are considered first, which are due to the following excitation fields acting upon the panel: a) the fully correlated pressure field generated by a time – harmonic “acoustic plane wave” (APW) with grazing, 45o and normal angles of incidence (Figure 9a); b) the partially correlated pressure field generated by an “acoustic diffuse field” (ADF), which is composed by a random distribution of plane waves whose energies are equally divided over all angles of incidence (Figure 9b) and c) the fully uncorrelated pressure field due to the so called “rain on the roof’ (ROR) random excitation, which is characterised by a uniform distribution of point forces totally uncorrelated between each other (Figure 9c). The panel is assumed simply supported along the perimeter and its dimensions and material properties are summarised in Table 2.1. An extended version of this analysis can be found in (Rohlfing and Gardonio 2009).

The panel response and the sound radiation produced by the ADF, ROR and TBL excitations are analysed in terms of the total kinetic energy PSD and total radiated sound power PSD, derived with the formulation presented in the

(a) acoustic plane waves (b) acoustic diffuse field (c) rain on the roof

Physics of TBL sound radiation by a baffled panel

(d) TBL excitation

Physics of TBL sound radiation by a baffled panel

Figure 9. Sound radiation induced by: a) APW at grazing, normal and 45′
incidence angles, b) ADF, c) ROR and d) TBL.

Parameter

Value

dimensions

lxp y-lyp = 278k247 mm

thickness

hp =1.6 mm

mass density

Pp = 2720 Kg/m3

Young’s modulus

Ep = 7×10і0 N/m2

Poisson ratio

Vp = 0.33

Structural loss factor

r/~ 0.02

Table 2.1. Geometry and physical parameters for the panel.

previous section. For the fully correlated time-harmonic plane wave acoustic excitations, the panel response and sound radiation are instead investigated with reference to the spectra of the time-averaged total kinetic energy Ek (®) and

Physics of TBL sound radiation by a baffled panel

time-averaged total radiated sound power Pr (®). These two frequency-

Pr(®) = — f Refit(xs,®)*p(xs,®)ldSb =®2b (a)HA(®)b (a) , (72)

2 JSb

where the vector br(o) is derived from Eq. (70). The pressure field over the surface of the panel produced by an acoustic wave with azimuthal and elevation (with reference to the normal of the plate) angles, ф and в respectively, can be expressed as:

PApw&, t) = RejpAPwH ei(0t-W) } , (73)

where pAPW(й) is the complex amplitude of the incident wave and kx = k sin(<9)cos(0), ky = k sin(#)sin(^) are the wave number components in x and y

directions. Thus, the incident acoustic plane wave produces a waved pressure field on the panel whose wavelength is given by ^sin0. For instance, as schematically depicted in Figure 5a, for grazing angle of incidence such that
в=9C°, the waved pressure field acting on the panel is characterised by the same wavelength as that of the incident acoustic field. When the angle of incidence turns to в = 45°, the wavelength of the pressure field acting on the panel becomes V2 times longer than that of the incident acoustic wave. Finally, if the angle of incidence is further reduced towards 6=0° the projection of the acoustic wavelength into the plane of the plate tends to infinity and thus the pressure field is no more waved and becomes spatially uniform. Moving back to the formulation for the response and sound radiation of the plate, considering the excitation pressure field given in Eq. (73), the modal excitation terms frm in Eq.

(68) result (Wang et al. 1991):

Подпись: (74)(®) = (x У) Cj( = 4 pAPW(m) lxpln

Physics of TBL sound radiation by a baffled panel Physics of TBL sound radiation by a baffled panel Подпись: (75a,b)

where, if ”л^ + sinffcosifi(aixplc°) and ”л^+sindsi^^^jc,),

Подпись: I”i = JSgn(sm6>cos,zi) Подпись: Im = . Подпись: (76a,b)

and, if ”л = + sin^cos^M^/c,) and т2л = + sin0sin^(ftlyp/c°),

The response and sound radiation produced by the other three types of excitations are instead analysed in terms of the total kinetic energy PSD and total radiated sound power PSD derived with the formulations presented in Sections

1.6 and 2 respectively. Thus the excitations are expressed in terms of cross spectral density functions. The cross spectral density for the diffuse sound field excitation is assumed

c / > , s / sin kd

SADF (x s, Xs,®) = SADF (») ^ (77)

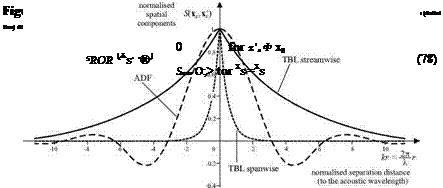
where in this case d =|xs – Xs | is the distance between the two points x s and x’s and SADF(m) is the PSD of the ADF excitation at any point on the panel. Thus the ADF cross spectral density function is the same in all directions and is characterised by the so called “sinc” function which is shown by the dashed line in Figure 1C. For the fully uncorrelated rain on the roof excitation, the cross spectral density is assumed as
where, in this case, SROR(a) is the PSD of the ROR excitation at any point on the panel. Thus the cross spectral density is characterised by a delta function. As discussed in Chapter 6, the cross spectral density for TBL excitation is derived from the Corcos model, so that (Corcos 1963a; Corcos 1963b; Corcos 1967)

Подпись: (79)

Physics of TBL sound radiation by a baffled panel

STBL (xs, x’s M = Stbl OK1

where Stbl(o>) is the PSD of the TBL excitation at any point on the panel, rx and ry are the x and y components of the distance between points xs and x! s, Lx = aJJjсо and Ly =ayUcjсо are the correlation lengths in x and y directions and Uc is the convective velocity, which is normally derived from the relation Uc – KUm, with 0.6 <K<0.85 (Cousin 1999). In this study, the convective velocity is assumed to be Uc – 0.6U„, where the free flow velocity is taken as U„= 225m^s. Also, as indicated in references (Maury et al. 2004; Elliott et al. 2005), the empirical parameters ax and ay are assumed to be 1.2 and 8
respectively. According to Eq. (79), the TBL cross spectral density function varies with direction and is characterised by two exponentially decaying functions in the stream-wise and span-wise flow directions. In the stream-wise direction, the convective effect also produces a waved profile of the cross spectral density function. The solid and dotted lines in Figure 10 show that the span-wise component decays more rapidly than that in the stream-wise direction. This is due to the fact that the correlated pressure field produced by each vortex in the turbulent fluid flow is smeared in the direction of the flow by the motion of the fluid.

The comparative analysis of the structural response and sound radiation produced by these four types of excitations will be carried out considering the spectra of the time-averaged total kinetic energy and of the time-averaged total radiated sound power produced by the APW excitations with unit amplitude, i. e. PAPW(a) = 1. Also the spectra of the total kinetic energy PSD and total radiated sound power PSD produced by the ADF, ROR and TBL excitations will be considered assuming they have unit PSD, i. e. SADf(a) = SRR(a) = STB1(a) = 1. In this way the specific characteristics of the structural response and sound radiation produced by the TBL pressure field are contrasted with those of the other three excitations independently from the specific energy distribution in frequency of each type of excitation.

Interior noise radiation and vibration of the shell structure

To effectively establish the interior sound radiation and global flexural response of the enclosing flexible wall, it is convenient to express the two phenomena in terms of energy functions, which embrace in a single term the spatially distributed characteristics of the sound and flexural vibration fields. Moreover, the stochastic nature of the disturbance pressure field exerted by the TBL fluid flow necessarily leads to the expression of these energy functions in terms of concepts and formulations for random processes. Thus a particular formulation is presented below, which refers to a similar study proposed by (Gardonio et al. 2012) and considers the formulation for stationary stochastic processes given in (Bendat and Piersol 2000).

The overall sound radiation to the interior of a cavity can be established in terms of the time-averaged total acoustic potential energy Ep, which can be expressed as follows (Nelson and Elliott 1992):

Interior noise radiation and vibration of the shell structure

where the instantaneous total acoustic potential energy is given by Ep(t) =tjt I p(xc, t)2dV. For stationary and ergodic processes, such as the

•R 2pG0 *V

interior sound radiation induced by the pressure field due to a fully developed TBL, this quantity can be derived in terms of a “Power Spectral Density” (PSD) function of the total acoustic potential energy [27]Ep(<$

— 1

Ep = —J SEp (®)d® . (44)

In

Interior noise radiation and vibration of the shell structure Подпись: (45)

Normally, in acoustics, rather than considering the averaged function, the corresponding frequency spectrum is studied, which can be plotted graphically and provides a deeper insight on the physics of the sound radiation phenomenon under study. According to (Bendat and Piersol 2000), the PSD of the total potential energy SEp(m) can be derived starting from the following expression:

-®2 + j2^a,„®a,„®)

Interior noise radiation and vibration of the shell structure Подпись: ¥an(x c ) Interior noise radiation and vibration of the shell structure

where the superscript * indicates the complex conjugate, E[…] denotes the expectation operator. The interior pressure can be derived from Eq. (19) with vn (xs) = w(xs), where Gc (xc | xs) is given by Eq. (22) and w(xs) is derived from Eq. (26), so that

Подпись: Q(ffl)Y(ffl)Spp (©)¥ H (ffl)Q H (©) Подпись: (48)
Interior noise radiation and vibration of the shell structure

Thus, after some mathematical manipulations, the PSD of the total acoustic potential energy can be expressed with the following matrix relation

Here Y = [- o2M + ja>Z + k]-1 is the structural modal admittance matrix that can be derived from Eq. (42). Also, Q is the acoustic modal impedance matrix whose elements are given by

Interior noise radiation and vibration of the shell structure Interior noise radiation and vibration of the shell structure

Finally, the elements of the Spp(«) matrix with the modal excitations PSDs are given by

where STBL(xs, xS,«) is the spatial cross spectral density of the TBL blocked pressure field between points xs -(x, y) and x’s -(x, y):

STBL (xs, xS,®) = limE[1 P*(xs,®)P(xS,®)] . (51)

T T

Chapter 6 of this book presents an overview of the models and formulations for the spectral density of the pressure field produced by a TBL fluid flow on a rigid wall. Additional review material can be found in references (Blake 1986; Leehey 1988; Bull 1995; Graham 1997; Howe 1998; Cousin 1999; Maury et al. 2002b; Hwang et al. 2009).

The analysis of the sound radiation to the interior is often contrasted with the flexural response of the shell enclosure, which can also be represented in terms of a single function. In fact, the overall flexural vibration of the shell can be

established in terms of the time-averaged total flexural kinetic energy Ek, which can be expressed as follows:

Ek = hm — j 7 jS Pshw(x,,t) dSb dt, (52)

T – T/ 2 b

where the instantaneous total flexural kinetic energy is given by Ek (t) = -1 f pshxv(xs, t)2 dSb. As seen with the interior sound radiation, for

JSb

stationary and ergodic processes this quantity can be derived in terms of the PSD functions of the total kinetic energy SEk(a):

— 1 г+»

Ek = 2^1-»SEk (m)dm ’ (53)

where

Interior noise radiation and vibration of the shell structure
Подпись: (54)

Also, in this case, the orthonormality property of the structural natural modes leads to the following simple matrix expression

Seu = 2 M®[28]Tr [Sbb (®)], (55)

Interior noise radiation and vibration of the shell structure Подпись: Y(ffl)Spp (©)¥ H (©) Подпись: (56)

where the matrix Sbb (®) with the self and mutual PSDs of the structural modal responses is given by:

As discussed at the beginning of this section, the space-frequency domains formulation presented above can also be developed in the wavenumber- frequency domain. For instance, as discussed in Chapter 6, the spatial cross spectral density of the excitation field can be expressed in terms of the wavenumber spectral density function STBL (k,®) by means of inverse space – Fourier transform such that:

і +Х4-»

STBL Os > XS >0 і і STBL (КФМХ-ХУ2k, (57)

(20

where the vector k contains the wavenumber components in the stream-wise and cross-wise directions of the fluid flow. Substitution of this expression into Eq. (50) leads to the following expression for the elements of the matrix with the modal excitations PSDs

Spp,™(ffl) = JS jS, C(xs) 77Stbl(k, ffl)Ck(x-x,)d2k £(*’,)dSbdS’b

Подпись: (58)2Я)

1 +да +да

І R“(k)Stbl(k, ffl)^(k)*d2k

(2 я-)

where the shapefunctions </>“(to, m) are given by the space-Fourier transforms of the natural modes:

CO) = lt C(xsVMdSb. (59)

Here the integration is restricted to the surface of the structure Sb since C(xs) = 0 for xs g Sb. Eq. (58) highlights how the wavenumber approach leads
to a formulation where the frequency-dependent modal excitation produced by the TBL fluid flow, Spp(m), is given by the unbounded integral in the

wavenumber domain of the product of the wavenumber spectral density function for the excitation field STBL (k, a) and the wavenumber spectrum of the natural

modes C(k,®), ie. the shape functions. Thus it can be interpreted as the result of a filtering effect between the wavenumber spectrum of the excitation field and the wavenumber spectrum of the natural modes.

The spatial Fourier transform approach can be extended also to the early part of the formulation presented above for the derivation of the total potential energy PSD, SEp(m), and total kinetic energy PSD SEk(®). In this case, as shown by

Mazzoni (2003) and Maury et al. (2002a), the PSD functions are derived from the wavenumber integrals of the products of wavenumber spectra for the TBL excitation, the modal shapes and the structural-acoustic modal response functions. With this “full wavenumber” approach, the structural response and interior sound radiation are thus derived as the product of wavenumber spectra for the excitation, modal couplings and structural and acoustic responses, each producing a specific filtering effect. This appears to be a very interesting and appealing approach for studying the response of a system, although some practice is required to produce accurate analyses. 2

Figure 7. Model problem composed of a baffled flexible panel, which is excited
by a TBL pressure field on the outer side and radiates sound on the inner side.

Подпись:— 1 +7 2

Pr = I is ^ ’t)P(Xs ’t)dSb dt

T I sb

-Tf 2 b

Here the spatial integral is for the instantaneous total radiated sound power
Pr(t) = f w(xs, t)p(xs, t)dSb (Fahy and Gardonio 2007). As discussed in the previous

Sb

section, assuming the process is stationary and ergodic, this quantity can be derived with the following relation:

1 г+»

Pr = f Spr(®)d® , (61)

In’1

Interior noise radiation and vibration of the shell structure Подпись: (62)

where the PSD function of the total radiated sound power SPr(a) is given by (Gardonio et al. 2012):

The complex velocity w(xs, a) can be derived from the modal expansion of the transverse displacement, which is given by Eq. (25c). Also, as discussed in

Подпись: p(xs) Interior noise radiation and vibration of the shell structure Подпись: (63)

Section 1.2, the sound pressure over the surface of the panel can be derived from the Rayleigh integral given in Eq. (12) assuming[29] vn (xs) = – W(x s), so that

Substituting this equation into Eq. (62) and considering the modal expansion for the panel velocity derived from Eq. (25c), after some mathematical manipulations, the following expression is derived for the radiated sound power PSD

Подпись: (64)S Pr = 2 ®2Tr [A(®)Sbb (»)]

where a(®) is the power transfer matrix that defines the sound power radiated by single modes (diagonal terms) and pairs of modes (off diagonal terms). For a flat rectangular panel the power transfer matrix is given by (Fahy and Gardonio 2007)

Подпись: (65)A(да) = t4s (xs)кгт-фr(xs )dSbdS’b

4 л Jsb Jsb kd

Interior noise radiation and vibration of the shell structure Подпись: = Y (®)Spp (0)Y H (0) Подпись: (66)

where d =|xs – Xs | is the distance between point xs and point x’s. Also, the matrix Sbb(0) with the self and mutual PSDs of the modal responses is given by

where the structural modal admittance matrix Y is obtained from the modal equations of motion of the plate structure. More specifically, as seen for the cylinder structure, the unknown complex modal amplitudes br, m are derived by

substituting Eq. (25c) into Eq. (24c) with the differential operator L3 (…) for flexural vibration of thin flat plates (Graff 1975; Cremer et al. 1988; Reddy 2006). The resulting equation is then multiplied by a m – th mode and integrated over the surface of the plate so that, using the orthonormality property of the natural modes and assuming hysteretic structural damping, the following set of uncoupled ordinary equations is obtained:

Mp (<m (1 + jtf) – Km = fr, m, (67)

where M p is the mass of the panel and fr, m is the да-th modal excitation term, which is given by

fr. m =Sbfr O’sM-m 0’s)dSs • (68)

Подпись: s,m Подпись: (69a,b)

For a flat rectangular thin panel, the natural frequencies and natural modes are given by:

where mp =Pphp, Mp =PphplXplyp and Bp = ЕркЦ[l2(l-vj;)], assuming Pp, Ep

and vp are respectively the density, Young’s modulus of elasticity and Poisson’s

ratio for the material of the plate. Finally, m1, m2 are the indices in the x and y directions for the m-th mode. As seen in Section 1.5, the set of Eqs. (67), can be casted in the following matrix expression

[-®2M+K(1 + ]фьг = f, (70)

where the diagonal elements of the mass and stiffness matrices are given by Mmm = Mp and Kmm = Mpa]m respectively and the elements in the modal response and excitation vectors are given by brm = brm and frm = frm respectively. Thus, the structural modal admittance matrix is given by Y = [-®2M + K(1 + jq)Y. In summary, for the simplified model problem considered in this section, the flexural response and interior sound radiation are studied using Eqs. (55) and (64) respectively. The modal amplitudes are derived by substituting Eq. (25c) into Eq. (24c), which, for a flat plate structure, is uncoupled from Eqs. (24a, b) for the in-plane vibration (Soedel 1993). According to Eq. (55) the spatially averaged response of the structure depends on the squared modal responses, which, in turn, depend on the coupling between the distributed excitation field and the natural modes. As illustrated in more detail in the following subsection, the TBL pressure field efficiently couples with all modes. In contrast, for example, a plane acoustic wave incident at a given angle with the normal axis to the plate, tends to couple efficiently with the so called volumetric modes which are characterised by a non-zero spatially averaged displacement and thus have both mode orders odd. Eq. (64) shows that the radiated sound power PSD depends on the squared modal amplitudes weighted by the diagonal terms of the matrix a (®) and on the products of pairs of modal amplitudes weighted by the appropriate off-diagonal terms of the matrix a(®).
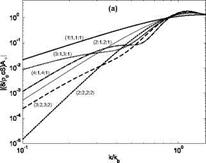
Interior noise radiation and vibration of the shell structure Interior noise radiation and vibration of the shell structure

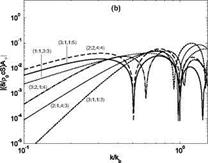
Figure 8. Self (a) and mutual (b) radiation efficiencies of the rectangular panel

natural modes.

In other words, sound radiation occurs both via self radiation effects of each mode and the cross radiation effects of pairs of modes. Figure 8 shows both the diagonal (plot a) and off-diagonal (plot b) elements of the matrix a (®) for the panel considered in the next subsection with reference to the ratio between the acoustic and flexural wave numbers k/kb. Plot (a) indicates that, at low frequencies such that k<kb (i. e. for subsonic flexural waves such that cb <c, where cb =4a>(Bp/mp )^4), the self radiation effect of each mode is rather weak and

tends to increase with frequency until it reaches the maximum value around k/kb =1 (i. e. for sonic flexural waves with cb = c). Volumetric modes

characterised by both odd mode orders tend to radiate sound more efficiently than other modes. Also, the radiation efficiency tends to decrease as the mode orders raise. For frequencies such that k >kb (i. e. for supersonic flexural waves with cb > c) all modes become efficient radiators of sound. Plot (b) shows that the mutual radiation effects are comparatively smaller than the self radiation effects, particularly at higher frequencies such that k > 0.5kb. Also, the curves in

the graph are characterised by sharp dips around certain values of the ratio k/kb, which are due to the fact that the off diagonal terms in matrix a (®) alternate between positive and negative values and thus their moduli go to zero at certain values of the ratio k/kb (Fahy and Gardonio 2007). This interesting finding

indicates that for certain frequency bands, the mutual sound radiation effect of pairs of modes may be either positive or negative; in other words it may enhance or reduce the total sound radiation. Therefore, reducing the response due to some
specific modes could lead to reductions of sound radiation at given frequency bands, but to the enhancement of sound radiation at other frequency bands (Fuller et al. 1996).

Derivation of the coupled structural-acoustic response

In general, for the structural-acoustic problem at hand, the shell structure is excited only by transverse force distributions. For instance, for the cylindrical wall of the model problem shown in Figure 1, the excitation vector is characterised only by forces in radial direction. More specifically, the transverse force excitation per unit surface fr (x’s) is composed by three terms: the pressure

field prai(x’s, t) produced by the TBL fluid flow and the fluid loading pressure fields pe (xs, t), pc (xs, t) exerted by the external and internal fluids.

As discussed in the opening part of this section, the pressure field produced by the TBL fluid flow is assumed independent from the flexural vibration of the cylindrical shell. In this case the excitation is specified in terms of the blocked pressure. Comprehensive overviews of the models for the excitation spectra that have been proposed since the early work by Corcos (1963a); (Corcos 1963b) can be found in Bull (1995); Graham (1997) and in Chapter 6 of this book. In this respect, it is important to emphasize that, despite the growing evidence that the model proposed by Corcos (Corcos 1963a; Corcos 1963b; Corcos 1967) over predicts the excitation levels at wavenumbers below the convective coincidence range (Martin and Leehey 1977; Blake 1986; Leehey 1988), it is still widely used to predict the response and interior sound radiation in high speed transportation vehicles such as aircraft. This is because, for high flow speeds, the convective coincidence range tends to coincide with the wavenumbers of the low order natural modes of the shell structure controlling the response and interior sound radiation phenomena (Graham 1997; Cousin 1999; Maury et al. 2002b). Nevertheless it is important to highlight that situations exist where the contribution in the sub-convective wavenumber region may be significant (Hwang and Maidanik 1990; Graham 1997).

The external and internal fluid loadings are instead derived considering the feedback effects produced by the flexible wall sound radiation into the external and internal fluids. As anticipated at the beginning of this section, this is a reasonable model for the fluid loadings produced by the air in the interior and exterior of a vehicle that travels at low speed. For aircraft vehicles traveling at very high speed approaching 0.8 Mach at cruise condition, a proper aeroelastic formulation would be necessary to correctly predict the exterior fluid loading (Frampton 2005). Nonetheless, the structural-acoustic model presented here provides a good foundation for the understanding of the physical mechanisms characterising the coupling of structural modes via the internal and external fluids. In this respect, a complete set of graphs with the spectra of the self and mutual fluid loading impedance functions is introduced at the end of this subsection, which provide direct indications on the damping-, mass – and

Derivation of the coupled structural-acoustic response

stiffness-like physical effects produced between the modes of the shell via the fluid loading.

Derivation of the coupled structural-acoustic response Подпись: (33)

In summary, the excitation exerted by the TBL fluid flow on the wall structure is expressed in terms of the blocked TBL pressure pTBL (x’s), which is twice the pressure that a nominally identical flow would produce if the wall was removed (Howe 1998). Also, the exterior and interior sound pressure fields, pe(xs, t) and pc(xs, t), are derived from the first step “collocation analysis” of the boundary integral in Eq. (5). As discussed above, if there are no distributions of acoustic sources in the exterior and interior fluid domains, the boundary integral expression (5) reduces to Eq. (11) and Eq. (19) when both the exterior and interior sound fields are described with Neumann Green functions. For instance, assuming that the acoustic particle velocity on the boundary surface of the model problem shown in Figure 1 coincides with the radial velocity of the cylinder, i. e. Vn (xs)=w(xs), the radial force per unit surface is given by4

Since the natural modes used to derive the structural response are characterised by the symmetric and anti-symmetric functions given in Eqs. (28a, b), the modal excitation terms defined in Eq. (30) are expressed as follows

Подпись:f“m = Фг, т (X’s)PTBL (x’s )dSb “ 2,ь Фг, т j^PGe (< xs )w(xs )dS4dS4

– 2£ Фг, т j®fGc (x’s Xs )W(Xs )dSbdSb

Подпись: fC = fC,m - j'CE C Подпись: — JVЇ X"1 7 a ha 1 / , c,mmbr,m Подпись: (35)

Here, the two Green functions Ge and Gc are given by Eqs. (13) and (22) respectively. Thus, considering the orthonormal properties of the trigonometric functions that describe the structural and acoustic mode shapes and the Green functions for the external fluid domain, simplified analytical expressions can be derived for the three integrals in the equation above. In particular, the first integral is expressed in terms of TBL modal excitations while, considering the modal expansion for the radial displacement given by Eq. (26), the other two integrals are expressed in the form of modal impedances. Thus it follows that:

Подпись: /’a TBL,m Подпись: £ Фіт ЮPTBL(XS)dSb Подпись: (36)

Here the TBL modal excitations are given by

Подпись: Z “ - e,mm Подпись: 4Sb nLem Derivation of the coupled structural-acoustic response Подпись: (37)

Also, the modal impedance terms due to the interaction between the modal vibration of the cylinder wall and exterior fluid are given by (Junger and Feit 1986; Lesueur 1988)

where Nmhml(kz)=icos2(jkr) when m and m are odd while Nm,,mi(kz)=-2sin2(k|L-) when m1 and m1 are even. In addition km = , k – = and є-2=0 = 1,

Подпись: Z-2 (kz) = jPc0 jp: Подпись: k H{»[(k2 - k2)1/2 R] -kl)ltlHmiVkk -k2J12R] Подпись: (38)

emi>0 = 2 is the Neumann factor. Finally (Junger and Feit 1986; Lesueur 1988)

is an impedance function per unit surface, where, as introduced in Section 1.2, k2 = k2 + k2 and H(m)(…) is the first kind Hankel function of order m,. Since the flexural natural modes of the cylinder are orthogonal to each other, no coupling exists, i. e. Z“mm = 0 , when m + m is odd or when m2 Ф m2. Finally, the modal

Derivation of the coupled structural-acoustic response Derivation of the coupled structural-acoustic response Подпись: (39)

impedance terms due to the interaction between the cylinder wall and interior fluid are given by

Derivation of the coupled structural-acoustic response Подпись: І ФІ-(xs)Wa„(xs)dSb Подпись: Sb m1 [( i)(n,2 +—I ) a 2 2 ^2 Sn2n n -m Подпись: 1]'Jn2 (K ,n3 ) Подпись: (40)

where the mode coupling terms are given by (Gardonio et al. 2001)

with esni = 1 when n2 = 0 and єsr2 = 2 when n2 ф 0 and with earh= 2 for all n2. Also in this case, the orthonormal properties of the trigonometric functions in the natural modes leads to no coupling, i. e. Zacmm = 0, between modes with m — n1,n + 2, n + 4, … or m — n1,n + 2, n + 4, … and m2 Фn2 or m2 Фn2.

Substitution of Eq. (35) into Eq. (29) gives the following set of coupled modal equations

-®2)k_ = fraEL, m – jv t – jv tКЖт

Подпись: (41)m=1 m=1

a=s, a a=s, a

m = 1, 2, …. x a = s, a

To simplify the remaining part of the formulation, these equations are arranged in the following matrix expression

[- ®2M + jdL + K]br = frBL , (42)

where the elements of the diagonal mass and stiffness matrices are given by M = M and K“ = Matm respectively. Also, the elements of the modal

excitation and modal response vectors are given by f“BLm = fBBLm and b“m = barm respectively. Finally the complex terms in the sparse impedance matrix are given by Z“_ ^(z“mm + Z“mm).The diagonal self impedance terms provide the exterior and interior fluid loading effects on a given mode m = (m1, m2) exerted by the modal velocity of the same mode m = (m1, m2). Alternatively the off-diagonal mutual impedance terms (often called cross impedances) give the exterior and interior fluid loading effects on a given mode m = (m1, m2) generated by the modal velocity of another mode m – (m1,m2).

Before continuing with the final part of this formulation for the interior sound radiation, the physical effects due to the fluid loadings produced by the external and internal air fluids are studied in detail for a cylindrical enclosure with aspect ratio RL=03. To facilitate the analysis, the spectra with the real and imaginary parts of the self and mutual impedances given in Eqs. (37) and (39) are presented. The fluid loading effects are then analysed recalling that a) a real positive impedance indicates a damping-like effect, i. e. Zdamping = c; b) an

imaginary positive impedance proportional to frequency denotes a mass-like effect, i. e. Zmass – jam; and c) a imaginary negative impedance inversely proportional to frequency indicates a stiffness-like effect, i. e. Zstifjness = – jk/ m (here c, m, k, represent the damping, mass and stiffness factors respectively). Figure 3 shows the spectra of the real (left-hand side plots) and imaginary (right-hand side plots) parts of normalised self modal impedances of a cylinder immerged in air. The three rows of graphs show the self modal impedances with circumferential mode numbers m2 = 0, 1, 2 . The left-hand side plots shows that

the spectra of the real parts are always positive. This indicates that the fluid produces a resistive effect on each mode, thus it absorbs energy from the modal vibrations of the cylinder. In general, at low frequencies, all spectra set off from

Derivation of the coupled structural-acoustic response

Derivation of the coupled structural-acoustic response

4,1:4,15,1:5,1 6,1:6,1


0

Derivation of the coupled structural-acoustic response

Figure 3. Self external fluid loading impedances on a baffled cylinder with R/L=0.3.


Re{zJ (pcA)}


Im{zJ fccAd}


Derivation of the coupled structural-acoustic response

1,0:5,0


Derivation of the coupled structural-acoustic response

Figure 4. Mutual external fluid loading impedances on a baffled cylinder with R/L=0.3.


Derivation of the coupled structural-acoustic responseDerivation of the coupled structural-acoustic responseDerivation of the coupled structural-acoustic responseDerivation of the coupled structural-acoustic responseDerivation of the coupled structural-acoustic response

very small values close to zero and then rapidly rise up to a maximum value in correspondence of specific critical frequencies <z>cnmm. Above these critical

frequencies, the resistive effects rapidly fall and then level to constant values of 0.5 for the breathing modes with m2 = 0 and 0.25 for the other modes with m2 > 0 . Thus, in general, the self modal loading exerted by the external fluid

produces large resistive effects at high frequencies starting from about the modal critical frequencies where the resistive effect is maximum. Also, the resistive effects produced by breathing modes are double than those of modes with higher circumferential mode orders. Finally the critical frequencies rise together with the axial mode orders m1 = m1. Moving to the right-hand side plots, it is noted that also the spectra for the imaginary parts are always positive, which indicates that the fluid also produces a mass effect on each mode. In general, all spectra grow rapidly from zero and reach a maximum value at frequencies slightly lower than the modal critical frequency &>cr, mm. Then, for higher frequencies, they

rapidly fall to zero. Thus, in general, the self modal loading exerted by the external fluid produces mass effects up to the critical frequencies. Also, the peak mass effects produced by breathing modes are double than those of modes with higher circumferential mode orders.

Figure 4 shows the spectra of the real part (left-hand side plots) and imaginary part (right-hand side plots) of normalised mutual modal impedances with circumferential mode numbers m2 = 0, 1, 2 . The two columns of graphs show

that in this case the real and the imaginary parts assume both positive and negative values. This indicates that the fluid tends to transfer energy between pairs of modes. In general, the spectra for both the real and imaginary parts start from zero and then depict a waved contour that peaks at frequencies below the upper critical frequency of the two modes and then rapidly fade to zero. Thus, in general, the mutual fluid loading effect transfers energy from one mode to another around the upper critical frequencies o)crmm of the two modes. Plots in Figure 4 highlight that this effect is larger for breeding modes with m2 = 0 and

progressively becomes smaller as the circumferential mode order grows. In general, as can be noted by contrasting the graphs in Figures 3 and 4, for light fluids the energy transfer between pairs of modes is much smaller than the energy absorption exerted on single modes (Guyader and Laulagnet 1994). For this reason, the effect of the mutual impedances is often neglected for light fluids, such as air for example, so that the set of equations (41) becomes uncoupled. To conclude this analysis, it is important to note that, according to Eq. (37) and (38), the modal impedance terms relative to the external fluid loading are proportional to the specific acoustic impedance of the fluid pc0.

Re{zJ (pcA)}


4

2

0

-2


1,0:1,0


0.2

0.1

0


-0.1


Figure 5. Self internal fluid loading impedances for a cylinder with R/L=0.3.

Derivation of the coupled structural-acoustic response


Im{ZjJ (Р0Л)}


2,0:4,02,0:6,0

,0:3,0 1,0:5,0


2,0:8,0 x1,0:7,0

Derivation of the coupled structural-acoustic response


0


10 kL 20


30


Figure 6. Mutual internal fluid loading impedances for a cylinder with R/L=0.3.


Derivation of the coupled structural-acoustic responseDerivation of the coupled structural-acoustic responseDerivation of the coupled structural-acoustic responseDerivation of the coupled structural-acoustic responseDerivation of the coupled structural-acoustic responseDerivation of the coupled structural-acoustic response

Thus the energy absorption and transfer effects, as well as the mass effects described above, become increasingly important for heavy fluids (e. g. water). Normally, for light fluids, such as air, the mutual fluid loading effects and the self mass fluid loading effects are neglected. Also, the self resistive effects are described in terms of a viscous damping ratio, which is often considered constant and equal for all modes, although it should follow the typical spectra shown in the left-hand side plots of Figure 3.

The modal impedance effects produced by the interior fluid is now analysed assuming the cylinder is filled with air and has aspect ratio RL=03. Figure 5

shows the spectra of the real (left-hand side plots) and imaginary (right-hand side plots) parts of the normalised self modal impedances with circumferential mode numbers m2 = 0, 1, 2 . The left-hand side plots show that the spectra of the real parts are positive and are characterised by peaks occurring at the resonance frequencies relative to acoustic modes that are efficiently coupled with the structural mode that specifies the modal impedance term. The right-hand side plots show that the spectra of the imaginary parts jump from positive to negative values in correspondence of these resonances. Thus, the interior fluid produces a combination of stiffness, dissipative and mass effects on single structural modes, which is typical of enclosed sound fields with resonant behaviour (Kinsler et al. 2000). More specifically the stiffness effect is produced at frequencies below resonance while the mass effect is generated at frequencies above resonance. Also, the dissipative effect becomes significant at frequencies around resonance. On average, the magnitude of the impedances for breathing modes with circumferential mode order m2 = 0 is one order of magnitude greater than that of modes with higher circumferential mode orders. Also, for a given circumferential mode order, the magnitude of the resonance peaks tends to decrease as the axial mode number m1 rises. Finally, the modal impedances of breathing modes are characterised by a low frequency stiffness behaviour, which is due to the elastic reaction offered by the fluid in the cavity to the volumetric modal vibration.

Figure 6 shows the real part (left-hand side plots) and the imaginary part (right-hand side plots) of the normalised mutual modal impedances with circumferential mode numbers m2 = 0, 1, 2 . The left-hand side plots show that the

spectra for the real parts of the mutual modal impedances are also characterised by peaks occurring at the resonance frequencies due to the acoustic modes that are efficiently coupled with the structural mode that specifies the modal impedances. However, in this case, the peaks assume either positive or negative values. As found for the self impedances, the right-hand side plots show that the spectra for the imaginary parts are characterised by a discontinuity in correspondence of the resonance frequencies where the co-respective real part

peaks. However, in this case the jumps can be either from negative to positive values or from positive to negative values. Thus, the interior fluid produces a combination of stiffness, dissipative and mass effects also between pairs of structural modes, although the order of the stiffness and mass effects is inverted for certain pairs of structural modes. This phenomenon is indicative of an energy transfer between pairs of modes. Similarly to the self impedance functions shown in Figure 5, the average magnitude of the impedances for breathing modes with circumferential mode order m2 = 0 is much larger than that of modes with higher circumferential mode orders. Also, for a given circumferential mode order, the average magnitude tends to decrease as the axial mode number m1 rises. Finally, as seen for the modal impedances produced by the external fluid, Eqs. (39) and (40) indicate that the modal impedance is proportional to the specific acoustic impedance of the fluid pc0. Thus the energy absorption and transfer effects as well as the mass effects become increasingly important for heavy fluids, e. g. water. In general, for light fluids such as air, the mutual fluid loading is neglected and the self fluid loading is assumed purely dissipative. In this way, as seen for the modal impedances exerted by the exterior fluid, the self dissipative effects are described in terms of a viscous damping ratio, which is often considered constant and equal for all modes, although it should comply with the typical spectra shown in the left-hand side plots of Figure 5.