Category Pressure and Temperature Sensitive Paints

Impinging Jets

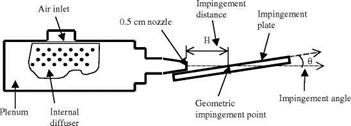
Using PSP and TSP complemented with Schlieren flow visualization, Crafton et al. (1999) studied subsonic jets and sonic under-expanded jets impinging on a flat plate at an oblique incidence angle from a converging nozzle. Results were obtained on two geometric configurations at the impingement angles of 10o and 20o and the impingement distances of 3.8 and 4.5 diameters of the jet, respectively. The jet velocity was varied from Mach 0.3 to Mach 1.0. PSP was used to measure the pressure distributions, and TSP to measure the distributions of temperature and the heat transfer coefficient on the impingement surface. Figure 9.57 shows the jet and impingement plate configuration. The jet facility consisted of a 5-in diameter by 12-in long settling chamber with a 1.5-in radial inlet and a 5-mm diameter nozzle with a 15o convergence angle. The settling chamber was instrumented with a J-type thermocouple to monitor the total temperature of the jet; the total pressure was set using a regulator and monitored using a 0.2 psi resolution Heise pressure gauge. Compressed air was supplied to the nozzle from an air compressor system. The impingement plate was an 8-in high, 12-in long and 1.5-in thick aluminum plate. The normalized geometric impingement distance (H/D) and the impingement angle (0 were varied independently to produce multiple impingement configurations. The impingement angles of 20o and 10o were tested, where 90o corresponded to normal impingement. The geometric impingement distance (H) was four jet diameters. The coordinate system (S, Y) on the impingement plate was defined in such a way that the origin coincided with the geometric impingement point, the 5-coordinate was along the surface of the impingement plate in the mainstream direction, and the У-coordinate was along the surface of the impingement plate in the cross-mainstream direction.

Impinging Jets

Fig. 9.57. Schematic of an obliquely impinging jet test facility. From Crafton et al. (1999)

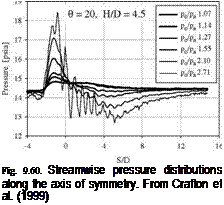
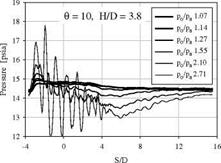
In experiments, Ru(dpp) in RTV was used as PSP and Ru(bpy) in model airplane dope was used as TSP. PSP and TSP, coated on the surface of the impingement plate, were excited to luminesce by a blue LED array at 460 nm. The luminescent emission, filtered using a long-pass optical filter (>570 nm) to eliminate the excitation light, was detected using a 16-bit Photometrics CCD camera. A ratio between the flow-on and flow-off reference images was converted to pressure or temperature using a priori calibration relations. The temperature distribution on the impingement surface in a sonic jet is shown in Fig. 9.58 for H/D = 3.8, в= 10o and p/pa = 2.7, where pa is the atmospheric pressure. The surface temperature varied by less than 0.5oC from the region outside of the influence of the jet to any location inside the region of jet impingement. This temperature difference would result in an error of about 0.1 psi in PSP measurements if the temperature effect of PSP was not corrected. Figure 9.59 shows the pressure distribution obtained using PSP at H/D = 3.8, в= 10o and p/pa = 2.7. The pressure pattern associated with shock cells in the sonic jet was clearly visualized. The pressure on the impingement plate varied by more than 8 psi, suggesting that the temperature-induced PSP measurement error was less than 3% of the full range of pressure. Figure 9.60 shows the streamwise pressure distributions for different total pressures (p/p) of the jet at the impingement angles of 10o and 20o. The subsonic pressure distributions showed a single pressure peak at the stagnation point. This peak pressure location changed with the impingement angle. The first pressure peak in the multi-peak pressure distributions of the sonic impinging jet coincided with the single peak in the subsonic pressure distributions. The first pressure peak corresponded to the stagnation point. In these cases, the first pressure peak location (the stagnation point) was always found somewhere upstream (toward the nozzle) of the geometric impingement point. In fact, the deviation of the stagnation point from the geometric impingement point is an intrinsic property of the non-orthogonal viscous stagnation flow (Dorrepaal 1986; Liu 1992). Theoretically, this deviation decreases to zero as the impingement angle approaches to 90o. Crafton et al.

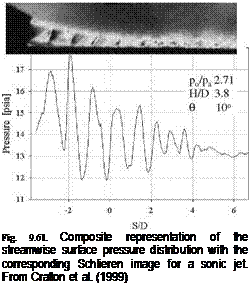
(1999) discussed a correlation of the peak pressure location with the geometric impingement point, which was related to the impingement distance H and the impingement angle в. An insight into the multi-peak pressure distribution was gained by Schlieren flow visualization. Figure 9.61 shows a composite representation of the streamwise pressure distribution and Schlieren image for the sonic jet impinging at 10o. The locations of the shock waves corresponded to the pressure peaks on the impingement surface.

Impinging Jets

Подпись: Fig. 9.60. Streamwise pressure distributions along the axis of symmetry. From Crafton et al. (1999)
Подпись: Fig. 9.61. Composite representation of the streamwise surface pressure distribution with the corresponding Schlieren image for a sonic jet. From Crafton et al. (1999)

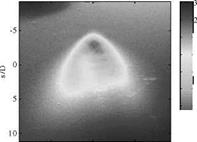
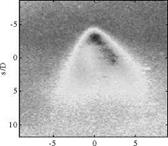
Using the same impinging jet facility running under different geometry and flow conditions, Guille (2000) conducted PSP and TSP measurements for a direct comparison of an intensity-based CCD camera system with a fluorescent lifetime imaging (FLIM) system developed by the Defense Evaluation and Research Agency (DERA) in Britain (Holmes 1998). The FLIM system consisted of an array of modulated LEDs, a phase-sensitive CCD camera, a modulation control box with an analog-to-digital converter, and a PC for image acquisition and processing. The CCD full-well capacity was limited to 80,000 electrons. The camera can be modulated up to 300 kHz with a 95% modulation depth. The control box contained a computer-controlled frequency source, 12-bit A/D converter, computer interface, and modulation electronics. The image readout rate was limited by the data rate of the link between the control box and computer. The LED array, which was used as a modulated light source, was composed of 100 blue LEDs. The illumination output was 7 W/m2 at a distance of 50 cm. The fluctuation of the lamp was 0.1% per hour under laboratory conditions after a warm-up period of 5 minutes. The modulation frequency for the FLIM system was set to 150 kHz in their experiments. Figures 9.62 and 9.63 show the temperature distributions and pressure coefficient distributions obtained by the intensity-based CCD camera system and FLIM system, respectively, where the coordinates were normalized by the nozzle diameter (D). The pressure coefficient Cp was defined as Cp = (p – patm )/qexit, where qexit is the dynamical pressure of

the jet at the exit. The intensity-based CCD camera system and FLIM system gave at least qualitatively consistent results. The results from the FLIM system were much noisier perhaps due to relatively high photon shot noise although it had an advantage of requiring no reference image.

Подпись: 0 5 b/D Подпись:Подпись: -5Impinging JetsПодпись: 00 99 298 297 296Подпись: (b)Подпись: b/DImpinging JetsПодпись: 295 294 193 92 00 99 298 297 296 295

Fig. 9.62. Temperature distributions obtained using (a) the intensity-based CCD camera system and (b) the FLIM system. From Guille (2000)
Impinging Jets

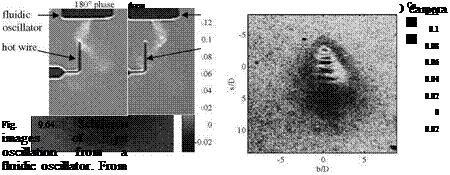
Sakaue et al. (2001) utilized an oscillating nitrogen impinging jet generated by a miniature fluidic oscillator to test the time response of several porous PSP formulations: anodized aluminum (AA) PSP, thin-layer chromatography (TLC) PSP and polymer/ceramic (PC) PSP. The frequency response of AA-PSP, TLC – PSP and PC-PSP measured previously in a shock tube was 12.2 kHz, 11.4 kHz and 3.95 kHz, respectively. Figure 9.64 shows Schlieren images visualizing the flow structures of an unsteady nitrogen jet from a fluidic oscillator.

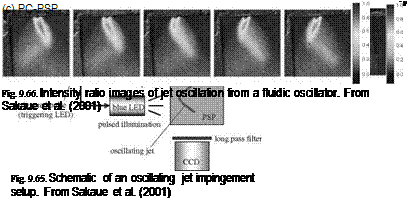
Figure 9.65 is a schematic of the experimental setup for oscillating jet experiments. A porous PSP sample was placed under a fluidic oscillator in parallel to the nozzle centerline. A blue LED array was used as an excitation light source and a Photometrics 12-bit CCD camera (512×752 pixels) was used to capture PSP images through a long-pass filter (>580 nm). The excitation light source was pulsed and synchronized with flow oscillation through a pulse generator based on the flow structure signature sensed by a miniature microphone. A light pulse width was 12 |j. s, corresponding to 6% of a flow oscillation period
Impinging Jets

Impinging Jetswhen the fluidic oscillator was operated at 5 kHz. By controlling a trigger delay in the pulse generator, flow images at different phases were obtained. Figure 9.66 shows the luminescent intensity ratio images visualizing the flow structures of the impinging nitrogen jet at different phases obtained using AA-PSP, TLC-PSP and PC-PSP. The flow structures visualized by all three PSPs were similar to those observed in the Schlieren images. TLC-PSP images and AA-PSP images were captured in the total exposure times of 10 s and 11 s (50,000 and 55,000 light pulses), respectively. AA-PSP provided the sharpest images of the flow structures, indicating a high frequency response.

CCD Camera Measurements

Using a CCD camera system, Bencic (1997, 1998) conducted full-field PSP and TSP measurements on rotating blades of a 24-inch diameter scale-model fan in the NASA Glenn 9×15 ft low speed wind tunnel at rotational speeds as high as 9500 rpm. PSP measurements with a CCD camera on high-speed rotating blades presented challenging problems, such as limited optical access to the entire surface of blades, very short light duration for sufficient illumination, detection of weak luminescence from high-speed rotating blades, and quantitative measurements without standard instrumentation for in-situ calibration of PSP.

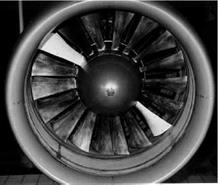
A 25%-scale model fan used for experiments was a single rotation, ultra high bypass fan. Two blades were painted, one with a proprietary Boeing TSP and other with a Boeing PSP (PF2B) on a white primer basecoat. Figure 9.54 shows the painted fan blades installed 180° apart in the fan test rig. The traditional intensity-based method was used for both PSP and TSP, requiring two images for each of the paints to determine the pressure and temperature fields. Nine black targets were applied to both PSP and TSP painted blades for image registration. Both PSP and TSP were illuminated at wavelengths centered at 450 nm with multiple filtered and focused xenon flash quartz lamps with a 2-3 |j. s flash duration. The flash duration was short enough to freeze the motion of the blades with minimal blurring. Note that a 2-|j. s flash duration roughly corresponded to 0.5-mm blurring on blades at the highest speed.

CCD Camera Measurements

Fig. 9.54. PSP and TSP painted blades mounted in an ultra-high bypass ratio fan rig. From Bencic (1997)

Bencic (1997, 1998) used a 14-bit cooled scientific CCD camera (512×512 pixels) that was fitted with a 200-mm lens attached with a band-pass filter around 600 nm for both PSP and TSP. Image acquisition and pulsed excitation were synchronized with the position of the rig using a trigger signal from a magnetic speed sensor. Using a delayed trigger signal, blade motion could be stopped anywhere in a full rotation of 360o. Therefore, a PSP blade image was acquired

and then, by delaying the trigger signal in a 180o phase angle, a TSP image was taken since the PSP and TSP coated blades were installed 180o apart, as shown in Fig 9.54. Images were acquired and integrated over two hundred revolutions under excitation of multiple flashes while the camera shutter was kept open until achieving an acceptable CCD well capacity.

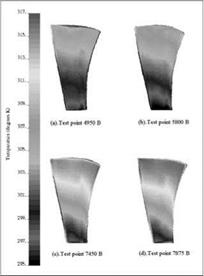
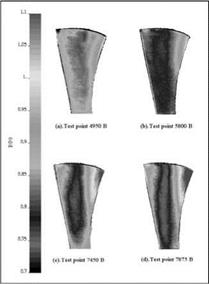
Two wind-off reference images and two data images of TSP and PSP were taken at each fan operating condition of interest. TSP images were used to correct the temperature effect of PSP. Figures 9.55 and 9.56 show, respectively, the temperature images and pressure images at the test points 4950B, 5800B, 7450B and 7875B that correspond to the speeds of 4950, 5800, 7450 and 7875 rpm, respectively. The surface temperature change on the blade was as large as 20oC under the operating conditions. TSP visualized flow separation occurred approximately at 75% span and 60% chord at the test points 7450B and 7875B.

CCD Camera Measurements

Fig. 9.55. Temperature fields on the TSP-coated blade at four rig speeds of 4950, 5800, 7450 and 7875 rpm. From Bencic (1997)

CCD Camera Measurements

Fig. 9.56. Normalized pressure fields on the PSP-ccoated blade at four rig speeds of 4950, 5800, 7450 and 7875 rpm. From Bencic (1997)

Laser Scanning Measurements

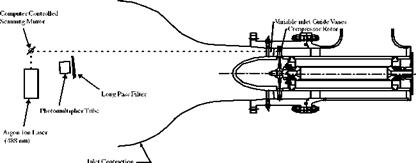
Using a laser scanning system, Liu et al. (1997a) and Torgerson et al. (1997, 1998) performed PSP measurements on rotor blades in a high-speed axial flow compressor (the Purdue Research Axial Fan Facility) and an Allied Signal F109 turbofan engine. They used Ru(dpp) in GE RTV 118 mixed with silica gel particles as PSP and Ru(bpy) in Shellac as TSP. PSP and TSP were coated on blades by dipping them into the paints, resulting in about 20-|jm thick coatings. Figure 9.47 is a schematic of a laser scanning system used for PSP and TSP measurements in the compressor facility where optical access is very limited. An air-cooled Argon laser with the filtered output at 488 nm was used as an illumination source; the laser was mounted upstream of the inlet contraction. The laser beam focused by a lens passed between upstream inlet guide vanes and illuminated rotor blades in a 1-mm diameter spot. Using a computer-controlled scanning mirror, a laser spot scanned across 21 spanwise (radial) locations along each blade. As a blade rotated and cut the laser beam, the beam illuminated the painted blade across its chord, and at least 100 data points were obtained across the chord, depending on the rotational speed of the blade. The luminescent emission from the paints was detected using a PMT attached with a long-pass filter for eliminating the excitation light. Data were acquired using a PC with a 12-bit A/D converter operating at the maximum rate of 500,000 samples/s. The pressure and temperature distributions were calculated using a priori calibration relations for both PSP and TSP.

Laser Scanning Measurements

Fig. 9.47. Laser scanning system for PSP and TSP measurements in a high-speed axial flow compressor with very limited optical access. From Liu et al. (1997a)

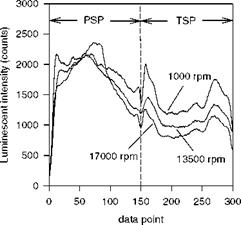
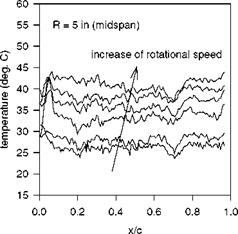
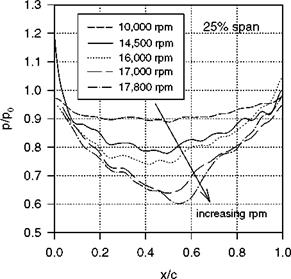
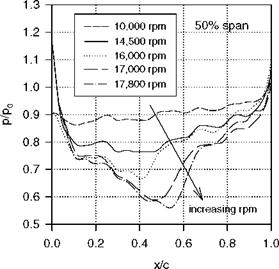
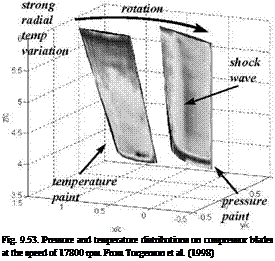
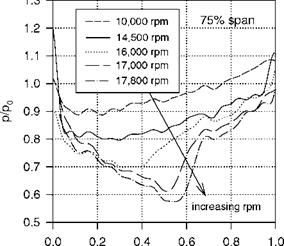
Figure 9.48 shows typical raw intensity signals from PSP and TSP on the suction surface of the painted blades at the rotational speeds of 1000, 13500 and 17000 rpm. As the rotational speed increased, the luminescent intensity of TSP decreased due to the increased surface temperature. A change in the luminescent intensity distribution of PSP was mainly caused by a pressure variation on the surface. In particular, a rapid decrease in the luminescent intensity, which occurred in a region from the 90th to 100th data point (0.6 to 0.67 chord) at 17,000 rpm, corresponded to a large pressure jump generated by a shock. The luminescent signal at the lowest speed of 1000 rpm was used as the reference intensity (nearly wind-off). Figure 9.49 shows the temperature distributions on the suction surface at 50% span at different rotational speeds. The temperature distributions appeared to be flat over a large portion of the chord, and the mean temperature increased with the rotational speed due to friction heating. The highest temperature on the blade surface was about 43oC at the speed of 17800 rpm. The pressure distributions on the surface were obtained using a priori calibration relation of PSP where the temperature effect of PSP was corrected based on the TSP data. Figures 9.50, 9.51 and 9.52 show the chordwise distributions of the relative pressure p/p0 at 25%, 50%, and 75% spans for different rotational speeds, where p0 is the upstream stagnation pressure (one atmosphere pressure in this case). The formation of a shock was evidenced by an abrupt increase in the pressure distributions at the speeds of 17000 and 17800 rpm. As the rotational speed increased, the shock became stronger and its location moved downstream. Figure 9.53 shows a composite representation of the pressure and temperature distributions mapped onto a surface grid of blade at the speed of 17800 rpm.

Laser Scanning Measurements

Fig. 9.48. Raw PMT signals from PSP and TSP at three rotational speeds of 1000, 13500, and 17000 rpm. From Liu et al. (1997a)


Laser Scanning Measurements

Fig. 9.49. Chordwise surface temperature distributions at 50% span at different rotational speeds of 10000, 13500, 14750, 16000, 17000, and 17800 rpm. From Liu et al. (1997a)


Laser Scanning Measurements

Fig. 9.50. PSP-derived pressure distributions at 25% span. From Liu et al. (1997a)


Laser Scanning Measurements

Fig. 9.51. PSP-derived pressure distributions at 50% span. From Liu et al. (1997a)


x/c


Fig. 9.52. PSP-derived pressure distributions at 75% span. From Liu et al. (1997a)


■■Hi 8

– -16

– -14

– -12

U10

:


Laser Scanning Measurements
Подпись: Pressure, psia

Laser Scanning Measurements

Rotating Machinery

PSP is a promising technique for measuring the surface pressure distributions on high-speed rotating blades in turbomachinery where conventional techniques are particularly difficult to use. Using a laser scanning system, Burns and Sullivan

(1995) measured the pressure distributions on a small wooden propeller at a rotational speed of 3120 rpm and a TRW Hartzell propeller at a rotational speed of 2360 rpm. Mosharov et al. (1997) obtained the pressure distributions on propellers using a CCD camera system with a pulse light source. PSP measurements on helicopter rotor blades were carried out at TsAGI (Bukov et al. 1997; Mosharov et al. 1997) and NASA Ames (Schairer et al. 1998b). Navarra et al. (1998) obtained pressure images on a rotor blade using an ICCD camera system. Hubner et al. (1996) suggested a lifetime imaging method for PSP measurements on a rotating object based on detecting the luminescent decay traces of a rotating painted surface on a CCD camera. Here, we describe two typical PSP measurements on rotating blades where a laser scanning system and a CCD camera system were used respectively.

. Cryogenic Wind Tunnels

PSP measurements were made in cryogenic wind tunnels where the oxygen concentration in the working nitrogen gas is extremely low and temperature is as low as 90 K (Asai et al. 1997a; Upchurch et al. 1998). The development of cryogenic PSP formulations was motivated by the needs of global pressure measurement techniques in large-scale pressurized cryogenic wind tunnels such as the National Transonic Facility (NTF) at NASA Langley and the European Transonic Wind Tunnel (ETW). Asai et al (1997a) developed a binder-free PSP coating on an anodized aluminum surface and measured the surface pressure distributions on a 14% thick circular-arc bump model in a small cryogenic wind tunnel in the National Aerospace Laboratory (NAL) in Japan. PSP data wee in good agreement with pressure tap data at 100 K over a range of the Mach numbers of 0.75-0.84. However, the methodology of coating on an anodized surface cannot be applied to stainless steel models typically used in cryogenic wind tunnels. Upchurch et al. (1998) developed a polymer-based cryogenic PSP that could be universally applicable to all types of surfaces including stainless steel and this paint was successfully demonstrated in pressure measurements on an airfoil in the 0.3-m cryogenic tunnel at NASA Langley. Asai et al. (2000, 2002) also presented a polymer-based cryogenic PSP formulation applied to cryogenic wind tunnels and short-duration shock tunnels, which was based on a polymer named Poly(TMSP) having extremely high gas permeability. This PSP can be dissolved
into a solvent and applied using an airbrush to any model surface including stainless steel in contrast to AA-PSP only applicable to aluminum or aluminum alloy. Hitherto, cryogenic PSP measurements have not been conducted in NTF and ETW due to safety concerns on injection of a small amount of air (oxygen) into the tunnels. Therefore, small cryogenic tunnels are more suitable to preliminary pioneering experiments since they are more adaptable and relatively inexpensive to run.

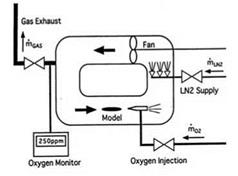
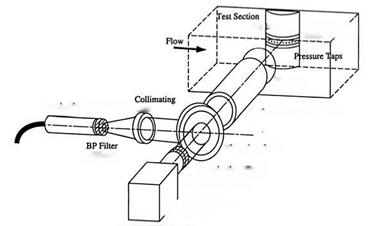
Asai et al. (2000, 2002) described application of Poly(TMSP)-based PSP and AA – PSP data to a circular-arc bump model and a delta wing model in the 0.1-m Transonic Cryogenic Wind Tunnel at NAL. Figure 9.41 is a schematic of the tunnel operated by controlling both liquid nitrogen injection and gaseous nitrogen exhaust. A small amount of air was injected just downstream of the test section, and the oxygen concentration in flow was measured from sampled exhaust gas using a Zirconia (ZrO2) sensor. The oxygen concentration was varied from near zero to 2000 ppm by adjusting the flow rate of the injected air. Figure 9.42 is a schematic of the optical setup for experiments. The model mounted on the sidewall was viewed through a 70­mm diameter window on the opposite sidewall.

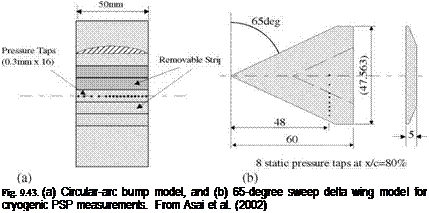
A 300-watt xenon lamp with a band-pass filter (400±50nm) was used for illumination. A dichroic mirror (550 nm) was used to separate the luminescent emission of PSP from the excitation light. A 14-bit cooled CCD digital camera with a band-pass filter (650±20 nm) placed before the lens was used for luminescence measurements. As shown in Fig. 9.43, a 2D bump model and a clipped delta wing were used for experiments. The cross-section of the aluminum bump model was a 14% circular arc having the chord length of 50 mm. The bump model was equipped with 16 pressure taps at the mid-span. The Poly(TMSP)-PSP were coated in two 8­mm wide strips on the surface using an airbrush, while other two strips were anodized to make AA-PSP using a method developed by Sakaue et al. (1999). The stainless steel delta wing model had a 65o-sweep angle and a sharp leading edge, on which an array of eight taps was installed at 80% of the 60-mm model chord. The model was strut-mounted on the sidewall at the angle of attack of 20o. The Poly(TMSP)-PSP was applied to the whole upper surface of the delta wing using an airbrush.

. Cryogenic Wind Tunnels

Fig. 9.41. Schematic of the NAL 0.1 m Transonic Cryogenic Wind Tunnel. From Asai et al. (2002)

Подпись: (475nm)

Подпись: Digital Camera

Подпись: Bump И odd Подпись: Painted / Strips'
Подпись: Optical Access (Vacuum)
Подпись: Window
Подпись: Illumination (Xe Lamp) [^П5

. Cryogenic Wind TunnelsDichroic Mirror

IR Rejection Filter

LP Filter (620nm)

/ Digiu / (12bits)

Подпись: Fig. 9.43. (a) Circular-arc bump model, and (b) 65-degree sweep delta wing model for cryogenic PSP measurements. From Asai et al. (2002)

Fig. 9.42. Schematic of an optical setup for PSP measurements in the NAL 0.1 m Transonic Cryogenic Wind Tunnel. From Asai et al. (2002)

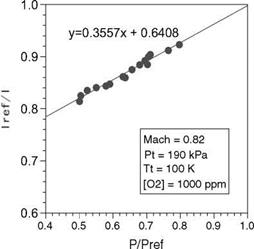
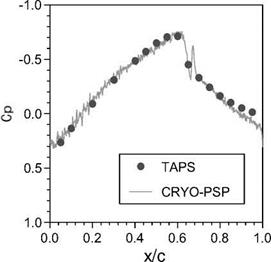
In experiments, the Mach number was set at either 0.4 or 0.82, and the total temperature and pressure in the tunnel were maintained at 100 K and 190 kPa, respectively. The oxygen concentration was varied up to 1000 ppm. Figure 9.44 shows in-situ calibration results for Poly(TMSP)-PSP at the total temperature Tt = 100 K and [O2] = 1000 ppm, indicating the linear Stern-Volmer relation between the luminescent intensity ratio Ire/I and the relative pressure p/pref Since the model surface was fairly isothermal in cryogenic flows, a single calibration curve was used for data reduction on the entire surface of the model. Figure 9.45 shows the
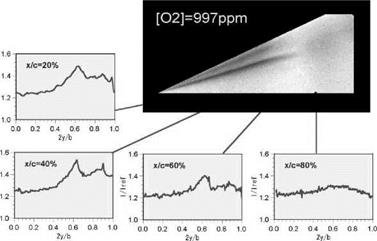
pressure distribution obtained using in-situ calibration on the bump model at Mach 0.82 and T = 100 K, where the image at Mach 0.4 was used as a reference image since the tunnel could not run below that speed. The PSP-derived pressure data were in good agreement with the pressure tap data after in-situ calibration is applied. It was found that the use of a priori calibration did not produce results consistent with the pressure tap data because the slope of a priori calibration curve was twice as large as that of the in-situ calibration curve. For the delta wing model, the raw images were taken at Mach 0.4 and 0.75, the total temperature T t = 100 K, and the oxygen mole fraction [O2] = 997 ppm. Figure 9.46 presents a ratio of the wind-on image at Mach 0.75 to the reference image at Mach 0.4, visualizing the leading edge vortices. The primary and secondary separations were clearly observed. Figure 9.46 also shows the spanwise distributions of the intensity ratio I/Iref on the wing at four chordwise locations. The intensity ratio profiles were noisy because the intensity difference between the images at Mach 0.4 and 0.75 was relatively small. The PSP measurements on the delta wing were basically qualitative.

. Cryogenic Wind Tunnels

Fig. 9.44. In-situ calibration for Poly(TMSP) PSP at the total temperature Tt = 100 K and [O2] = 1000 ppm. From Asai et al. (2002)

. Cryogenic Wind Tunnels

. Cryogenic Wind Tunnels

Fig. 9.45. The pressure coefficient distribution on the bump model obtained using cryogenic PSP compared with pressure tap data at Mach 0.82. From Asai et al. (2002)


Подпись: I/I ref I /1 ref

Fig. 9.46. Intensity ratio image of a delta wing and spanwise intensity distributions at 20, 40, 60, and 80% chords for M = 0.75, Tt = 100 K, Pt = 190 kPa and [O2] = 997 ppm. From Asai et al. (2002)


. Cryogenic Wind Tunnels

Moving Shock Impinging to Cylinder Normal to Wall

Asai et al. (2001) demonstrated the feasibility of Ru(dpp) AA-PSP for time – resolved unsteady pressure measurements in the NAL 0.44 m Hypersonic Shock Tunnel. Figure 9.39 is a schematic of the experimental setup for the shock tube tests. A circular block of a 12 mm diameter was installed vertically in the center of a PSP-coated part flush mounted on the shock tube wall. Calibration of PSP was made by adjusting the test section pressure prior to running the shock tube. Full-field measurements were acquired using a CCD camera with an intensifier that can be gated at successive instants after incidence of a moving shock wave. Illumination for PSP was provided by a flash lamp. Sequential images were obtained from 475 to 530 |J. s in an interval of 5 |J. s. The camera gating time was set at 10 |j. s. Figure 9.40 shows a time sequence of images of an unsteady pressure field induced by a moving shock wave interacting with the stationary circular block, where the shock speed was 610 m/s. Because the observation window flush mounted on the surface of the tube acted like a 2D concave lens, the images were compressed vertically so that a circular section of the cylinder looked like an ellipse. As shown in Fig. 9.40, a curved high-pressure region induced by the reflected shock was formed in the front of the block after the incident plane shock impinged to the block. At the same time, a part of the incident shock continued traveling downstream after it was deflected, and the expansion waves were generated. A pair of symmetric vortices, which are visualized as the low-pressure regions in Fig. 9.40, formed and grew behind the circular block.

Expansion and Compression Corners

Nakakita et al. (2000) used anodized aluminum (AA) PSP to measure the pressure fields on the expansion corner and compression corner models at Mach 10 in the NAL Middle Scale Shock Tunnel with a duration of 30 ms. More recent measurements in shock tunnels were made using AA-PSP on a wing-body model, a hemisphere and scramjet inlet models (Nakakita and Asai 2002;

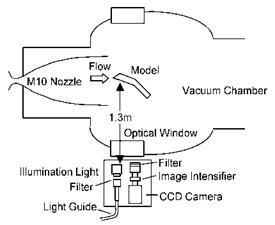
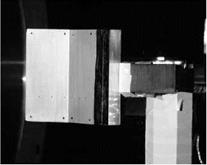
Sakaue et al. 2002b). AA-PSP with a probe molecule Ru(dpp) was used since it had a very short response time of about 30-100 |J. s. Furthermore, because AA – PSP on aluminum models was binder-free and pure aluminum models had high thermal conductivity, an increase of the surface temperature was relatively small (less than 2oC) in most parts of the model during a run in the shock tunnel. The NAL Middle Scale Shock Tunnel had the total temperature of 1180 K, total pressure of 3.4 MPa, Pitot pressure of 7800 Pa, Mach number of 10.4, and Reynolds number 1.6×10⁵ based on the 0.1-m model span. Figure 9.35 shows an optical system for illumination and measurements, which was set at the front of an optical window of a vacuum tank and 1.3 m away from the model. A highly stable continuous xenon lamp (fluctuation of the light intensity was much smaller than 1%) was used as an illumination light source and the illumination light was transmitted through a light guide and projected onto the model by a lens at the exit of the light guide. A cooled 14-bit CCD camera (Hamamatsu C4880-07) attached with an image intensifier (Hamamatsu C6245MOD) was used to detect the luminescent emission from PSP. The intensifier enhanced the capability of the camera to measure weak luminescence in a short exposure time at the cost of introducing additional noise. The spatial resolution of the CCD camera was originally 1008×1018 pixels. However, after 2×2 binning was applied to reduce the shot noise and readout noise, the spatial resolution was reduced to 504×509 pixels. To separate the illumination light from the luminescent emission, a band-pass filter (460±50nm) was placed between the exit of the light guide and the condenser lens transmits; another band-pass filter (600-800nm) was mounted in the front of the intensifier to eliminate the illumination light projected to the CCD camera. The exposure time for the camera was 20 ms.

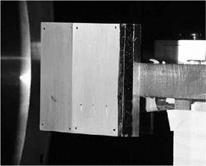
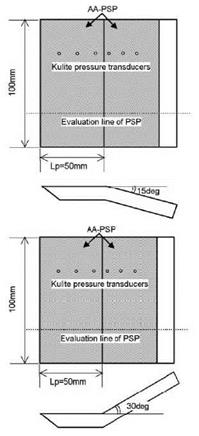
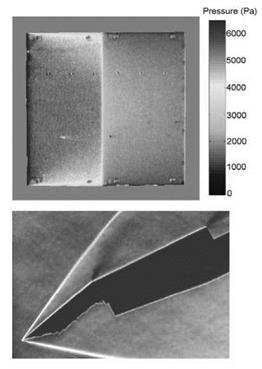
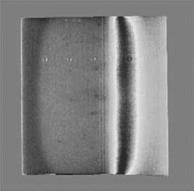
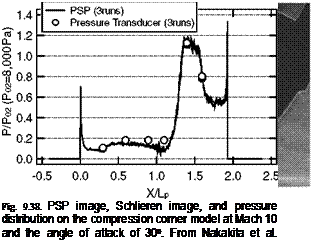
Figure 9.36 shows the expansion corner and compression corner models made of pure aluminum. Both models had an upstream plane connected to a downstream plane. The expansion corner model had the downstream plane deflecting outward 15o relative to the upstream one, whereas the compression corner model had the downstream plane having a 30o ramp against the upstream one. There were six pressure taps connected Kulite (XCS-093-5A) pressure transducers on each model to provide reference pressure data for comparison. The expansion corner model was tested at the angles of attack of 10, 20, 30 and 40 degrees. Figure 9.37 shows a typical PSP image and a Schlieren image along with a comparison plot of PSP data with pressure tap data at the angle of attack of 40o. In Fig. 9.37, the horizontal axis is the coordinate along the model surface normalized by the length of upstream plane Lp and the vertical axis is the local pressure normalized by the Pitot pressure P02. PSP data were in good agreement with the pressure tap data. On the expansion corner model, the flow field on each plane can be considered as a 2D wedge-flow where pressure on the surface is constant. As shown in Fig. 9.37, the pressure distributions are nearly uniform on the upstream and downstream planes. The Schlieren images indicate a shock wave at the leading edge and an expansion fan at the corner of the model. The compression corner model was also tested at the angles of attack of 0, 10, 20, and 30 degrees. Figure 9.38 shows a typical PSP image, a Schlieren image, and a pressure distribution plot for the compression corner at the angle of attack of

30o. The Schlieren image indicates a much more complicated flow field

including shock/boundary-layer interaction and shock/shock interaction on the compression corner model. The high-pressure region was associated with shock/shock interaction near the corner. Again, PSP data were in good agreement with the pressure tap data.

Expansion and Compression Corners

Fig. 9.35. Optical system for PSP measurements and calibration in the NAL Middle Scale Shock Tunnel (viewing from the ceiling). From Nakakita et al. (2000)

Expansion and Compression Corners
Подпись: (a)
Expansion and Compression Corners
Подпись: (b)
Expansion and Compression Corners

Fig. 9.36. Experimental models: (a) Expansion corner model and (b) Compression corner model. From Nakakita et al. (2000)

Подпись:

Expansion and Compression Corners

0.8

‘ns

Q_

0.6

о

о

со

0.4

Q_

0.2 0.0

-0.5 0.0 0.5 1.0 1.5 2.0 2.5

X/Lp

Fig. 9.37. PSP image, Schlieren photograph, and pressure distribution on the expansion corner model at Mach 10 and the angle of attack of 40o. From Nakakita et al. (2000)

Pressure (Pa) _18000

Expansion and Compression CornersИ16000

Ц-мооо 12000 10000 8000 6000 14000

B2OOO

Expansion and Compression Corners
-Bo

Hypersonic and Shock Wind Tunnels

PSP application in hypersonic flows is more difficult because high enthalpy of flows may produce such a large temperature increase on a model that the temperature effect of PSP is overwhelming. Since hypersonic wind tunnels are usually short-duration tunnels, a very thin PSP coating is required not only to sustain high skin friction, but also to achieve a short response time. However, the luminescent emission from a very thin PSP layer is weak and thus a low SNR becomes a problem. The short run-time limits the exposure time of a CCD camera to collect photons and further reduces the possibility of improving the SNR. Kegelman et al. (1993) conducted PSP measurements on a 1/6-scale Pegasus launch vehicle model and a shock/boundary-layer interaction model in the NASA Langley Mach 6 High Reynolds Number Tunnel. The McDonnell Douglas PSP and TSP were used in their tests. The pressure distributions obtained using PSP on the Pegasus model were in qualitative agreement with the Navier-Stokes code results over most of the wing. However, considerable discrepancies between the PSP data and CFD results were observed near the leading edge and wing tip where high temperature generated by aerodynamic heating exceeded the workable temperature range of the paint. Quantitative PSP results, which were compared favorably with the pressure tap data, were obtained on the surface of a flat-plate model on which an oblique shock impinged; the accuracy of about 0.1 psia was reported.

Using fast-responding PSP formulations, Troyanovsky et al. (1993) carried out semi-quantitative PSP visualization in shock/body interaction in a Mach 8 shock tube with a duration of 0.1 s. Borovoy et al. (1995) measured the pressure distribution on a cylinder at Mach 6 in a shock wind tunnel with a duration of 40 ms, and achieved reasonable agreement with the theoretical solution and pressure transducer measurements. Jules et al. (1995) used a McDonnell Douglas PSP to study shock/boundary-layer interaction over a flat-plate/conical-fin configuration at Mach 6, showing a systematic shift compared to pressure tap measurements. Hubner et al. (1997, 1999, 2000, 2001) measured the pressure distributions on a wedge and an elliptic cone at Mach 7.5 in the Calspan hypersonic shock tunnel with a run-time of 7-8 ms. To reduce the temperature effect of PSP, they applied PSP directly on the metal model surface rather than a white basecoat. However, for a very thin layer of PSP without a white basecoat, the luminescent intensity of PSP was so low that only 5-12% of the CCD full-well capacity was utilized. Buck

(1994) discussed simultaneous temperature and pressure measurements on dyed ceramic models using luminescent materials in hypersonic wind tunnels.

Boundary Layer Control in Supersonic Inlets

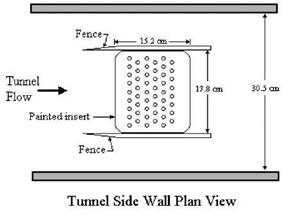
Bencic (2002) applied PSP to boundary layer control experiments in supersonic inlets through mass removal in the 1×1 foot Supersonic Wind Tunnel at NASA Glenn. The tests investigated shock/boundary-layer interactions that caused a reduction in the inlet performance due to boundary layer separation. As shown in Fig. 9.31, the test setup consisted of a porous boundary layer control device replacing a wind tunnel sidewall panel. The boundary layer bleed used a pressure difference generated by a suction plenum mounted to the backside of the porous surface to remove the low momentum fluid in the boundary layer.

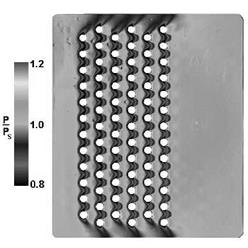
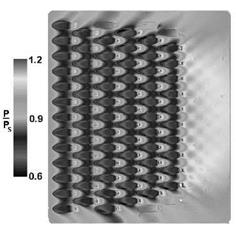
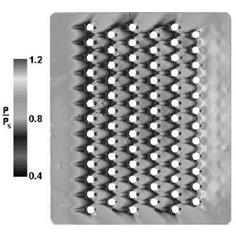
The bleed control panels were painted with a silicone-based Ruthenium PSP (Boeing PF2B). Reference images were taken at reduced pressure of approximately 12 kPa since this facility had the capability to be brought to near vacuum conditions quickly. The reduced reference pressure was used because it was in the range of pressures measured on the porous plates during wind tunnel operation. A constant exposure time was used for both the wind-off and wind-on images, producing images that filled about 80% of the full-well capacity of the CCD camera. Each image was ensemble average of eight frames to further reduce the photon shot noise. Reduction of the acquired data was performed using the intensity-based method plus in-situ calibration based on data from 16 pressure taps located in the painted sections. Typical PSP images are shown in Figs. 9.32, 9.33 and 9.34 for three surface bleed configurations C1, C6 and C3 that denote the standard 90° bleed hole configuration, the pre-conditioned 90° bleed hole configuration and the 20° inclined bleed hole configuration, respectively (Willis et al. 1995). Each image was acquired at a nominal tunnel speed of Mach 2.0 under the similar conditions of the total mass flow through the bleed hole regions.

The PSP images show the surface pressure normalized by the wall static pressure measured upstream of the fenced porous plate insert. The orifice and row interactions, which were clearly evident in these figures, were undetectable with conventional pressure tap instrumentation. The significant result from this test was the performance increase of 50% in removing mass by the pre-conditioned 90° configuration compared to the standard 90° orifice as reported by Willis et al.

(1995) . This increase was due to a combination of flow turning and the pressure gradient acting across the flush inlet. The performance differences between these configurations can be seen as larger pressure excursions as noted by the change in lower scale in Figs. 9.32, 9.33 and 9.34. The more efficient configurations in Figs. 9.33 and 9.34 generally showed a higher level of interaction between adjacent rows compared to the standard 90° configuration in Fig. 9.32. The PSP measurements had an error of 0.3 kPa or less in these examples. A systematic shift was found between PSP and pressure tap data in the bleed hole region compared to the solid region upstream and downstream of the porous region. This shift was due to a temperature difference in the aluminum insert plate caused by the airflow through the orifice holes. Clearly, simultaneous full-field temperature measurements (TSP or infrared thermography) are needed to compensate for the temperature sensitivity of PSP to minimize the errors associated with the effect.

The experiments of Bencic (2002) represent a typical PSP application to complicated geometric configurations in turbomachinery flows. PSP provides a powerful diagnostic tool for turbomachinery flows with complex shock wave structures where a pressure field cannot be mapped with conventional techniques in a high spatial resolution. PSP has been used for pressure measurements in narrow supersonic channel, shock/wall interaction, stator vanes, transonic fan cascade, mixer-ejector nozzles, and jet/flow interaction (Lepicovsky and Bencic 2002; Taghavi et al. 1999; Lepicovsky 1998; Lepicovsky et al. 1997; Cler et al. 1996; Everett et al. 1995). However, confined spaces by multiple surfaces in turbomachinery cause significant inter-reflection of the luminescent light between neighboring surfaces and this self-illumination complicates the data processing to extract correct values of pressure on these surfaces. So far, a correction scheme for the self-illumination was made only for simple geometric configurations such as a corner between two planes. For complex geometry in turbomachinery, an efficient numerical scheme for correcting the self-illumination effect have to be developed based on an accurate model for the bi-directional reflectance distribution function of PSP (see Section 5.3).

Boundary Layer Control in Supersonic Inlets

Fig. 9.31. Test setup of a bleed control panel as a boundary layer control device. From Bencic (2002)


Boundary Layer Control in Supersonic Inlets

Fig. 9.32. Normalized surface pressure map P/P s on the control panel with a standard multiple 90° bleed hole configuration, where Ps is the wall static pressure measured upstream of the fenced porous plate insert. Tunnel flow is from left to right. From Bencic (2002)


Boundary Layer Control in Supersonic Inlets

Fig. 9.33. Normalized surface pressure map P/P s on the control panel with a multiple pre­conditioned 90° bleed hole configuration, where Ps is the wall static pressure measured upstream of the fenced porous plate insert. Tunnel flow is from left to right. From Bencic (2002)


Boundary Layer Control in Supersonic Inlets

Fig. 9.34. Normalized surface pressure map P/Ps on the control panel with a multiple 20° inclined bleed hole configuration, where Ps is the wall static pressure measured upstream of the fenced porous plate insert. Tunnel flow is from left to right. From Bencic (2002)


Laser Scanning Pressure Measurement on Transonic Wing

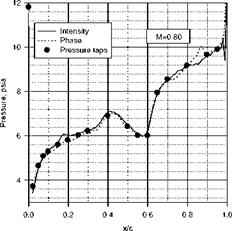
Torgerson (1997) demonstrated a phase-based laser scanning system for PSP measurements on a transonic airfoil in the Boeing Company model transonic wind tunnel. A 10% thick airfoil having a sharp leading edge and a small amount of camber was used, which was equipped with 19 pressure taps along the upper surface for a comparison with PSP data. The airfoil was coated with a Ruthenium – based PSP. The scanning system had a small air-cooled argon-ion laser for excitation and a PMT as a detector. The blue laser beam was modulated using an electro-optic modulator before scanning over the airfoil surface with a computer – controlled mirror, enabling the PMT signal to be processed using a two-phase lock-in amplifier. Both the phase and intensity signals were recorded during scanning over the airfoil such that a comparison between the intensity and phase methods could be made. Figure 9.30 shows a typical pressure distribution at Mach 0.8, indicating that both the phase and intensity methods compared favorably with the pressure tap data after in-situ calibration was applied. Nevertheless, phase-based measurements had the advantage that the wind-off data were not required.

Laser Scanning Pressure Measurement on Transonic Wing

Fig. 9.30. Pressure distribution on a transonic airfoil obtained using a laser scanning system based on the phase and intensity methods. From Torgerson (1997)