Category Pressure and Temperature Sensitive Paints

. Transonic Wing-Body Model

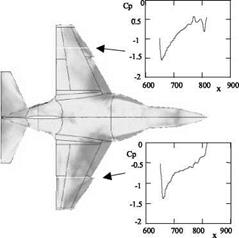
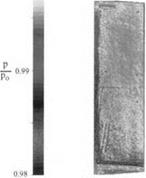
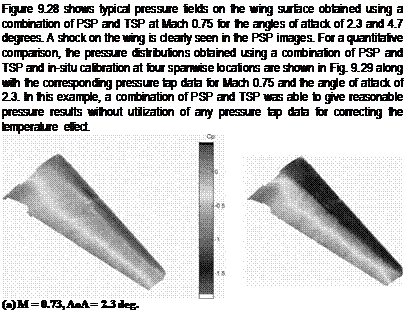
Shimbo et al. (2000) conducted PSP measurements on an 8%-scaled model of the Mitsubishi MU-300 business jet at the Mach numbers 0.6-0.8 and the angles-of – attack 0-4.6 degrees in the 2-m transonic wind tunnel at the National Aerospace Laboratory (NAL) in Japan. The main objective of their tests was to examine the feasibility of PSP combined with TSP for correcting the temperature effect of PSP. The model was equipped with 32 pressure taps in four rows on the upper surface of the starboard wing. A water-cooled 14-bit CCD camera (1008×1018 pixels) attached with optical filters was used. A xenon lamp was used as an excitation light source and the light was introduced through optic fibers to light reflectors. Each light reflector had an optical filter such that only the UV light went through for paint excitation. The classical PSP, PtOEP in GP-197, was applied on the upper surface of the starboard wing for pressure measurements, whereas a typical TSP, EuTTA in PMMA, was applied on another wing for temperature measurements. Since the emission peaks of both PSP and TSP were close in the emission spectra, the luminescent intensity from both PSP and TSP were acquired on the same image using the CCD camera mounted on the ceiling of the test section. Assuming the flow symmetry with respect to the model centerline, Shimbo et al. (2000) used the temperature distributions on one of the wings obtained by TSP to correct the temperature effect of PSP on another wing.

Подпись:
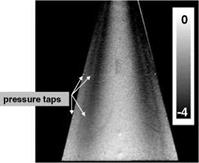
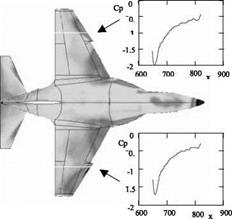
Fig. 9.28. Typical pressure fields on the Mitsubishi MU-300 business jet model obtained using a combination of PSP and TSP at Mach 0.73 and a = 2.3 and 4.7 degrees. From Shimbo et al. (2000)

. Transonic Wing-Body Model

Fig. 9.29. Comparison between PSP (lines) and pressure tap data (circles) for the Mitsubishi MU-300 business jet model at Mach 0.73 and a = 2.3 deg. PSP data were obtained using a combination of PSP and TSP as well as in-situ calibration. From Shimbo et al. (2000)

Supercritical Wing at Cruising Speed

Using porphyrin-based PSPs (FIB, Uni-Coat, Sol-gel, FEM, and PAR paints), Mebarki and Le Sant (2001) studied the pressure fields on the supercritical wing of a Dash 8-100 aircraft model at the cruising Mach number 0.74. Experiments were conducted in a blow-down pressurized tri-sonic wind tunnel at the Institute for Aerospace Research (IAR) of National Research Council (NRC) in Canada. At Mach 0.74, the total pressure of flow was changed from 1.4 bar to the maximum value of 3.1 bar, and accordingly the unit Reynolds number from 18.7 to 49 millions/m. The duration of a run depended on the Mach number and total pressure p0. At Mach 0.74, the run duration varied from 11 seconds at Rec = 8.51×10⁶ and p0 = 3.14 bar to 37 seconds at Rec = 3.81×10⁶ and p0 = 1.41 bar, where Rec is the Reynolds number based on the mean chord. The start-up time to establish stable flow was 2 seconds. The supercritical wing without a nacelle had a zero swept angle at the 60% chord line. The steel wing with an aluminum half fuselage was mounted on an external sidewall balance. The overall length, wingspan and mean chord of the model were 1.73, 1.1 and 0.203 m, respectively. The airfoil sections were designed to sustain extensive laminar flow on the surface. The wing was equipped with four rows of 32 pressure taps (stations A, B, C and D), which were located at 11%, 27%, 35% and 57% of the wingspan, respectively.

The ceiling of the test section was equipped with 20 optical windows. To provide fairly uniform and stable illumination, 16 cooled green halogen lamps (Iwasaki JY 1562 GR/N/CG 50W) with filters (color filter KOPP 4-96) were used for all the PSP formulations since they used the same porphyrin molecule (PtTFPP) as a probe. A 12-bit CCD Photometrics camera (1024×1024 pixels) and an Infrared Agema 900 camera (136×272 pixels) were mounted in the plenum shell. The CCD camera, equipped with two interference filters (Andover 650FS40 and Melles Griot 03FIB014) in parallel, recorded the luminescent emission of PSP from the wing root (station A) to approximately 85% of the wingspan. The infrared camera focused on three rows of taps (from station B to D), thus covering 30% of the wingspan. Of the porphyrin-based (PtTFPP) PSP formulations used, the PAR PSP from IAR and FEM PSP from NASA Langley were not commercially available, and three other paints, the FIB PSP, Sol-gel PSP and Uni­Coat PSP, were commercially produced by Innovative Scientific Solutions Inc. (ISSI) in Dayton, Ohio.

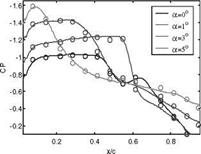
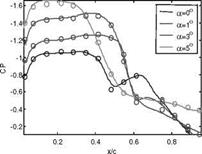
Figure 9.26 shows a comparison of pressure results obtained using the FIB PSP with the pressure tap data at the spanwise stations B (27% wingspan) and C (35% wingspan) for four angles of attack at Mach 0.74 and Rec = 3.8×10⁶, where in-situ calibration was applied. An average error in Cp was about 0.02, corresponding to 1.4% of the full pressure range at those locations. Figure 9.27 shows the distributions of Cp along with the corresponding temperature distributions obtained using an infrared camera for the angles of attack of 0, 1, 3 and 5 degrees at Mach 0.74 and Rec= 3.8×10⁶. A shock across which a rapid change of pressure occurred can be clearly identified in these PSP images. At the angle of attack of 5o, the wedge-like patterns at the spanwise stations C and D can be observed in the PSP images, which are associated with flow separation triggered by surface
imperfections near the leading edge of the wing. Fluorescent oil flow visualization on the surface confirmed this observation. As shown in Fig. 9.27, infrared thermography visualizes a surface temperature change induced by the flow separation at these stations and indicates that small turbulent wedges are generated by surface imperfections at the angles of attack of 0, 1 and 3 degrees. However, these turbulent wedges did not significantly alter the pressure distributions. In addition, using the Uni-Coat PSP, they studied the Reynolds number effect on the pressure distribution on the wing.

Mebarki and Le Sant (2001) evaluated the accuracy of PSP measurements at Mach 0.74 for all the PSP formulations through in-situ calibration. Table 9.1 summarizes the accuracy of the PSP results in terms of the absolute difference in Cp and the percentage error (%FS) over the full-scale range of Cp that is defined as the maximum range of Cp measured during a run on the wing upper surface by 39 pressure taps. The exposure times of the camera used for the PSP formulations are also listed in Table 9.1, depending on the luminescent intensity of a particular paint. Generally speaking, the accuracy was fairly good for all the PSPs at different Reynolds numbers despite their different temperature sensitivities, because a temperature variation over the wing chard during a run was relatively small (less than 2oC).

Table 9.1. Absolute and relative accuracy of PSP formulations in Cp

PSP

M

= 0.74, Rc =

3.8 mil

M

= 0.74, Rc =

8.5 mil

t (ms)

ACp

%FS

t (ms)

ACp

%FS

Uni­

Coat

50

0.04

3.2

75

0.10

8.4

Sol-gel

125

0.04

2.8

250

0.04

3.1

FIB

500

0.02

1.4

1000

0.03

2.7

FEM

500

0.02

1.7

1000

0.04

3.3

PAR

250

0.03

2.2

500

0.03

2.6

Supercritical Wing at Cruising Speed

Station B Station C

Fig. 9.26. Comparison of PSP results (lines) obtained using the FIB PSP with pressure tap data (circles) at M = 0.74 and Rec= 3.8×10⁶. From Mebarki and Le Sant (2001)

Aircraft Model in Transonic Flow

Engler et al. (2001b) measured the pressure distributions and aerodynamic loads on an AerMacchi M-346 Advanced Trainer Aircraft model at the angles of attack from -4° to 36° and the angles of sideslip from -13° to 13° over a Mach number range of 0.6-0.95. Their experiments represented a good example of PSP application to a complex model with flaps, air brakes, rudders and ailerons in a production wind tunnel, which utilized a two-luminophore PSP, eight CCD cameras and 16 fiber optics illumination heads. In addition, control of PSP hardware and interface with a standard wind tunnel data acquisition/processing system became an operational issue in a production wind tunnel.

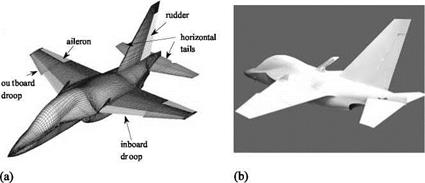
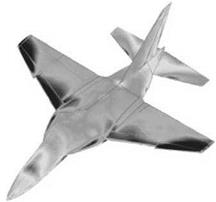
Experiments were conducted in the industrial wind tunnel with a 1.8×1.8 m test-section at DNW-HST in Amsterdam, The Netherlands. The AerMacchi M – 346 advanced trainer aircraft model had a 1.2-m length and a 1.0-m span. Figure 9.20 shows a surface grid and a painted model with exchangeable flaps, air brakes, rudders and ailerons. Since a total of 19 configurations were tested, 20 additional model parts were painted besides the basic model. All the parts of the complex model were illuminated and captured by CCD cameras placed around it in order to measure the aerodynamic effects at high angles-of-attack and angles of sideslip for maneuvers influenced by flaps, air brakes, rudders and ailerons. To overcome the problems of shadows and inhomogeneous illumination for excitation, the Pyrene – based two-luminophore B1 PSP from OPTROD was employed. In addition, since this PSP had weak temperature dependency, the error due to the temperature effect could be reduced.

Aircraft Model in Transonic Flow

Fig. 9.20. The AerMacchi M-346 advanced trainer aircraft model, (a) surface grid, (b) PSP coated model. From Engler et al. (2001b)

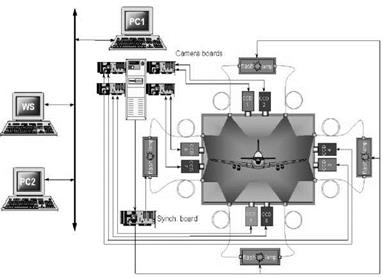
As shown in Fig. 9.21, at each of four observation directions, an UV light source connected to four 20-m long optic fibers; thus, a total of 16 fiber optics heads connected with four UV light sources illuminated the whole model from all the four directions. Eight cooled 12-bit CCD cameras were used for image acquisition. At each observation direction, a twin-CCD-camera unit with different filters was used to acquire in parallel the pressure signal at 450-550 nm (blue) and reference signal at 600-650 nm (red). Figure 9.21 shows a twin-CCD-camera unit and illuminator heads installed on the wall of the test-section. The use of the twin – CCD-camera unit eliminated a filter-shifting device that could not be immune from unsteadiness of the light sources. In this arrangement of cameras and lights, the exposure time was typically 15 seconds for a camera placed at 1 m away from the model.

As PSP was integrated into a standard wind tunnel measurement system, accurate and rapid acquisition and transmission of data became an important issue to decrease the wind tunnel run time. An automatic trigger and data exchange system was used. After acquisition of a set of ‘blue’ and ‘red’ images by the four twin-CCD-camera units (eight CCD cameras), a TTL ready signal from the PSP system was sent to the wind tunnel control/data system, and the flow parameters and model attitudes were adjusted and recorded for next run. After the above process was completed, a TTL trigger signal from the tunnel control/data system activated all the cameras and lights for new PSP measurements.

Given limited illumination sources (16 illuminator heads) for the complex model, shadows were inevitably generated mainly by vertical rudders on the fuselage and horizontal tails. The effect of shadows was largely eliminated using the ratio-of-ratios approach for the pressure (blue) and reference (red) images in the wind-on and wind-off cases (four images in total). In some areas without PSP like registration markers, screws and damaged spots, pressure was given by a proper interpolation scheme from PSP data around these areas.

Aircraft Model in Transonic Flow

Fig. 9.21. PSP system including twin-CCD-camera units, fiber optics illuminators, computers for data/image acquisition. From Engler et al. (2001b)

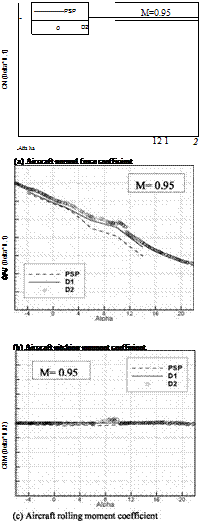
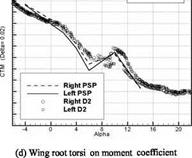
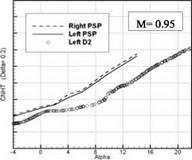
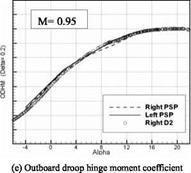
Figures 9.22 and 9.23 show the distributions of the pressure coefficient Cp on the upper surface of the model for the clean configuration and the configuration with positive and negative ailerons at Mach 0.6 and the angle-of-attack of 14o. It can be seen that the pressure distribution is significantly altered from one configuration to another. The pressure distributions along the lines on the wings indicate a symmetric pressure field with respect to the model centerline for the clean wing configuration, in contrast to the asymmetric one for the configuration with the positive and negative ailerons. Figure 9.24 shows a typical pressure field mapped onto a 3D grid of the model. PSP data were first mapped onto the upper, lower, left and right parts of the model grid, and then these parts were merged into a complete 3D surface of the model. From the 3D PSP data on the model surface, Engler et al. (2001b) calculated the coefficients of the normal force (CN), pitching moment (CPM), rolling moment (CRM), wing root torsion moment (CTM), outboard droop hinge moment (ODHM), and horizontal tail normal force (CNHT). Figure 9.25 shows the aerodynamic force and moment coefficients obtained from PSP along with data given by a balance at Mach 0.95 on the configuration with the leading edge droop set to zero. In Fig. 9.25, D1 denotes the data obtained by a six-component balance during PSP tests and D2 denotes balance measurements on the same model without PSP in previous wind tunnel tests. The PSP-derived aerodynamic loads were in reasonable agreement with the balance data except for the horizontal tail normal force. Previous balance data indicated the existence of the forebody side force at high angles-of-attack, which was caused by the asymmetric boundary layer separation and vortex system. In these cases, PSP indeed showed the asymmetric pressure fields on the wings.

Aircraft Model in Transonic Flow

Fig. 9.22. The pressure coefficient (Cp) distributions along the lines on the upper surface on the model for the clean configuration at Mach 0.6 and the angle of attack of 14°. From Engler et al. (2001b)

Aircraft Model in Transonic Flow

Aircraft Model in Transonic Flow

Fig. 9.23. The pressure coefficient (Cp) distributions along the lines on the upper surface on the model for the configuration with the positive and negative ailerons at Mach 0.6 and the angle of attack of 14°. From Engler et al. (2001b)


Aircraft Model in Transonic Flow

Fig. 9.24. Typical pressure distribution mapped onto a surface grid of the model. From Engler et al. (2001b)


Aircraft Model in Transonic Flow

M= 0.95

Aircraft Model in Transonic Flow


Aircraft Model in Transonic Flow

(f) Horizontal tail normal force coefficient


Aircraft Model in Transonic Flow

Aircraft Model in Transonic Flow

Fig. 9.25. The coefficients of aerodynamic loads obtained from PSP compared with the force balance data. From Engler et al. (2001b)

Subsonic, Transonic, and Supersonic Wind Tunnels

Most PSP measurements were conducted in high subsonic, transonic and supersonic flows since PSP is most effective in a range of the Mach numbers from 0.3 to 3.0. Experiments on various aerodynamic models with PSP in large production wind tunnels have been made at three NASA Research Centers (Langley, Ames and Glenn), the Boeing Company at Seattle and St. Louis, AEDC, and Wright-Patterson in the United States. Also, PSP has been widely used in wind tunnels at TsAGI in Russia (Bukov et al. 1993, 1997; Troyanovsky et al. 1993; Mosharov et al. 1997), British Aerospace and DERA in Britain (Davies et al. 1995; Holmes 1998), DLR in Germany (Engler et al. 1995, 1997a, 2001b), ONERA in France (Lyonnet et al. 1997), and NAL in Japan (Asai 1999). Besides predominant applications of PSP in external aerodynamic flows, PSP has been used to study supersonic internal flows with complex shock wave structures in turbomachinery (Cler et al. 1996; Lepicovsky 1998; Lepicovsky et al. 1997; Taghavi et al. 1999; Lepicovsky and Bencic 2002). This section describes typical PSP measurements in subsonic, transonic and supersonic flows.

Impingement Jet

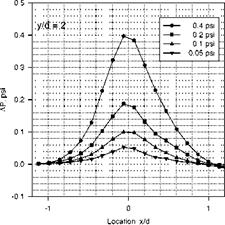
Torgerson et al. (1996) conducted PSP experiments in a low-speed impinging jet to determine the limiting pressure difference that can be resolved using a laser scanning system combining an optical chopper or acoustic-optic modulator with a lock-in amplifier. They tested three PSP formulations, Ru(dpp) in GE RTV 118, PtTFPP in model airplane dope and PtTFPP/Green-Gold in dope. Ru(dpp) in GE RTV 118 had a relatively low temperature sensitivity of 0.78%/°C compared to 1.8%/°C for PtTFPP-dope PSP. PtTFPP/Green Gold in dope was a two – luminophore PSP where Green Gold served as a pressure-insensitive reference dye. They compared the intensity ratio method, phase method and two-color ratio method to evaluate their feasibility for low-speed PSP measurements. The paint was coated on a white Mylar film attached on an aluminum impingement surface that was located at 10 mm away from a 5-mm diameter nozzle. A laser beam modulated by an optical chopper provided illumination for PSP at 457 nm. A 0.2­mm laser spot was scanned across the impingement plate. The luminescent emission was detected using a PMT through a long-pass filter (>600 nm). The PMT signal was input into a lock-in amplifier connected with a PC either to reduce the noise for intensity-based measurements or to extract the phase angle for phase-based measurements. For Ru(dpp) in GE RTV 118, a typical chopping frequency was 500 Hz with a lock-in time constant set to 200 ms. Pressure was calculated from the intensity ratio and the phase angle after five scan ensembles were averaged. Figure 9.19 shows the pressure distributions on the impingement plate converted from the intensity ratio of Ru(dpp) in GE RTV 118, where the lateral coordinate is normalized by the nozzle diameter. These results indicated that the laser scanning system, working with Ru(dpp) in GE RTV 118, was able to measure an absolute pressure difference as low as 0.05 psi with a reasonable accuracy. However, it was found that the PtTFPP-dope PSP exhibited a stronger temperature effect distorting significantly the pressure distribution near the shear layer region of the impinging jet.

Phase measurements in the wind-off case for Ru(dpp) in GE RTV 118 and PtTFPP in dope led to a somewhat surprising finding that the phase angle showed a repeated variation or pattern over a scanning range even when pressure and temperature were uniformly constant. The phase variation introduced a considerable error in low-speed PSP measurements although it might not be significant for PSP application to high-speed flows. The phase variation was attributed to microheterogeneity of a polymer environment around a probe molecule that locally altered the luminescence and quenching behavior. To correct this intrinsic pattern of the phase angle (or lifetime), a ratioing process is still needed. Similarly, for the two-luminophore paint PtTFPP/Green-Gold in dope, a two-color intensity ratio was not constant over a scanning range because the two dyes were not homogeneously mixed into the binder. In this case, a ratio – of-ratios of the signals was used to remove this effect.

Impingement Jet

Fig. 9.19. Pressure distributions in a low-speed impinging jet obtained using a laser scanning system. From Torgerson et al. (1996)

Delta Wings, Swept Wings, and Car Models

PSP measurements on delta wings, swept wings and car models at low speeds were performed at ONERA in France and DLR in Germany to optimize their paint formulations, hardware and software for low-speed measurements (Engler et al. 2001a). It is realized that PSP measurements at low speeds require the accuracy of 0.1% over a pressure range of 800-1000 mb. This accuracy is difficult to achieve using a typical PSP with a temperature sensitivity of 1%/K because a temperature change of 0.1 K could produce an error as large as a required pressure resolution. Furthermore, the accuracy of PSP is further reduced due to the camera noise and variation of the excitation intensity during a test run. The most common procedure to deal with the temperature effect is application of in-situ calibration to correlate the local luminescent intensity to the corresponding pressure tap data under an assumption that the temperature distribution on a model is uniform. In this case, the temperature-induced error is absorbed into an overall fitting error in in-situ calibration. Even though some systematic errors are removed, it is impossible for this procedure alone to reduce the error to a level equivalent to that caused by a temperature change of 0.1 K on a non-uniform thermal surface in wind tunnel tests. After investigating low – speed PSP measurements in large production wind tunnels at NASA Ames, Bell et al. (1998) pointed out that the most significant errors were due to the temperature effect of PSP and model motion. Therefore, a better solution is the combined use of in-situ calibration with a temperature-insensitive PSP. An illumination field should be measured in order to correct both the spatial and temporal excitation variations on a surface. Furthermore, a large number of images (up to 64) should be averaged to reduce the camera noise.

Engler et al. (2001a) tested three Pyrene-based PSP formulations for low – speed measurements. One was the B1 PSP developed by OPTROD in Russia, in which a pressure-insensitive reference dye was added to correct the excitation variation when performing a ratio between the pressure and reference emissions. The temperature sensitivity of the B1 PSP was 0.5%/K which could not be neglected when a high accuracy for pressure measurements was required. Another was the PyGd PSP developed at ONERA, containing Pyrene as a pressure-sensitive dye and a gadolinium oxysulfide as a reference component. The two components absorbed the ultraviolet excitation light and emitted the luminescence at different wavelengths. Besides its high sensitivity to pressure, the PyGd PSP displayed a very low temperature sensitivity of 0.05%/K because the temperature sensitivity of the reference component was almost the same as Pyrene and thus an intensity ratio between the two components compensated the temperature effect of Pyrene. Therefore, this paint was suitable to low-speed PSP measurements. The PdGd PSP, developed at ONERA mainly for transonic flows, was also tested to evaluate its feasibility and accuracy of measurements at low speeds. This paint was a mixture of PSP and TSP, containing a pressure – sensitive component Palladium octaethylporphine (PdOEP) and a temperature – sensitive component Gadolinium oxysulfide having a temperature sensitivity of 1.5%/K.

Illumination system used was a Mercury light filtered in a UV range (325±15nm or 340±35nm) and a xenon-flash lamp equipped with four optical outputs with 25-Hz repetition rate (308 nm); the lights were connected to liquid light guides to illuminate models. Cooled CCD cameras (512×512, 1024×1024 or 1340×1300 pixels) with back illuminated detectors were used. A filter holder was placed in the front of the lens or the CCD chip. The filters separated the emitted lights from the pressure component (430-510 nm) and from the reference component (615-625 nm). For the PdGd paint, the third filter was required for the temperature-sensitive component at 480-520 nm. The exposure time was typically 1-30 seconds, depending on the illumination source, camera, and size of a test section. Filter-shifting device and two-camera system were developed to acquire the pressure and reference images.

Preliminary measurements at low speeds were made on a delta wing to identify the major error sources and evaluate the performance of different paints (B1, PyGd and PdGd) under the same flow conditions. The delta wing with a 500-mm chord and a swept angle of 75° was successively painted with the three PSPs. The model was mounted in the ONERA low-speed research wind tunnel having a test section of 1-m diameter and the maximum speed of 50 m/s. The model was equipped with 47 pressure taps used to assess the accuracy of PSP. Ten images for each filter setting (blue or red filter) were taken using the CCD cameras (512×512 and 1340×1300 pixels) for frame averaging.

Delta Wings, Swept Wings, and Car Models

Fig. 9.10. The pressure coefficient C map obtained using the PyGd PSP on a delta wing at 25 m/s. From Engler et al. (2001a)

Figure 9.10 shows a typical image of the pressure coefficient Cp on the 75°-

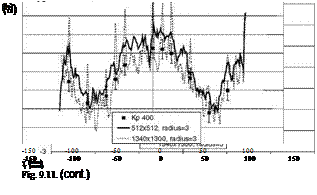
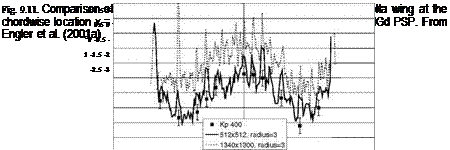
delta-wing obtained using the PyGd PSP at 25 m/s and the angle of attack of 32o. The leading-edge vortex signature was clearly visualized on the model and the secondary vortices were distinguished from the primary vortices. Figure 9.11 shows the distributions of Cp obtained using the B1, PyGd and PdGd PSPs at the

chordwise station equipped with pressure taps, where the error bars of 1 mb (0.0145 psi) indicate the accuracy of PSP measurements. The results obtained
Delta Wings, Swept Wings, and Car Models

using the PyGd PSP are in good agreement with the pressure tap data and less noisy compared to those given by the B1 and PdGd PSPs. This is due to not only much higher luminescent emission from the PyGd PSP, but also very low temperature sensitivity of the PyGd PSP. Spatial averaging was applied to the PSP data over a 3-pixel-radius circle around each pixel. Since a 3-pixel radius in a 512×512-pixel camera corresponded to a larger area on the surface, spatial averaging on the image plane was more effective for the 512×512-pixel camera, which was evidenced by a reduced noise level of the results. Since the PdGd PSP was a mixture of PSP and TSP, the temperature fields were also obtained, indicating a temperature increase of 0.2 K on the wing surface from the left to right. Moreover, by comparing the TSP images taken before and after the test, a temperature increase of 1.6 K was observed in a test run of 30 minutes due to the heat dissipated by the motor of the wind tunnel. Other researchers also measured the pressure distributions on delta wings using PSP at low speeds (Morris 1995; Shimbo et al. 1997; Le Sant et al. 2001a; Verhaagen et al. 1995). The flow over a delta wing is particularly suitable to testing the capability of PSP at low speeds since there is a relatively large pressure change induced by the leading edge vortices on the upper surface.
Delta Wings, Swept Wings, and Car Models
(c)

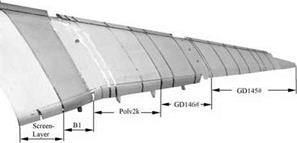
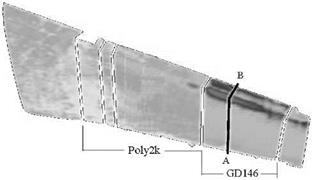
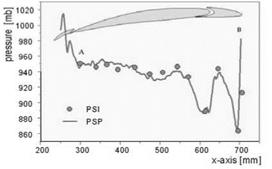
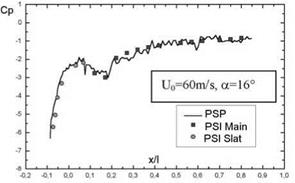
Measurements on swept wings were performed in the Low-Speed-Wind-Tunnel (LSWT) of Daimler-Chrysler Aerospace at Bremen in German. This Eiffel-type wind tunnel with a 2.1×2.1 m test section was operated in a range of velocities from 30 to 75 m/s. Images were acquired at 10 minutes after the tunnel was turned on to stabilize flow temperature and minimize the temperature effect on PSP. During the tests, all ambient light sources were covered and the test section was painted black to minimize reflection of the luminescent light on the walls. After preliminary tests on a swept constant-chord half-wing model to examine the performance of the PSP system, PSP measurements were made on an Airbus A340 half-model. Figure 9.12 shows the wing of the Airbus model coated with different paints including ‘Gottingen Dyes’ (GD) PSPs and B1 PSP of OPTROD. A large number of pressure taps on the wing were available for comparison. Figure 9.13 shows a raw blue image of the wing of the Airbus model illuminated with a 308­nm diffuse lamp when the integration time of the CCD cameras was 32 s for 16 images acquired. The GD146 PSP gave the most sensitive signal. Figure 9.14 shows a comparison of PSP measurements with pressure tap data along a chord at the spanwise location AB indicated in Fig. 9.13 on the Airbus model at 60 m/s and the angle of attack of 16o. Figure 9.15 shows a similar comparison between PSP and pressure taps for the wing/slat configuration of a swept constant-chord half­wing model at 60 m/s and the angle-of-attack of 16°. The resolution of ACp = 0.02 was achieved on the swept wings at 60 m/s.

Delta Wings, Swept Wings, and Car Models

Delta Wings, Swept Wings, and Car Models

Fig. 9.12. Airbus A340 half model tested with different PSPs. From Engler et al. (2001a)


Delta Wings, Swept Wings, and Car Models

Fig. 9.13. Raw blue image obtained using two separate CCD cameras and a 308-nm lamp for excitation, where the integration time for 16 images was 32 seconds. From Engler et al. (2001a)


Delta Wings, Swept Wings, and Car Models

Fig. 9.14. Comparison of PSP and pressure tap data at 60 m/s and the angle of attack of 16‘ along the line A-B on the Airbus A340 half model. From Engler et al. (2001a)


Delta Wings, Swept Wings, and Car Models

Fig. 9.15. Comparison of PSP and pressure tap data for the wing/slat configuration of a swept constant-chord half-wing model at 60 m/s and the angle of attack of 16o. From Engler et al. (2001a)

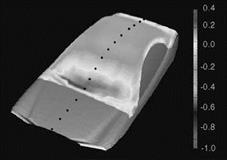
Engler et al. (2001a) and Aider et al. (2001) measured the pressure distributions on car models at low speeds. The models were a Daimler Benz and a PSA Peugeot Citroen (900 mm long, 400 mm wide and 350 mm high). The tests were conducted in the ENSMA’s T4P low-speed wind tunnel at Poitiers in France and in the Daimler Benz wind tunnel at Sindelfingen in Germany. The maximum velocity of these tunnels was 65 m/s and the free-stream turbulence intensity was less than 1%. Figure 9.16 shows typical PSP data mapped onto a CFD grid of the Daimler Benz model, where 64 raw images were averaged to reduce the camera noise. The total time to acquire all the wind-on and wind-off images was longer than one hour since the powerful 308-nm light sources were not available for these tests and a long integration time for the camera was required. Fortunately, the static temperature of flows in the wind tunnels was stable enough such that an error produced by a long-time temperature shift in the tunnels was small. Figure

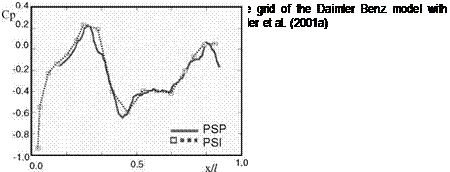
9.17 shows a comparison between PSP and pressure tap data along the centerline of the Daimler Benz model. The absolute pressure accuracy of about 1 mb (0.0145 psi) was achieved after a large number of images were averaged. Figure

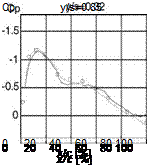
9.18 presents a comparison between PSP and pressure taps on the rear window of the PSA Peugeot Citroen model at 40 m/s along the left-hand sideline A and the centerline C equipped with pressure taps. In this case, the absolute pressure accuracy was better than 1 mb. There was an interesting difference between the pressure distributions along the sideline A and centerline C. There was only one pressure minimum point along the centerline C through the roof/window junction. In contrast, two pressure minimum points existed along the sideline A, which corresponded to the roof/window junction and a vortex system around the car, respectively. PSP was able to visualize the pressure signatures associated with complex flow patterns that were completely missed in pressure tap data such as a pressure peak between the two pressure minimum points along the sideline A.
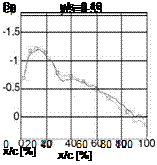
Delta Wings, Swept Wings, and Car ModelsFig. 9.17. The pressure coefficient distribution obtained from PSP compared with pressure tap data at the centerline on the Daimler Benz model at 60 m/s. From Engler et al. (2001a)

1.006

1.004

Подпись: CПодпись: 450Подпись:Delta Wings, Swept Wings, and Car ModelsПодпись: Y7 . 7^. А Г A Подпись:Подпись: 2501.002

1.000

0.998

Подпись: (0 CL

Подпись: Cp
Delta Wings, Swept Wings, and Car Models

0.996

0.994

0.992

0.990

0.988

0.986 200

Fig. 9.18. Comparison of PSP with pressure tap data along the sideline A and centerline C on the rear window of the PSA Peugeot Citroen model at 40 m/s. From Engler et al. (2001a)
Applications of Pressure Sensitive Paint

9.1. Low-Speed Flows

9.1.1. Airfoil Flows

PSP measurements are challenging in low-speed flows where a change in air pressure is very small. The major error sources, notably the temperature effect, image misalignment and CCD camera noise, must be minimized to obtain acceptable quantitative pressure results at low speeds. Brown et al. (1997, 2000) made baseline PSP measurements on a NACA 0012 airfoil at low speeds (less than 50 m/s). The experiments systematically identified the major error sources affecting PSP measurements at low speeds and developed the practical procedures for minimizing these errors. After all efforts were made to reduce the errors, reasonably good pressure results were obtained at speeds as low as 10 m/s.

Brown (2000) conducted three sets of tests (Cases I, II and III) with increasingly improved instrumentation arrangement and data processing. All the tests were made in The NASA Ames Research Test Facility Wind Tunnel having a 12-in high, 12-in wide and 24-in long test section. The Mach number ranged from 0.02 to 0.4. PSP measurements were conducted on an unswept stainless steel NACA 0012 airfoil with a 3-in chord and 9-in span. The airfoil was mounted vertically, and there is a 1.5-in gap between the airfoil’s edges and the top/bottom of the test section. Sixteen mid-span pressure taps (0.048-in diameter) were machined into the upper surface of the airfoil. Each test case was conducted consistently using the same test equipment. Images were obtained using a 14-bit Photometrics CH250 CCD camera with a Melles Griot filter (650+20 nm) attached to a 50-mm Nikor lens. Data were collected on a PC using associated Photometrics imaging software. Two Electrolite UV lamps provided illumination for PSP. Pressure tap measurements were performed with differential pressure meters connected to the airfoil via Tygon tubing. The airfoil was coated with FIB-7 basecoat and PtTFPP/FIB-7 PSP developed by the University of Washington. The white basecoat provided surface scattering to enhance the luminescent emission received by the camera. Application of the basecoat and PSP was performed using a commercial spray air gun. The

basecoat was lightly buffed to reduce surface roughness. The sufficiently thick PSP topcoat applied to the basecoat was insured to be as uniform as possible. After completing the PSP application, a hot-air gun was used to raise pSp above its glass transition temperature of about 70oC. This annealing process reduced the temperature sensitivity of PSP.

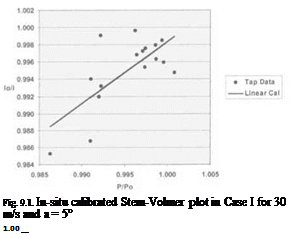
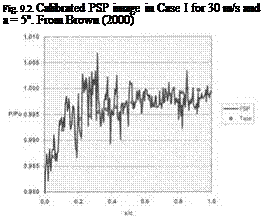
The first set of tests (Case I) provided useful PSP testing experience to identify the potential problems. The airfoil was secured onto the tunnel test section with the angle of attack of 5o. The camera and two UV lamps were secured onto a rigid double U-frame surrounding the test section mounted on the ground floor by bolts, which were approximately 18 inches away from the test section. The camera viewed perpendicularly the airfoil on which ten registration marks were placed for image registration. The total thickness of the basecoat and PSP was about 34 |am and the roughness of PSP was about 2.6 |am. The tests were run at 10, 20, 30, 40 and 50 m/s. For each tunnel run period, the tunnel settling temperature was recorded just priori to and just after image acquisition. The temperature change was within 0.17oC during a single period of image acquisition, depending on the flow velocity. The typical results for a speed of 30 m/s and the angle of attack of 5oare shown in Figs. 9.1-9.3. Figure 9.1 is the in-situ Stern-Volmer plot for PSP obtained using pressure tap data, indicating a large variation and a poor correlation between the luminescent intensity and pressure. The corresponding PSP image is shown in Fig. 9.2, where flow is from left to right. Although the low-pressure region near the leading edge is visible in the PSP image, apparent striation patterns and granular features corrupt the quality of the PSP data. This random spatial noise can be clearly seen in the chordwise pressure distribution at the mid-span, as shown in Fig. 9.3. The PSP data at speeds of 10, 20, 40 and 50 m/s had similar noise patterns.

Several problems were identified that might contribute to the large spatial noise. First, scratches on the tunnel plexiglass wall caused the streaky patterns. Secondly, PSP suffered from a considerable thickness variation due to poor application of the paint. The effect of the surface roughness could not be completely corrected using the image registration technique for the non-aligned wind-off and wind-on images. The third problem was related to model motion with respect to the lamps. Since the lamps were fixed on the ground floor, the test section underwent a lateral oscillation estimated to be on the order of 10 Hz relative to the lamps. If the model moved in a non-homogenous illumination field, the effect of the motion could not be corrected using the image registration technique. Also, this problem exaggerated the second problem associated with the surface roughness. Note that these problems might not be serious for PSP measurements in high subsonic, transonic and supersonic flows.

In Case II tests, a new test section plexiglass wall was installed to replace the scratched one. The model was cleaned and repainted carefully; thus, the roughness of the PSP layer was reduced to 0.89 |am from 2.6 |am in Case I. In order to reduce the relative motion between the model and lamps, a new mounting structure for the camera and lamps was designed and constructed, which was secured to the test section rather than the ground floor. Therefore, the lateral and vertical shifts in the image plane due to the motion were reduced to 0.43 and 0 pixels from 2.41 and 1.9 pixels in Case I, respectively. In addition, to reduce the

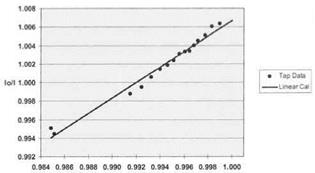
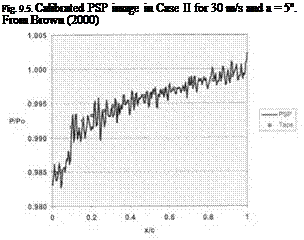
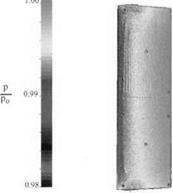
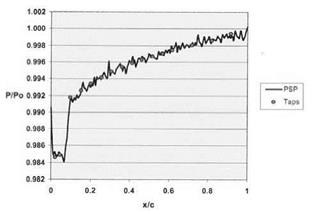
temperature change between the wind-off and wind-on images, the experimental procedure was revised such that the tunnel was run for one hour and the wind-off image was taken immediately after the wind-on image. In this way, the temperature distribution on the model in the wind-off case was close to that in the wind-on case. Figures 9.4-9.6 show results obtained in Case II tests for a speed of 30 m/s and the angle of attack of 5o. The in-situ Stern-Volmer plot in Fig. 9.4 has a better linearity and an improved correlation with the pressure tap data. The PSP image in Fig. 9.5 is also considerably improved, clearly showing not only a correct chordwise pressure profile, but also the 3D effect near the airfoil edges. The pressure tap gutter lines are also visible in the image since the gutter line epoxy has a different thermal conductivity from the stainless steel such that a small temperature difference exists. As shown in Fig. 9.6, the chordwise pressure distribution at the mid-span clearly shows a reduced noise level compared to the corresponding result in Case I.

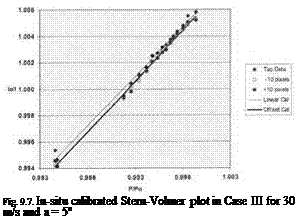
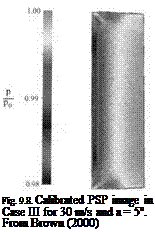
In Case III tests, careful application of PSP led to a further reduction of the paint roughness to 0.46 pm. To increase the statistical redundancy in image registration, all 16 pressure taps were used in images as registration marks, in addition to the original eight registration marks applied to the paint surface. For better in-situ calibration of PSP, 32 ‘virtual pressure taps’ located at 10 pixels above and below the spanwise location of the actual taps were created and used in images under the assumption of two-dimensionality of flows near the mid-span. As shown in Fig. 9.7, it was found that the use of the additional virtual taps provided an accuracy of 10% better than that achieved by using the actual taps only in least-squares estimation for in-situ calibration. The results of Case III tests are shown in Figs. 9.7-9.9 for a speed of 30 m/s and the angle of attack of 5o. Overall, the results indicate the improved quality of the PSP data and a reduced noise level compared to Case II.

The valuable lessons learned from this study of low-speed PSP measurements are summarized as follows. (1) Vibration and model movement with respect to cameras and lamps must be minimized to reduce the image registration error. (2) The temperature-induced errors must be minimized. Not only the tunnel test section, but also the model surface should reach a stable equilibrium state of temperature priori to acquisition of the wind-on images. It is highly suggested that the wind-off image should be acquired immediately after the corresponding wind – on image as soon as the tunnel is shut down. (3) The quality of application of both the basecoat and PSP topcoat to a surface is critical and the paint roughness must be minimized to obtain good results at low speeds. (4) In-situ PSP calibration utilizing a sufficient number of pressure taps is required to eliminate the systematic errors and obtain quantitative results. (5) Image registration is critical to reduce the spatial noise. (6) Scientific-grade CCD cameras (14 and 16 bits) should be used, and averaging a large number of images should be performed to reduce the photon shot noise and other random noises. Note that some of the above procedures for controlling the error sources are not generally applicable to large production wind tunnels.

Applications of Pressure Sensitive Paint

Подпись: Fig. 9.1. In-situ calibrated Stem-Volmer plot in Case I for 30 m/s and a = 5° 1.00 _ Подпись:

Applications of Pressure Sensitive Paint

Подпись: Fig. 9.5. Calibrated PSP image in Case II for 30 m/s and a = 5o. From Brown (2000)

Applications of Pressure Sensitive Paint

Fig. 9.4. In-situ calibrated Stern-Volmer plot in Case II for 30 m/s and a = 5o

Applications of Pressure Sensitive Paint

Подпись: Fig. 9.7. In-situ calibrated Stern-Volmer plot in Case III for 30 m/s and a = 5o
Подпись: Fig. 9.8. Calibrated PSP image in Case III for 30 m/s and a = 5o. From Brown (2000)

Step-Like Jet Impingement Cooling

Sudden fluid jet impingement to TSP coated on a hot body, which produces a rapid decrease of the surface temperature, can be used for testing the time response of TSP. A lumped heat transfer model gives an approximate solution for a temporal evolution of the temperature on a paint layer during step jet impingement cooling

Подпись: minПодпись: exp( -1/T3 ) ,Step-Like Jet Impingement Cooling(8.37)

where Tin is the initial temperature of the paint and Tmin is the minimum

temperature of the paint that is asymptotically reached as t The timescale

for this cooling process is t3 = kh/( aThc), where hc is the average heat transfer coefficient of the impinging jet and h is the paint thickness.

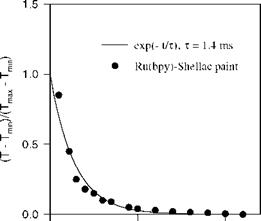
Figure 8.18 shows an experimental setup for step jet impingement cooling. A 475-nm blue laser beam was used for illumination at the impingement point. The luminescent intensity was measured using a PMT and then was converted into temperature using a priori calibration relation. To achieve a small response time, a sub-zero temperature impinging Freon jet generated by a Freeze-it® sprayer was utilized, where a mechanical camera shutter was used as a valve to control issuing of the jet. After the shutter opened within 1 ms, the Freon jet impinged on the surface of a hot soldering iron (about 100oC) which was coated with a 19-|jm thick Ru(bpy)-Shellac TSP. Figure 8.19 shows a rapid decrease of the surface temperature on the thin paint coating to the minimum temperature of about 44oC. The measured timescale t3 of TSP for this cooling process was 1.4 ms. Cool air impingement jet was also tested; the measured timescales were 16 ms and 25 ms for 19 |jm and 38 |jm thick Ru(bpy)-Shellac TSP coatings, respectively.

Hot body

Подпись: paint . 457 nm blue beam Step-Like Jet Impingement Coolingjet

Argon laser for illumination

Fig. 8.18. Schematic of a step-like jet impingement cooling setup for testing TSP time response

Step-Like Jet Impingement Cooling

0 5 10

Time (ms)

Fig. 8.19. Temperature response of Ru(bpy)-Shellac TSP to step-like Freon jet impingement cooling

Pulse Laser Heating on Thin Metal Film

We consider short-pulse laser heating on a thin metal film to determine the thermal diffusion timescale of TSP applied to the film. The heat conduction equation for this problem is

da

— = aT V2a, (8.28)

dt T

where a = T – Tin is a temperature change of the film from an initial temperature Tn and aT is the thermal diffusivity of the metal film. The Lapalce operator in Eq. (8.28) is defined as V2 = d2 /dr2 + r ]d/dr + d2 /d z2, where r is the radial distance from the center of a hot spot heated by a laser and z is the coordinate normal to the metal film directing from the heated side to other side. The initial temperature Tn is assumed to be the ambient temperature. After heated by a laser pulse, the film is cooled down due to natural convection on both the sides of the metal film. When the surface temperature of the metal film decreases fast enough along the radial direction from the center of the hot spot (i. e., rd 0 as r ^), we introduce a spatially averaging operator

Pulse Laser Heating on Thin Metal Film

<a> 2 = — Г rd dr, (8.29)

Pulse Laser Heating on Thin Metal Film Подпись: PlaSer$(t)-hc <a>2(0,t) Подпись: (8.31)

Подпись: -k

Подпись: д <d>2 (ym,t) д z
Подпись: hc <a> 2 ( П m, t)

The initial and boundary conditions for Eq. (8.30) are <a>2 (z,0)= 0,

where hc is the average heat transfer coefficient of natural convection, k is the thermal conductivity, S(t) is the Dirac-delta function, nm is the metal film thickness, and Paser represents the strength of the pulse-laser heat source. There are two physical processes involved: rapid heating of the film by the laser pulse and relatively slow cooling process due to natural convection. At the beginning, since the film is heated in a very short time interval, the natural convection terms in the boundary conditions can be neglected; thus, the problem is simplified for the rapid heating process. For a thin metal film (nm << 1), application of the Laplace transform 0(z, s) = La(<Є>2) to Eqs. (8.30) and (8.31) yields

Pulse Laser Heating on Thin Metal Film

(8.32)

where s is the complex variable in the Laplace transform. The inverse Laplace transform leads to an asymptotic expression for the laser heating when t is small

< в >2 = P‘aseraT erfc(Jt1 /t). (8.33)

кП m

The characteristic timescale for the laser heating is t1 = n2m /(4aT ).

For the slow cooling process due to natural convection after the pulse-laser heat source ceases, we introduce an additional average operator across the metal film

1 rnm

<в>3 =— І <в>2dz. (8.34)

Vm J°

Applying the operator Eq. (8.34) to Eq. (8.30) leads to a simple lumped model for the cooling process

d < в >3 =- < в > 3 +aTpaser S(t). (8.35)

dt dmk k dm

The solution to Eq. (8.35) is

P a

<e> = laser T exp( – 2t/t2) . (8.36)

kn m

Eq. (8.36) describes an exponential decay of the averaged temperature, which gives the characteristic timescale t2 = knm /(2aT hc) for the cooling process due to natural convection.

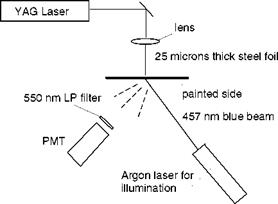
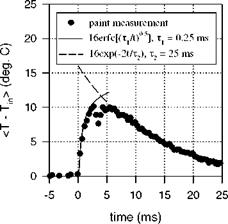
Obviously, for the problem of pulse laser heating on a thin film, there are the fast timescale t1 = nm /(4aT ) and slow timescale t2 = knm /(2aT hc). The time response of Ru(bpy)-Shellac TSP to a rapid temperature rise was tested by utilizing short pulse laser heating on a 25-|jm thick steel film. Figure 8.16 is a schematic of the experimental set-up. One side of the steel film was heated by a pulse laser beam with a 8-ns duration from a Nd:YAG laser (532 nm at an 800-mJ maximum output) through a focusing lens. The opposite side of the steel film was coated with a 10-|jm thick Ru(bpy)-Shellac TSP illuminated by a 457-nm blue beam from a 1-mW Argon laser at the hot spot. The response of the luminescent emission from TSP to pulse laser heating was detected using a PMT, and the signal was acquired using an oscilloscope (Tektronix TDS 420). The surface temperature was calculated from the luminescent intensity using a priori calibration relation for TSP. Figure 8.17 shows a typical transient response of the surface temperature to pulse laser heating on the steel film. The surface
temperature increases rapidly after heating at the film and then decays due to natural convection. To estimate the response times, the asymptotic solutions Eq.

(8.32) and Eq. (8.36) were used to fit the experimental data. The response time of TSP for the laser heating process was t1 = 0.25 ms, while the time constant for the cooling process by natural convection was t2 = 12.5 ms.

532 nm pulse green beam

Pulse Laser Heating on Thin Metal Film

Fig. 8.16. Schematic of a pulse laser heating setup for testing TSP time response. From Liu et al. (1997b)

Pulse Laser Heating on Thin Metal Film

Fig. 8.17. Temperature response of Ru(bpy)-Shellac TSP to pulse laser heating on a steel foil. From Liu et al. (1997b)

Time Response of Temperature Sensitive Paint

Similar to PSP, TSP has two characteristic timescales: the luminescent lifetime and the thermal diffusion timescale. The luminescent lifetimes of EuTTA-dope and Ru(bpy)-Shellac TSPs at room temperature are about 0.5 ms and 5 ps, respectively. The time response of EuTTA-dope TSP is intrinsically limited by its long luminescent lifetime, while Ru(bpy)-Shellac TSP has a much shorter luminescent lifetime. Overall, the time response of TSP is strongly dependent upon the boundary conditions of heat transfer in a specific application. Based on the transient solution of the heat conduction equation, the thermal diffusion time for a thin TSP coating is in the order of h2 /aT, where h is the coating thickness and aT is the thermal diffusivity of TSP. In a convection-dominated case, the thermal diffusion time can also be expressed as hk/ aT hc, where k is the thermal

conductivity and hc is the convective heat transfer coefficient. In general, the thermal diffusion time is much larger than the luminescent lifetime for many TSP formulations, and therefore thermal diffusion limits the time response of TSP. In contrast to PSP where oxygen diffusion always obeys the no-flux condition at a solid boundary, heat transfer to the substrate through a non-adiabatic wall inevitably affects the thermal time response of TSP in actual experiments. Hence, the timescale of TSP depends on not only the thermal conductivity of the paint itself, but also the boundary conditions in a specific heat transfer problem for TSP application. To measure the time response of TSP to a rapid change of temperature, Liu et al. (1995c) conducted experiments of pulse laser heating on a metal film and step-like jet impingement cooling.