Category Fundamentals of Aerodynamics

Historical Note: d’Alembert and His Paradox

You can well imagine the frustration that Jean le Rond d’Alembert felt in 1744 when, in a paper entitled “Traite de l’equilibre et des mouvements de fluids pour servir de siute au traite de dynamique,” he obtained the result of zero drag for the inviscid, incompressible flow over a closed two-dimensional body. Using different approaches, d’Alembert encountered this result again in 1752 in his paper entitled “Essai sur la resistance” and again in 1768 in his “Opuscules mathematiques.” In this last paper can be found the quote given at the beginning of Chapter 15; in essence, he had given up trying to explain the cause of this paradox. Even though the prediction of fluid – dynamic drag was a very important problem in d’Alembert’s time, and in spite of the number of great minds that addressed it, the fact that viscosity is responsible for drag was not appreciated. Instead, d’Alembert’s analyses used momentum principles in a frictionless flow, and quite naturally he found that the flow field closed smoothly around the downstream portion of the bodies, resulting in zero drag. Who was this man, d’Alembert? Considering the role his paradox played in the development of fluid dynamics, it is worth our time to take a closer look at the man himself.

d’Alembert was born illegitimately in Paris on November 17, 1717. His mother was Madame De Tenun, a famous salon hostess of that time, and his father was Cheva­lier Destouches-Canon, a cavalry officer. d’Alembert was immediately abandoned by his mother (she was an ex-nun who was afraid of being forcibly returned to the convent). However, his father quickly arranged for a home for d’Alembert—with a family of modest means named Rousseau. d’Alembert lived with this family for the next 47 years. Under the support of his father, d’Alembert was educated at the College de Quatre-Nations, where he studied law and medicine, and later turned to

mathematics. For the remainder of his life, d’Alembert would consider himself a mathematician. By a program of self-study, d’Alembert learned the works of Newton and the Bernoullis. His early mathematics caught the attention of the Paris Academy of Sciences, of which he became a member in 1741. d’Alembert published frequently and sometimes rather hastily, in order to be in print before his competition. However, he made substantial contributions to the science of his time. For example, he was (1) the first to formulate the wave equation of classical physics, (2) the first to express the concept of a partial differential equation, (3) the first to solve a partial differential equation—he used separation of variables—and (4) the first to express the differential equations of fluid dynamics in terms of a field. His contemporary, Leonhard Euler (see Sections 1.1 and 3.18) later expanded greatly on these equations and was responsible for developing them into a truly rational approach for fluid-dynamic analysis.

During the course of his life, d’Alembert became interested in many scientific and mathematical subjects, including vibrations, wave motion, and celestial mechanics. In the 1750s, he had the honored position of science editor for the Encyclopedia— a major French intellectual endeavor of the eighteenth century which attempted to compile all existing knowledge into a large series of books. As he grew older, he also wrote papers on nonscientific subjects, mainly musical structure, law, and religion.

In 1765, d’Alembert became very ill. He was helped to recover by the nursing of Mile. Julie de Lespinasse, the woman who was d’Alembert’s only love throughout his life. Although he never married, d’Alembert lived with Julie de Lespinasse until she died in 1776. d’Alembert had always been a charming gentleman, renowned for his intelligence, gaiety, and considerable conversational ability. However, after Mile, de Lespinasse’s death, he became frustrated and morose—living a life of despair. He died in this condition on October 29, 1783, in Paris.

d’Alembert was one of the great mathematicians and physicists of the eighteenth century. He maintained active communications and dialogue with both Bernoulli and Euler and ranks with them as one of the founders of modem fluid dynamics. This, then, is the man behind the paradox, which has existed as an integral part of fluid dynamics for the past two centuries.

General Three-Dimensional Flows: Panel Techniques

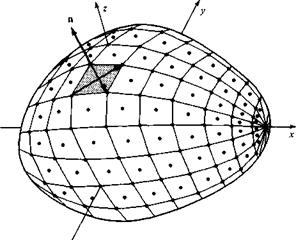
In modem aerodynamic applications, three-dimensional, inviscid, incompressible flows are almost always calculated by means of numerical panel techniques. The philosophy of the two-dimensional panel methods discussed in previous chapters is readily extended to three dimensions. The details are beyond the scope of this book—indeed, there are dozens of different variations, and the resulting computer programs are frequently long and sophisticated. However, the general idea behind all such panel programs is to cover the three-dimensional body with panels over which there is an unknown distribution of singularities (such as point sources, doublets, or vortices). Such paneling is illustrated in Figure 6.7. These unknowns are solved through a system of simultaneous linear algebraic equations generated by calculating the induced velocity at control points on the panels and applying the flow-tangency

image479

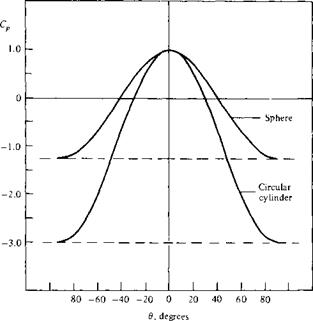
Figure 6.6 The pressure distribution over the surface of a sphere and a cylinder. Illustration of the three-dimensional relieving effect.

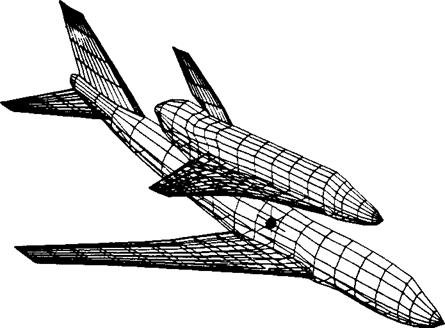
condition. For a nonlifting body such as illustrated in Figure 6.7, a distribution of source panels is sufficient. However, for a lifting body, both source and vortex panels (or their equivalent) are necessary. A striking example of the extent to which panel methods are now used for three-dimensional lifting bodies is shown in Figure 6.8, which illustrates the paneling used for calculations made by the Boeing Company of the potential flow over a Boeing 747-space shuttle piggyback combination. Such applications are very impressive; moreover, they have become an industry standard and are today used routinely as part of the airplane design process by the major aircraft companies.

Examining Figures 6.7 and 6.8, one aspect stands out, namely, the geometric complexity of distributing panels over the three-dimensional bodies. How do you get the computer to “see” the precise shape of the body? How do you distribute the panels over the body; that is, do you put more at the wing leading edges and less on the fuselage, etc.? How many panels do you use? These are all nontrivial questions. It is not unusual for an aerodynamicist to spend weeks or even a few months determining the best geometric distribution of panels over a complex body.

We end this chapter on the following note. From the time they were introduced in the 1960s, panel techniques have revolutionized the calculation of three-dimensional potential flows. However, no matter how complex the application of these methods may be, the techniques are still based on the fundamentals we have discussed in this

image480

Figure 6.7 Distribution of three-dimensional source panels over a general nonlifting body (Reference 14). (Courtesy of the McDonnell-Douglas Corp.)


image481

Figure 6.8


Panel distribution for the analysis of the Boeing 747 carrying the space shuttle orbiter. (Courtesy of the Boeing Airplane Company.)

and all the preceding chapters. You are encouraged to pursue these matters further by reading the literature, particularly as it appears in such journals as the Journal of Aircraft and the AIAA Journal.

Historical Note: The Illusive Center of Pressure

The center of pressure of an airfoil was an important matter during the development of aeronautics. It was recognized in the nineteenth century that, for a heavier-than – air machine to fly at stable, equilibrium conditions (e. g., straight-and-level flight), the moment about the vehicle’s center of gravity must be zero (see Chapter 7 of Reference 2). The wing lift acting at the center of pressure, which is generally a distance away from the center of gravity, contributes substantially to this moment. Hence, the understanding and prediction of the center of pressure was felt to be absolutely necessary in order to design a vehicle with proper equilibrium. On the other hand, the early experimenters had difficulty measuring the center of pressure, and much confusion reigned. Let us examine this matter further.

The first experiments to investigate the center of pressure of a lifting surface were conducted by the Englishman George Cayley (1773-1857) in 1808. Cayley was the inventor of the modem concept of the airplane, namely, a vehicle with fixed wings, a fuselage, and a tail. He was the first to separate conceptually the functions of lift and propulsion; prior to Cayley, much thought had gone into omithopters—machines that flapped their wings for both lift and thrust. Cayley rejected this idea, and in 1799, on a silver disk now in the collection of the Science Museum in London, he inscribed a sketch of a rudimentary airplane with all the basic elements we recognize

today. Cayley was an active, inventive, and long-lived man, who conducted numerous pioneering aerodynamic experiments and fervently believed that powered, heavier – than-air, manned flight was inevitable. (See Chapter 1 of Reference 2 for an extensive discussion of Cayley’s contributions to aeronautics.)

In 1808, Cayley reported on experiments of a winged model which he tested as a glider and as a kite. His comments on the center of pressure are as follows:

By an experiment made with a large kite formed of an hexagon with wings extended from it, all so constructed as to present a hollow curve to the current, I found that when loaded nearly to 1 lb to a foot and 1/2, it required the center of gravity to be suspended so as to leave the anterior and posterior portions of the surface in the ratio of 3 to 7. But as this included the tail operating with a double leverage behind, I think such hollow surfaces relieve about an equal pressure on each part, when they are divided in the ratio of 5 to 12, 5 being the anterior portion. It is really surprising to find so great a difference, and it obliges the center of gravity of flying machines to be much forwarder of the center of bulk (the centroid) than could be supposed a priori.

Here, Cayley is saying that the center of pressure is 5 units from the leading edge and 12 units from the trailing edge; i. e., xcp = 5/1 7c. Later, he states in addition: “I tried a small square sail in one plane, with the weight nearly the same, and I could not perceive that the center-of-resistance differed from the center of bulk.” That is, Cayley is stating that the center of pressure in this case is 1 /2c.

There is no indication from Cayley’s notes that he recognized that center of pressure moves when the lift, or angle of attack, is changed. However, there is no doubt that he was clearly concerned with the location of the center of pressure and its effect on aircraft stability.

The center of pressure on a flat surface inclined at a small angle to the flow was studied by Samuel R Langley during the period 1887-1896. Langley was the secretary of the Smithsonian at that time, and devoted virtually all his time and much of the Smithsonian’s resources to the advancement of powered flight. Langley was a highly respected physicist and astronomer, and he approached the problem of powered flight with the systematic and structured mind of a scientist. Using a whirling arm apparatus as well as scores of rubber-band powered models, he collected a large bulk of aerodynamic information with which he subsequently designed a full-scale aircraft. The efforts of Langley to build and fly a successful airplane resulted in two dismal failures in which his machine fell into the Potomac River—the last attempt being just 9 days before the Wright brothers’ historic first flight on December 17, 1903. In spite of these failures, the work of Langley helped in many ways to advance powered flight. (See Chapter 1 of Reference 2 for more details.)

Langley’s observations on the center of pressure for a flat surface inclined to the flow are found in the Langley Memoir on Mechanical Flight, Part I, 1887 to 1896, by Samuel P. Langley, and published by the Smithsonian Institution in 1911—5 years after Langley’s death. In this paper, Langley states:

The center-of-pressure in an advancing plane in soaring flight is always in advance of the center of figure, and moves forward as the angle-of-inclination of the sustaining

surfaces diminishes, and, to a less extent, as horizontal flight increases in velocity. These facts furnish the elementary ideas necessary in discussing the problem of equilibrium, whose solution is of the most vital importance to successful flight.

The solution would be comparatively simple if the position of the center-of- pressure could be accurately known beforehand, but how difficult the solution is may be realized from a consideration of one of the facts just stated, namely, that the position of the center-of – pressure in horizontal flight shifts with velocity of the flight itself.

Here, we see that Langley is fully aware that the center of pressure moves over a lifting surface, but that its location is hard to pin down. Also, he notes the correct variation for a flat plate, namely, xcp moves forward as the angle of attack decreases. However, he is puzzled by the behavior of xcp for a curved (cambered) airfoil. In his own words:

Later experiments conducted under my direction indicate that upon the curved sur­faces I employed, the center-of-pressure moves forward with an increase in the angle of elevation, and backward with a decrease, so that it may lie even behind the center of the surface. Since for some surfaces the center-of-pressure moves backward, and for others forward, it would seem that there might be some other surface for which it will be fixed.

Here, Langley is noting the totally opposite behavior of the travel of the center of pressure on a cambered airfoil in comparison to a flat surface, and is indicating ever so slightly some of his frustration in not being able to explain his results in a rational scientific way.

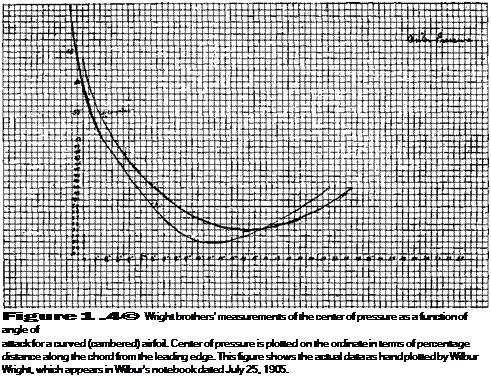
Three-hundred-fifty miles to the west of Langley, in Dayton, Ohio, Orville and Wilbur Wright were also experimenting with airfoils. As described in Section 1.1, the Wrights had constructed a small wind tunnel in their bicycle shop with which they conducted aerodynamic tests on hundreds of different airfoil and wing shapes during the fall, winter, and spring of 1901-1902. Clearly, the Wrights had an appreciation of the center of pressure, and their successful airfoil design used on the 1903 Wright Flyer is a testimonial to their mastery of the problem. Interestingly enough, in the written correspondence of the Wright brothers, only one set of results for the center of pressure can be found. This appears in Wilbur’s notebook, dated July 25, 1905, in the form of a table and a graph. The graph is shown in Figure 1.49—the original form as plotted by Wilbur. Here, the center of pressure, given in terms of the percentage of distance from the leading edge, is plotted versus angle of attack. The data for two airfoils are given, one with large curvature (maximum height to chord ratio = 1/12) and one with more moderate curvature (maximum height to chord ratio = 1/20). These results show the now familiar travel of the center of pressure for a curved airfoil, namely, xcp moves forward as the angle of attack is increased, at least for small to moderate values of a. However, the most forward excursion of xcp in Figure 1.49 is 33 percent behind the leading edge—the center of pressure is always behind the quarter-chord point.

The first practical airfoil theory, valid for thin airfoils, was developed by Ludwig Prandtl and his colleagues at Gottingen, Germany, during the period just prior to and

Подпись: Figure 1 .4© Wright brothers' measurements of the center of pressure as a function of angle of attack for a curved (cambered) airfoil. Center of pressure is plotted on the ordinate in terms of percentage distance along the chord from the leading edge. This figure shows the actual data as hand plotted by Wilbur Wright, which appears in Wilbur's notebook dated July 25, 1905.

during World War I. This thin airfoil theory is described in detail in Chapter 4. The result for the center of pressure for a curved (cambered) airfoil is given by Equation

(4.66) , and shows that xcp moves forward as the angle of attack (hence q) increases, and that it is always behind the quarter-chord point for finite, positive values of q. This theory, in concert with more sophisticated wind-tunnel measurements that were being made during the period 1915-1925, finally brought the understanding and prediction of the location of the center of pressure for a cambered airfoil well into focus.

Because л:ср makes such a large excursion over the airfoil as the angle of attack is varied, its importance as a basic and practical airfoil property has diminished. Beginning in the early 1930s, the National Advisory Committee for Aeronautics (NACA), at its Langley Memorial Aeronautical Laboratory in Virginia, measured the properties of several systematically designed families of airfoils—airfoils which became a standard in aeronautical engineering. These NACA airfoils are discussed in Sections 4.2 and 4.3. Instead of giving the airfoil data in terms of lift, drag, and center of pressure, the NACA chose the alternate systems of reporting lift, drag, and moments about either the quarter-chord point or the aerodynamic center. These are totally appropriate alternative methods of defining the force-and-moment system on an airfoil, as discussed in Section 1.6 and illustrated in Figure 1.19. As a result, the

center of pressure is rarely given as part of modem airfoil data. On the other hand, for three-dimensional bodies, such as slender projectiles and missiles, the location of the center of pressure still remains an important quantity, and modem missile data frequently include xcp. Therefore, a consideration of center of pressure still retains its importance when viewed over the whole spectmm of flight vehicles.

The Bigger Picture

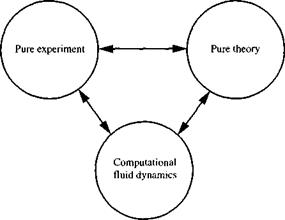
The evolution of our intellectual understanding of aerodynamics is over 2500 years old, going all the way back to ancient Greek science. The aerodynamics you are studying in this book is the product of this evolution. (See Reference 62 for an in­depth study of the history of aerodynamics.) Relevant to our current discussion is the development of the experimental tradition in fluid dynamics, which took place in the middle of the seventeenth century, principally in France, and the introduction of rational analysis in mechanics pioneered by Isaac Newton towards the end of the same century. Since that time, up until the middle of the twentieth century, the study and practice of fluid dynamics, including aerodynamics, has dealt with pure experiment on one hand and pure theory on the other. If you were learning aerodynamics as recently as, say 1960, you would have been operating in the “two-approach world” of theory and experiment. However, computational fluid dynamics has revolutionized the way we study and practice aerodynamics today. As sketched in Figure 2.44, CFD is today an equal partner with pure theory and pure experiment in the analysis and solution of aerodynamic problems. This is no flash in the pan—CFD will continue to play this role indefinitely, for as long as our advanced human civilization exists. Also, the double arrows in Figure 2.44 imply that today each of the equal partners constantly interact with each other—they do not stand alone, but rather help each other to continue to resolve and better understand the “big picture” of aerodynamics.

image187

Figure 2.44 The three equal partners of modern aerodynamics.

2.18 Summary

Return to the road map for this chapter, as given in Figure 2.1. We have now covered both the left and right branches of this map and are ready to launch into the solution of practical aerodynamic problems in subsequent chapters. Look at each block in Figure 2.1; let your mind flash over the important equations and concepts represented by each block. If the flashes are dim, return to the appropriate sections of this chapter and review the material until you feel comfortable with these aerodynamic tools.

For your convenience, the most important results are summarized below:

Design Box   The result of Example 4.3 shows that the aerodynamic center for the NACA 23012 airfoil is located ahead of, but very close to, the quarter-chord point. For some other families of airfoils, the aerodynamic center is located behind, but similarly close to, the quarter-chord point. For a given airfoil family, the location of the aerodynamic center depends on the airfoil thickness, as shown in Figure 4.25. The variation of xac with thickness for the NACA 230XX family is given in Figure 4.25a. Here, the aerodynamic center is ahead of the quarter-chord point, and becomes progressively farther ahead as the airfoil thickness is increased. In contrast, the variation of iac with thickness for the NACA 64-2XX family is given in Figure 4.25b. Here, the aerodynamic center is behind the quarter-chord point, and becomes progressively farther behind as the airfoil thickness is increased. From the point of view of purely aerodynamics, the existence of the aerodynamic center is interesting, but the specification of the force and moment system on the airfoil by placing the lift and drag at the aerodynamic center and giving the value of M’c as illustrated in Figure 4.23, is not more useful than placing the lift and drag at any other point on the airfoil and giving the value of M’ at that point, such as shown in Figure 1.19. However, in flight   0 4 8 12 16 20 24 Airfoil thickness, percent of chord (a) NACA 230XX Airfoil   0 4 8 12 16 20 24 Airfoil thickness, percent of chord (b) NACA 64-2XX Airfoil Figure 4.35 Variation of the location of the aerodynamic center with airfoil thickness, (a) NACA 230XX airfoil, (b) NACA 64-2XX airfoil.   (continued) &nbsp

Some Aspects of Supersonic Flow: Shock Waves

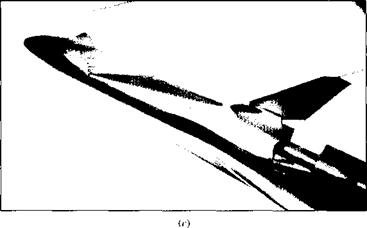
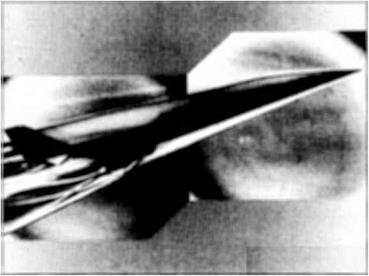
Return to the different regimes of flow sketched in Figure 1.37. Note that subsonic compressible flow is qualitatively (but not quantitatively) the same as incompressible flow; Figure 1.37a shows a subsonic flow with a smoothly varying streamline pattern, where the flow far ahead of the body is forewarned about the presence of the body and begins to adjust accordingly. In contrast, supersonic flow is quite different, as sketched in Figure 1.37<i and e. Here, the flow is dominated by shock waves, and the flow upstream of the body does not know about the presence of the body until it encounters the leading-edge shock wave. In fact, any flow with a supersonic region, such as those sketched in Figure 1.37ft to e, is subject to shock waves. Thus, an essential ingredient of a study of supersonic flow is the calculation of the shape and strength of shock waves. This is the main thrust of Chapters 8 and 9.

A shock wave is an extremely thin region, typically on the order of 1СГ5 cm, across which the flow properties can change drastically. The shock wave is usually at an oblique angle to the flow, such as sketched in Figure 7.5a; however, there are many cases where we are interested in a shock wave normal to the flow, as sketched in Figure 7.5b. Normal shock waves are discussed at length in Chapter 8, whereas oblique shocks are considered in Chapter 9. In both cases, the shock wave is an almost explosive compression process, where the pressure increases almost discontinuously across the wave. Examine Figure 7.5 closely. In region 1 ahead of the shock, the Mach number, flow velocity, pressure, density, temperature, entropy, total pressure, and total enthalpy are denoted by p, p,T, s, ро. ь and /год, respectively.

The analogous quantities in region 2 behind the shock are М2, V2, pi, Pi> Ti, si, po,2> and /го,2, respectively. The qualitative change across the wave are noted in Figure 7.5. The pressure, density, temperature, and entropy increase across the shock, whereas the total pressure, Mach number, and velocity decrease. Physically, the flow across a shock wave is adiabatic (we are not heating the gas with a laser beam or cooling it in a refrigerator, for example). Therefore, recalling the discussion in Section 7.5, the total enthalpy is constant across the wave. In both the oblique shock and normal shock cases, the flow ahead of the shock wave must be supersonic (i. e., Mx > 1). Behind the oblique shock, the flow usually remains supersonic (i. e., М2 > 1), but at a reduced Mach number (i. e., М2 < M). However, as discussed in Chapter 9, there are special cases where the oblique shock is strong enough to decelerate the downstream flow to a subsonic Mach number; hence, M2 < 1 can occur behind an oblique shock. For the

Some Aspects of Supersonic Flow: Shock Waves

Some Aspects of Supersonic Flow: Shock Waves

image517

image519

image520

(d)

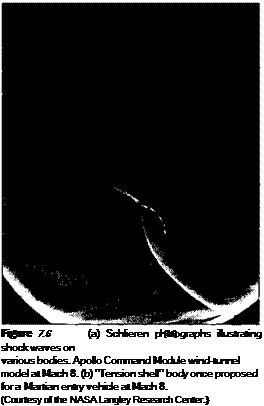
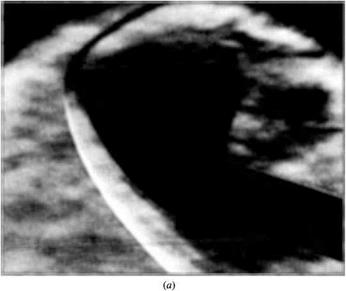
Figure 7.6 (continued) (c) Space Shuttle Orbiter model at Mach 6. This photo also shows regions of high aerodynamic heating on the model surface by means of the visible phase-change paint pattern, (c/) A conceptual hypersonic aircraft at Mach 6. (Courtesy of the NASA Langley Research Center.)

In summary, compressible flows introduce some very exciting physical phenom­ena into our aerodynamic studies. Moreover, as the flow changes from subsonic to supersonic, the complete nature of the flow changes, not the least of which is the occurrence of shock waves. The purpose of the next seven chapters is to describe and analyze these flows.

Molecular Approach

In actuality, of course, the motion of a fluid is a ramification of the mean motion of its atoms and molecules. Therefore, a third model of the flow can be a microscopic approach wherein the fundamental laws of nature are applied directly to the atoms and molecules, using suitable statistical averaging to define the resulting fluid properties. This approach is in the purview of kinetic theory, which is a very elegant method with many advantages in the long run. However, it is beyond the scope of the present book.

In summary, although many variations on the theme can be found in different texts for the derivation of the general equations of fluid flow, the flow model can usually be categorized under one of the approaches described above.

2.3.2 Physical Meaning of the Divergence of Velocity

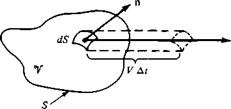
In the equations to follow, the divergence of velocity, V • V, occurs frequently. Before leaving this section, let us prove the statement made earlier (Section 2.2) that V • V is physically the time rate of change of the volume of a moving fluid element of fixed mass per unit volume of that element. Consider a control volume moving with the fluid (the case shown on the right of Figure 2.11). This control volume is always made up of the same fluid particles as it moves with the flow; hence, its mass is fixed, invariant with time. However, its volume V and control surface S are changing with time as it moves to different regions of the flow where different values of p exist. That is, this moving control volume of fixed mass is constantly increasing or decreasing its volume and is changing its shape, depending on the characteristics of the flow. This control volume is shown in Figure 2.13 at some instant in time. Consider an infinitesimal element of the surface d S moving at the local velocity V, as shown in Figure 2.13. The change in the volume of the control volume AV, due to just the

image110

Figure 2.1 3 Moving control volume used for the physical interpretation of the divergence of velocity.


movement of dS over a time increment At, is, from Figure 2.13, equal to the volume of the long, thin cylinder with base area dS and altitude (V At) • n; i. e.,

ДУ = [(VAf) • n]dS = (VAt) ■ dS [2.28]

Over the time increment At, the total change in volume of the whole control volume is equal to the summation of Equation (2.28) over the total control surface. In the limit as dS —>■ 0, the sum becomes the surface integral

(VAt) • dS

Подпись: DV ~Dt Molecular Approach Подпись: [2.29]

If this integral is divided by At, the result is physically the time rate of change of the control volume, denoted by DV/Df, i. e.,

(The significance of the notation D/Dt is revealed in Section 2.9.) Applying the divergence theorem, Equation (2.26), to the right side of Equation (2.29), we have

^ – V)dV [2.30]

v

Now let us imagine that the moving control volume in Figure 2.13 is shrunk to a very small volume 8V, essentially becoming an infinitesimal moving fluid element as sketched on the right of Figure 2.12. Then Equation (2.30) can be written as

sv

Assume that 8 V is small enough such that V • V is essentially the same value through­out (5 V. Then the integral in Equation (2.31) can be approximated as (V • V)i5V. From

Equation (2.31), we have


Подпись: D(SV) Dt

Подпись: or Подпись: V Подпись: 1 £>(<5V) SV Dt Подпись: [2.32]

= (V • V)5V

Examine Equation (2.32). It states that V • V is physically the time rate of change of the volume of a moving fluid element, per unit volume. Hence, the interpretation of V • V, first given in Section 2.2.6, Divergence of a Vector Field, is now proved.

Source Flow: Our Second Elementary Flow

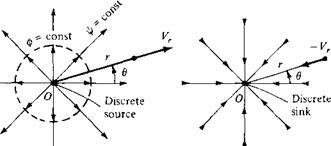
Consider a two-dimensional, incompressible flow where all the streamlines are straight lines emanating from a central point O, as shown at the left of Figure 3.20. Moreover, let the velocity along each of the streamlines vary inversely with distance from point O. Such a flow is called a source flow. Examining Figure 3.20, we see that the velocity components in the radial and tangential directions are Vr and Vg, respectively, where Vg = 0. The coordinate system in Figure 3.20 is a cylindrical

Source flow


Sink flow


Figure 3.20 Source and sink flows


image231

coordinate system, with the г axis perpendicular to the page. (Note that polar co­ordinates are simply the cylindrical coordinates r and в confined to a single plane given by г = constant.) It is easily shown (see Problem 3.9) that (1) source flow is a physically possible incompressible flow, that is, V • V = 0, at every point except the origin, where V • V becomes infinite, and (2) source flow is irrotational at every point.

In a source flow, the streamlines are directed away from the origin, as shown at the left of Figure 3.20. The opposite case is that of a sink flow, where by definition the streamlines are directed toward the origin, as shown at the right of Figure 3.20. For sink flow, the streamlines are still radial lines from a common origin, along which the flow velocity varies inversely with distance from point О. Indeed, a sink flow is simply a negative source flow.

The flows in Figure 3.20 have an alternate, somewhat philosophical interpreta­tion. Consider the origin, point О, as a discrete source or sink. Moreover, interpret the radial flow surrounding the origin as simply being induced by the presence of the discrete source or sink at the origin (much like a magnetic field is induced in the space surrounding a current-carrying wire). Recall that, for a source flow, V • V = 0 everywhere except at the origin, where it is infinite. Thus, the origin is a singular point, and we can interpret this singular point as a discrete source or sink of a given strength, with a corresponding induced flow field about the point. This interpreta­tion is very convenient and is used frequently. Other types of singularities, such as doublets and vortices, are introduced in subsequent sections. Indeed, the irrotational, incompressible flow field about an arbitrary body can be visualized as a flow induced by a proper distribution of such singularities over the surface of the body. This concept is fundamental to many theoretical solutions of incompressible flow over airfoils and other aerodynamic shapes, and it is the very heart of modem numerical techniques for the solution of such flows. You will obtain a greater appreciation for the concept of distributed singularities for the solution of incompressible flow in Chapters 4 through

6. At this stage, however, simply visualize a discrete source (or sink) as a singularity that induces the flows shown in Figure 3.20.

Let us look more closely at the velocity field induced by a source or sink. By definition, the velocity is inversely proportional to the radial distance r. As stated earlier, this velocity variation is a physically possible flow, because it yields V • V =

0. Moreover, it is the only such velocity variation for which the relation V • V = 0 is satisfied for the radial flows shown in Figure 3.20. Hence,

Vr = – [3.59a]

r

and Ve = 0 [3.59b]

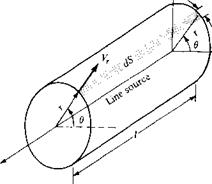
where c is constant. The value of the constant is related to the volume flow from the source, as follows. In Figure 3.20, consider a depth of length l perpendicular to the page, that is, a length l along the z axis. This is sketched in three-dimensional perspective in Figure 3.21. In Figure 3.21, we can visualize an entire line of sources along the z axis, of which the source О is just part. Therefore, in a two-dimensional flow, the discrete source, sketched in Figure 3.20, is simply a single point on the line source shown in Figure 3.21. The two-dimensional flow shown in Figure 3.20 is the

у


rd6


X


z


Figure 3.21 Volume flow rate from a line source.


image232

same in any plane perpendicular to the z, axis, that is, for any plane given by z, = constant. Consider the mass flow across the surface of the cylinder of radius r and height l as shown in Figure 3.21. The elemental mass flow across the surface element dS shown in Figure 3.21 is pV • dS = pVr( r d6){l). Hence, noting that Vr is the same value at any в location for the fixed radius r, the total mass flow across the surface of the cylinder is

image233[3.60]

Since p is defined as the mass per unit volume and m is mass per second, then m/p is the volume flow per second. Denote this rate of volume flow by v. Thus, from Equation (3.60), we have

Подпись: [3.61]m

v = — = 2nrlVr P

Подпись: or image234 Подпись: [3.62]

Moreover, the rate of volume flow per unit length along the cylinder is Ь/1. Denote this volume flow rate per unit length (which is the same as per unit depth perpendicular to the page in Figure 3.20) as Л. Hence, from Equation 3.61, we obtain

Hence, comparing Equations (3.59a) and (3.62), we see that the constant in Equation (3.59a)isc = А/2л. In Equation (3.62), Л defines the source length: it is physically the rate of volume flow from the source, per unit depth perpendicular to the page

of Figure 3.20. Typical units of Л are square meters per second or square feet per second. In Equation (3.62), a positive value of Л represents a source, whereas a negative value represents a sink.

The velocity potential for a source can be obtained as follows. From Equations

(2.157) , (3.5%), and (3.62),

Э Ф A

— = Vr =———-

dr 2nr

[3.63]

1 Э ф

and ——————————————— = Ve = 0

г дв

[3.64]

Integrating Equation (3.63) with respect to r, we have

Ф = ^Inr + f(6)

L7Z

[3.65]

Integrating Equation (3.64) with respect to в, we have

ф = const + f{r)

[3.66]

Подпись: A ф = — In r 2n Подпись: [3.67]

Comparing Equations (3.65) and (3.66), we see that fir) = (h/2n) In r and f(6) = constant. As explained in Section 3.9, the constant can be dropped without loss of rigor, and hence Equation (3.65) yields

Equation (3.67) is the velocity potential for a two-dimensional source flow.

Подпись: and Source Flow: Our Second Elementary Flow Подпись: [3.68] [3.69]

The stream function can be obtained as follows. From Equations (2.151a and b), (3.59b), and (3.62),

Integrating Equation (3.68) with respect to в, we obtain

ф = ^в + f(r) [3.70]

in

Integrating Equation (3.69) with respect to r, we have

ф = const + f(6) [3.71]

Comparing Equations (3.70) and (3.71) and dropping the constant, we obtain

image235[3.72]

Equation (3.72) is the stream function for a two-dimensional source flow.

The equation of the streamlines can be obtained by setting Equation (3.72) equal to a constant:

Л

f — —в = const [3.73]

2tt

From Equation (3.73), we see that в — constant, which, in polar coordinates, is the equation of a straight line from the origin. Hence, Equation (3.73) is consistent with the picture of the source flow sketched in Figure 3.20. Moreover, Equation (3.67) gives an equipotential line as r = constant, that is, a circle with its center at the origin, as shown by the dashed line in Figure 3.20. Once again, we see that streamlines and equipotential lines are mutually perpendicular.

To evaluate the circulation for source flow, recall the V x V = 0 everywhere. In turn, from Equation (2.137),

Г = ~ JJ(V x V) – dS = 0

5

for any closed curve C chosen in the flow field. Hence, as in the case of uniform flow discussed in Section 3.9, there is no circulation associated with the source flow.

It is straightforward to show that Equations (3.67) and (3.72) satisfy Laplace’s equation, simply by substitution into V20 = 0 and V2i/r = 0 written in terms of cylindrical coordinates [see Equation (3.42)]. Therefore, source flow is a viable elementary flow for use in building more complex flows.

Physical Significance

Consider again the basic model underlying Prandtl’s lifting-line theory. Return to Fig­ure 5.13 and study it carefully. An infinite number of infinitesimally weak horseshoe vortices are superimposed in such a fashion as to generate a lifting line which spans the wing, along with a vortex sheet which trails downstream. This trailing-vortex sheet is the instrument that induces downwash at the lifting line. At first thought, you might consider this model to be somewhat abstract—a mathematical convenience that somehow produces surprisingly useful results. However, to the contrary, the model shown in Figure 5.13 has real physical significance. To see this more clearly, return to Figure 5.1. Note that in the three-dimensional flow over a finite wing, the streamlines leaving the trailing edge from the top and bottom surfaces are in different directions; that is, there is a discontinuity in the tangential velocity at the trailing edge. We know from Chapter 4 that a discontinuous change in tangential velocity is theoretically allowed across a vortex sheet. In real life, such discontinuities do not exist; rather, the different velocities at the trailing edge generate a thin region of large velocity gradients—a thin region of shear flow with very large vorticity. Hence, a sheet of vorticity actually trails downstream from the trailing edge of a finite wing. This sheet

tends to roll up at the edges and helps to form the wing-tip vortices sketched in Fig­ure 5.2. Thus, Prandd’s lifting-line model with its trailing-vortex sheet is physically consistent with the actual flow downstream of a finite wing.


Consider a finite wing with an aspect ratio of 8 and a taper ratio of 0.8. The airfoil section is thin and symmetric. Calculate the lift and induced drag coefficients for the wing when it is at an angle of attack of 5°. Assume that 5 = r.

Solution

From Figure 5.18, 5 = 0.055. Hence, from the stated assumption, r also equals 0.055. From Equation (5.70), assuming ao = 2n from thin airfoil theory,


Example 5.1


Physical Significance

_ Uo

1 + a0/+rAR(l + r) = 0.0867 degree-1


Since the airfoil is symmetric, ctL=o = 0°. Thus,


CL = act = (0.0867 degree 1 (5°) =


0.4335


From Equation (5.61),


(0.4335)2(1 +0.055)


Physical Significance

0.00789


Cn


Physical Significance

Подпись: Example 5.2Consider a rectangular wing with an aspect ratio of 6, an induced drag factor 5 = 0.055, and a zero-lift angle of attack of —2°. At an angle of attack of 3.4°, the induced drag coefficient for this wing is 0.01. Calculate the induced drag coefficient for a similar wing (a rectangular wing with the same airfoil section) at the same angle of attack, but with an aspect ratio of 10. Assume that the induced factors for drag and the lift slope, S and r, respectively, are equal to each other (i. e., 5 = г). Also, for AR = 10, 5 = 0.105.

Solution

Physical Significance Подпись: TZARCDJ 1+5 Physical Significance

We must recall that although the angle of attack is the same for the two cases compared here (AR = 6 and 10), the value of Cl is different because of the aspect-ratio effect on the lift slope. First, let us calculate Cl for the wing with aspect ratio 6. From Equation (5.61),

Hence, CL = 0.423

The lift slope of this wing is therefore dCL 0.423

—– = —————- = 0.078/degree = 4.485/rad

da 3.4° – (-2°) ‘ 6 ‘

Physical Significance

The lift slope for the airfoil (the infinite wing) can be obtained from Equation (5.70):

dCi ^ «о

da 1 + (a0/7rAR)(l + r)


a0 _ a0

1 + [(1.055)«0/л-(6)] 1 + 0.056a0


4.485


Solving for ao, we find that this yields ao = 5.989/rad. Since the second wing (with AR = 10) has the same airfoil section, then a0 is the same. The lift slope of the second wing is given by


a0 5.989

1 + (a0/TrAR)(l + r) _ 1 + [(5.989)(1.105)/л-(103ї

= 0.086/degree


a


4.95/rad


The lift coefficient for the second wing is therefore


CL = a (a – aL=0) = 0.086[3.4° – (-2°)] = 0.464


In turn, the induced drag coefficient is


Physical Significance

0.0076


Physical Significance

Note: This problem would have been more straightforward if the lift coefficients had been stipulated to be the same between the two wings rather than the angle of attack. Then Equation (5.61) would have yielded the induced drag coefficient directly. A purpose of this example is to reinforce the rationale behind Equation (5.65), which readily allows the scaling of drag coefficients from one aspect ratio to another, as long as the lift coefficient is the same. This allows the scaled drag-coefficient data to be plotted versus CL (not the angle of attack) as in Figure 5.20. However, in the present example where the angle of attack is the same between both cases, the effect of aspect ratio on the lift slope must be explicitly considered, as we have done above.

Подпись: Example 5.3Consider the twin-jet executive transport discussed in Example 1.6. In addition to the infor­mation given in Example 1.6, for this airplane the zero-lift angle of attack is —2°, the lift slope of the airfoil section is 0.1 per degree, the lift efficiency factor r = 0.04, and the wing aspect ratio is 7.96. At the cruising condition treated in Example 1.6, calculate the angle of attack of the airplane.

Solution

The lift slope of the airfoil section in radians is

a0 = 0.1 per degree = 0.1 (57.3) = 5.73 rad From Equation (5.70) repeated below

_ _____ "o____

1 + (a0/7rAR)(l + r)

Physical Significance

lift distribution reaching farther away from the root. Such wings require heavier internal structure. Hence, as the aspect ratio of a wing increases, so does the structural weight of the wing. As a result of this compromise between aerodynamics and structures, typical aspect ratios for conventional subsonic airplanes are on the order of 6 to 8.

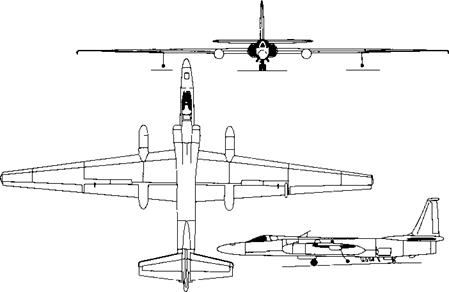
However, examine the three-view of the Lockheed U-2 high altitude reconnaissance aircraft shown in Figure 5.24. This airplane has the unusually high aspect ratio of 14.3. Why? The answer is keyed to its mission. The U-2 was essentially a point design; it was to cruise at the exceptionally high altitude of 70,000 ft or higher in order to not be reached by interceptor aircraft or ground-to-air-missiles during overflights of the Soviet Union in the 1950s. To achieve this mission, the need for incorporating a very high aspect ratio wing was paramount, for the following reason. In steady, level flight, where the airplane lift L must equal its weight W,

L = W = q. xSCL = p^VlSCL [5.71]

As the airplane flies higher, px decreases and hence from Equation (5.71) С/. must be increased in order to keep the lift equal to the weight. As its high-altitude cruise design point, the U-2 flies at a high value of C;, just on the verge of stalling. (This is in stark contrast to the normal cruise conditions of conventional airplanes at conventional altitudes, where the cruise lift coefficient is relatively small.) At the high value of С/, for the U-2 at cruising altitude, its induced drag coefficient [which from Equation (5.62) varies as C} would be unacceptably high if a conventional aspect ratio were used. Hence, the Lockheed design group (at the Lockheed Skunk Works) had to opt for as high an aspect ratio as possible to keep the induced drag coefficient within reasonable bounds. The wing design shown in Figure 5.24 was the result.

We made an observation about induced drag Д itself, in contrast to the induced drag coefficient CD, . We have emphasized, based on Equation (5.62), that Cdj can be reduced by increasing the aspect ratio. For an airplane in steady, level flight, however, the induced drag force itself is governed by another design parameter, rather than the aspect ratio per se, as follows. From Equation (5.62), we have


Three-view of the Lockheed U-2 high-altitude reconnaissance airplane.


Figure 5.34


image438

Physical Significance

Aerodynamic Forces and Moments

At first glance, the generation of the aerodynamic force on a giant Boeing 747 may seem complex, especially in light of the complicated three-dimensional flow field over the wings, fuselage, engine nacelles, tail, etc. Similarly, the aerodynamic resistance on an automobile traveling at 55 mi/h on the highway involves a complex interaction of the body, the air, and the ground. However, in these and all other cases, the aerodynamic forces and moments on the body are due to only two basic sources:

1. Pressure distribution over the body surface

2. Shear stress distribution over the body surface

No matter how complex the body shape may be, the aerodynamic forces and moments on the body are due entirely to the above two basic sources. The only mechanisms nature has for communicating a force to a body moving through a fluid are pressure and shear stress distributions on the body surface. Both pressure p and shear stress r have dimensions of force per unit area (pounds per square foot or newtons per square meter). As sketched in Figure 1.8, p acts normal to the surface, and r acts tangential to the surface. Shear stress is due to the “tugging action” on the surface, which is caused by friction between the body and the air (and is studied in great detail in Chapters 15 to 20).

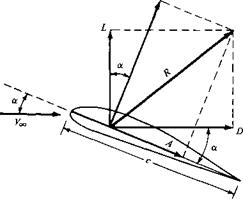
The net effect of the p and r distributions integrated over the complete body surface is a resultant aerodynamic force R and moment M on the body, as sketched in Figure 1.9. In turn, the resultant R can be split into components, two sets of which are shown in Figure 1.10. In Figure 1.10, V0c is the relative wind, defined as the

image15

p – pis) – surface pressure distribution t = t(s) = surface shear stress distribution

Figure 1.8 Illustration of pressure and shear stress on an aerodynamic surface.


image16

Figure 1.9 Resultant aerodynamic

force and moment on the body.


N

image17

Figure 1.10 Resultant aerodynamic force

and the components into which it splits.


flow velocity far ahead of the body. The flow far away from the body is called the freestream, and hence is also called the freestream velocity. In Figure 1.10, by

definition,

L = lift = component of R perpendicular to Vx D = drag = component of R parallel to

The chord c is the linear distance from the leading edge to the trailing edge of the body. Sometimes, R is split into components perpendicular and parallel to the chord, as also shown in Figure 1.10. By definition,

N = normal force = component of R perpendicular to c A = axial force = component of R parallel to c

The angle of attack a is defined as the angle between c and Vx. Hence, a is also the angle between L and N and between D and A. The geometrical relation between these two sets of components is, from Figure 1.10,

L = N cos a — A sin a [1.1]

D = N sin a + A cos a [1.2]

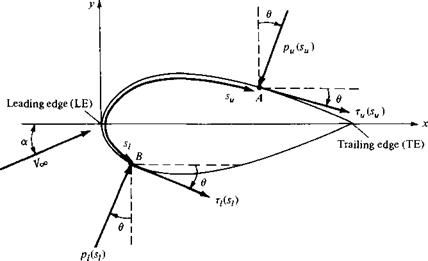
Let us examine in more detail the integration of the pressure and shear stress distributions to obtain the aerodynamic forces and moments. Consider the two­dimensional body sketched in Figure 1.11. The chord line is drawn horizontally, and hence the relative wind is inclined relative to the horizontal by the angle of attack a. An xy coordinate system is oriented parallel and perpendicular, respectively, to the chord. The distance from the leading edge measured along the body surface to an arbitrary point A on the upper surface is su; similarly, the distance to an arbitrary point В on the lower surface is si. The pressure and shear stress on the upper surface are denoted by pu and ru, respectively; both pu and zu are functions of su. Similarly, Pi and Т/ are the corresponding quantities on the lower surface and are functions of

image18

Figure 1.11 Nomenclature for the integration of pressure and shear stress distributions over a two-dimensional body surface.

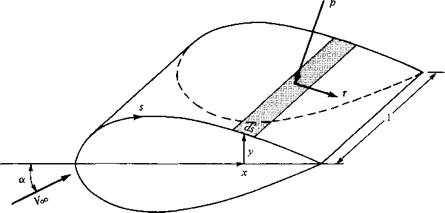
si. At a given point, the pressure is normal to the surface and is oriented at an angle 9 relative to the perpendicular; shear stress is tangential to the surface and is oriented at the same angle 9 relative to the horizontal. In Figure 1.11, the sign convention for в is positive when measured clockwise from the vertical line to the direction of p and from the horizontal line to the direction of r. In Figure 1.11, all thetas are shown in their positive direction. Now consider the two-dimensional shape in Figure 1.11 as a cross section of an infinitely long cylinder of uniform section. A unit span of such a cylinder is shown in Figure 1.12. Consider an elemental surface area dS of this cylinder, where dS — (ds)( ) as shown by the shaded area in Figure 1.12. We are interested in the contribution to the total normal force N’ and the total axial force A’ due to the pressure and shear stress on the elemental area dS. The primes on N’ and A’ denote force per unit span. Examining both Figures 1.11 and 1.12, we see that the elemental normal and axial forces acting on the elemental surface dS on the upper body surface are

dN’u — — pudsu cos0 — rudsu sin0 [1.3]

dA’u = —pudsu sin 9 + Tudsu cos 9 [1.4]

On the lower body surface, we have

dN{ = pidsi cos9 — Tidsisind [1.5]

dA = pidsi sin 9 + Tidsi cos 9 [1.6]

In Equations (1.3) to (1.6), the positive directions of N’ and A’ are those shown in Figure 1.10. In these equations, the positive clockwise convention for 9 must be followed. For example, consider again Figure 1.11. Near the leading edge of the body, where the slope of the upper body surface is positive, r is inclined upward, and hence it gives a positive contribution to N1. For an upward inclined г, в would

image19

Figure 1.13 Aerodynamic force on an element of the body surface.

be counterclockwise, hence negative. Therefore, in Equation (1.3), sin 0 would be negative, making the shear stress term (the last term) a positive value, as it should be in this instance. Hence, Equations (1.3) to (1.6) hold in general (for both the forward and rearward portions of the body) as long as the above sign convention for в is consistently applied.

image20

The total normal and axial forces per unit span are obtained by integrating Equa­tions (1.3) to (1.6) from the leading edge (LE) to the trailing edge (ТЕ):

In turn, the total lift and drag per unit span can be obtained by inserting Equations (1.7) and (1.8) into (1.1) and (1.2); note that Equations (1.1) and (1.2) hold for forces on an arbitrarily shaped body (unprimed) and for the forces per unit span (primed).

The aerodynamic moment exerted on the body depends on the point about which moments are taken. Consider moments taken about the leading edge. By convention, moments which tend to increase a (pitch up) are positive, and moments which tend to decrease a (pitch down) are negative. This convention is illustrated in Figure 1.13. Returning again to Figures 1.11 and 1.12, the moment per unit span about the leading edge due to p and г on the elemental area dS on the upper surface is

dM’u = (pu cos в + zu sin0)x dsu + (—pu sin# + xu cos 9)y dsu [1.9] On the bottom surface,

dM[ = {—pi cos в + tі sin 0)x dsi + (pi sin в + Т/ cosd)y dsi [1.10]

Подпись: ТЕ

In Equations (1.9) and (1.10), note that the same sign convention for в applies as before and that у is a positive number above the chord and a negative number below the chord. Integrating Equations (1.9) and (1.10) from the leading to the trailing edges, we obtain for the moment about the leading edge per unit span

/■ТЕ

+ / [(—р/ cos в + n sin в)х + (pi sin в + Ті cos в)у] dsi

J LE

(+)


(-)


Figure 1.13 Sign convention for aerodynamic moments.


image22

In Equations (1.7), (1.8), and (1.11), 9, x, and у are known functions of і for a given body shape. Hence, if pu, pi, t„, and г/ are known as functions of і (from theory or experiment), the integrals in these equations can be evaluated. Clearly, Equations (1.7), (1.8), and (1.11) demonstrate the principle stated earlier, namely, the sources of the aerodynamic lift, drag, and moments on a body are the pressure and shear stress distributions integrated over the body. A major goal of theoretical aerodynamics is to calculate p{s) and г(.v) for a given body shape and freestream conditions, thus yielding the aerodynamic forces and moments via Equations (1.7), (1.8), and (1.11).

As our discussions of aerodynamics progress, it will become clear that there are quantities of an even more fundamental nature than the aerodynamic forces and moments themselves. These are dimensionless force and moment coefficients, defined as follows. Let poo and be the density and velocity, respectively, in the freestream, far ahead of the body. We define a dimensional quantity called the freestream dynamic pressure as

Dynamic pressure: qx = ^p^V^

The dynamic pressure has the units of pressure (i. e., pounds per square foot or newtons per square meter). In addition, let S be a reference area and l be a reference length. The dimensionless force and moment coefficients are defined as follows:

Подпись:L

ЯоqS

QooS N

Cn =——–

qooS

_ A

Ca q<*>s

_ M

CM=q^Sl

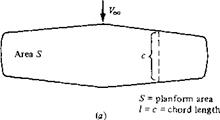
In the above coefficients, the reference area S and reference length l are chosen to pertain to the given geometric body shape; for different shapes, S and l may be different things. For example, for an airplane wing, S is the planform area, and l is the mean chord length, as illustrated in Figure 1.14a. However, for a sphere, S is the cross-sectional area, and l is the diameter, as shown in Figure 1.14b. The particular choice of reference area and length is not critical; however, when using force and moment coefficient data, you must always know what reference quantities the particular data are based upon.

The symbols in capital letters listed above, i. e., CL, CD, Cm, and CA, denote the force and moment coefficients for a complete three-dimensional body such as an airplane or a finite wing. In contrast, for a two-dimensional body, such as given in Figures 1.11 and 1.12, the forces and moments are per unit span. For these two-

image23

Цс f c *1 nd2

її j (l j S – cross-sectional area =

( j 1 = d = diameter

(b)

Figure 1.14 Some reference areas and lengths.

dimensional bodies, it is conventional to denote the aerodynamic coefficients by lowercase letters; e. g.,

_ L’ _ D’ _ M’

qooC qooC m qooC2

where the reference area S = c(l) = c.

Two additional dimensionless quantities of immediate use are

Pressure coefficient: C„ = ——^

*700 r

Skin friction coefficient: c t = —

qoo

where poo is the freestream pressure.

The most useful forms of Equations (1.7), (1.8), and (1.11) are in terms of the dimensionless coefficients introduced above. From the geometry shown in Figure 1.15,

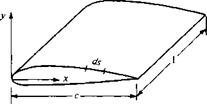
dx = dx cos в [1.12]

dy = — (ds sin#) [1.13]

S — c(l) [1.14]

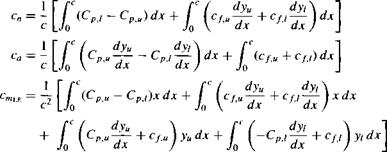
Substituting Equations (1.12) and (1.13) into Equations (1.7), (1.8), and (1.11), di­viding by qoo, and further dividing by S in the form of Equation (1.14), we obtain the following integral forms for the force and moment coefficients:

image24

image25

Figure 1.15 Geometrical relationship of differential lengths.


[1.15]

[1.15] [1.17]


image26

The simple algebraic steps are left as an exercise for the reader. When evaluating these integrals, keep in mind that yu is directed above the x axis, and hence is positive, whereas yi is directed below the x axis, and hence is negative. Also, dy/dx on both the upper and lower surfaces follow the usual rule from calculus, i. e., positive for those portions of the body with a positive slope and negative for those portions with a negative slope.

The lift and drag coefficients can be obtained from Equations (1.1) and (1.2) cast in coefficient form:

q = cn cos a — ca sin a [1.18]

Cd — cn sin a + ca cos a [1.19]

Integral forms for c; and cj are obtained by substituting Equations (1.15) and (1.16) into (1.18) and (1.19).

It is important to note from Equations (1.15) through (1.19) that the aerody­namic force and moment coefficients can be obtained by integrating the pressure and skin friction coefficients over the body. This is a common procedure in both theoretical and experimental aerodynamics. In addition, although our derivations have used a two-dimensional body, an analogous development can be presented for

three-dimensional bodies—the geometry and equations only get more complex and involved—the principle is the same.

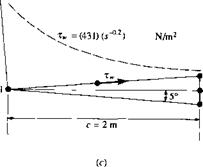
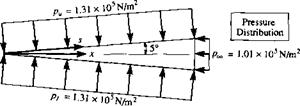
Подпись: Example 1.1Consider the supersonic flow over a 5° half-angle wedge at zero angle of attack, as sketched in Figure 1.16a. The freestream Mach number ahead of the wedge is 2.0, and the freestream pressure and density are 1.01 x 10⁵ N/m2 and 1.23 kg/m3, respectively (this corresponds to standard sea level conditions). The pressures on the upper and lower surfaces of the wedge are constant with distance s and equal to each other, namely, p„ = pi = 1.31 x 10s N/m2, as shown in Figure 1.16b. The pressure exerted on the base of the wedge is equal to px. As seen in Figure 1.16c, the shear stress varies over both the upper and lower surfaces as r„, =431 s 2. The chord length, c, of the wedge is 2 m. Calculate the drag coefficient for the wedge.

Solution

We will carry out this calculation in two equivalent ways. First, we calculate the drag from Equation (1.8), and then obtain the drag coefficient. In turn, as an illustration of an alternate approach, we convert the pressure and shear stress to pressure coefficient and skin friction coefficient, and then use Equation (1.16) to obtain the drag coefficient.

Since the wedge in Figure 1.16 is at zero angle of attach, then D’ = A’. Thus, the drag can be obtained from Equation (1.8) as

/>[’[■ pTE

D’ = ( —p„sin0 + T„COS0)c/.V„ + (Pi Sind + T/COS0)^.V/

Jle Jle

Referring to Figure 1.16c, recalling the sign convention for в, and noting that integration over the upper surface goes from. q to s2 on the inclined surface and from s2 to + on the base, whereas integration over the bottom surface goes from я to v4 on the inclined surface and from s4 to л’з on the base, we find that the above integrals become

f — pu sin в dsu = ( —(1.31 x 10⁵)sin(—5“)z2.v„

JLE Js і

+ j —(1.01 x 10⁵) sin 90° dsu

= 1.142 x 10⁴(,v2 – .я) – 1.01 x 10⁵(+ – s2)

= 1.142 x 10⁴ (—!—) – 1.01 x 10⁵(c)(tan 5°)

Vcos5°/

= 1.142 x 10⁴(2.008) – 1.01 x 10s(0.175) = 5260 N

Г ТЕ p. У4 p S}

pisinedsi = (1.31 x 10s)sin(5°)ds,+ (1.01 x 10⁵) sin(-90°)dst

JLE Js i */.s-4

= 1.142 x 10⁴(.v4 — я) +1.01 x 10⁵(—l)(.v3 – 44)

= 1.142 x 10⁴ (——) – 1.01 x 10⁵(c)(tan 5°)

Vcos5°z

= 2.293 x 10⁴ – 1.767 x 104 = 5260 N
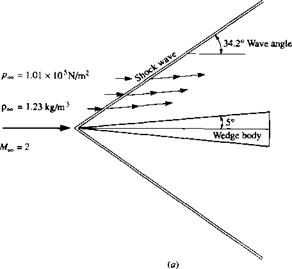
image27

image29

Figure 1.16 Illustration for Example 1.1.


Shear Stress Distribution


image28

Note that the integrals of the pressure over the top and bottom surfaces, respectively, yield the same contribution to the drag—a result to be expected from the symmetry of the configuration in Figure 1.16:

Г ТЕ rs2

Подпись: : 429 Aerodynamic Forces and Moments

r„cos в dsu = I 431s~02cos(—5°)dsu J LE Л,

Подпись: . 0.8/ C Vі.

= 429 (——– ) — = 936.5 N

Vcos5°/ 0.8

Подпись:r/cos0dsi = I 43b °-2cos(—5°)ds.

Подпись: : 4294′ ~si

0. 8

/ c y1» 1

= 429 (—– -) — = 936.5 N

Vcos5°/ 0.8

Again, it is no surprise that the shear stress acting over the upper and lower surfaces, respectively, give equal contributions to the drag; this is to be expected due to the symmetry of the wedge shown in Figure 1.16. Adding the pressure integrals, and then adding the shear stress integrals, we have for total drag

Подпись:D’ = 1.052 x 10⁴ + 0.1873 x 104 =

4——- v — 1 v ‘ 11 "

pressure skin friction

drag drag

Note that, for this rather slender body, but at a supersonic speed, most of the drag is pressure drag. Referring to Figure 1.16a, we see that this is due to the presence of an oblique shock wave from the nose of the body, which acts to create pressure drag (sometimes called “wave drag”). In this example, only 15 percent of the drag is skin friction drag; the other 85 percent is the pressure drag (wave drag). This is typical of the drag of slender supersonic bodies. In contrast, as we will see later, the drag of a slender body at subsonic speed, where there is no shock wave, is mainly skin friction drag.

The drag coefficient is obtained as follows. The velocity of the freestream is twice the sonic speed, which is given by

«СС = Vyrt*c = v/(l-4)(287)(288) = 340.2 m/s

(See Chapter 8 for a derivation of this expression for the speed of sound.) Note that, in the above, the standard sea level temperature of 288 К is used. Hence, V^ = 2(340.2) = 680.4 m/s. Thus,

Подпись: Hence, Подпись: D’ Узе 5 Подпись: 1.24 x 10⁴ (2.847 x 10⁵)(2) Подпись: 0.022

qx = IpxV^ = (0.5)(1.23)(680.4)2 = 2.847 x 10⁵ N/m2 Also, S = c(l) = 2.0m2

An alternate solution to this problem is to use Equation (1.16), integrating the pressure coefficients and skin friction coefficients to obtain directly the drag coefficient. We proceed as follows:

Aerodynamic Forces and Moments

Aerodynamic Forces and Moments

C.


On the lower surface, we have the same value for C„, i. e.,

■■ 0.1054

Aerodynamic Forces and Moments

Also,

= 0.009223x I2 +0.00189x°’8|p

Подпись: 0.022= 0.01854 + 0.00329 :

This is the same result as obtained earlier.

Example 1 .2 | Consider a cone at zero angle of attack in a hypersonic flow. (Hypersonic flow is very high­speed flow, generally defined as any flow above a Mach number of 5; hypersonic flow is further defined in Section 1.10.) The half-angle of the cone is вс, as shown in Figure 1.17. An approximate expression for the pressure coefficient on the surface of a hypersonic body is given by the newtonian sine-squared law (to be derived in Chapter 14):

Cp = 2 sin2 вс

Note that Cp, hence, p; is constant along the inclined surface of the cone. Along the base of the body, we assume that p = px. Neglecting the effect of friction, obtain an expression for the drag coefficient of the cone, where Co is based on the area of the base St,.

Solution

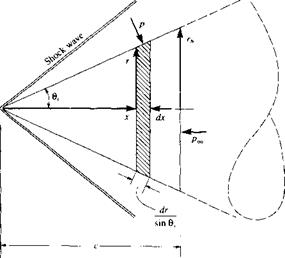
We cannot use Equations (1.15) to (1.17) here. These equations are expressed for a two­dimensional body, such as the airfoil shown in Figure 1.15, whereas the cone in Figure 1.17 is a shape in three-dimensional space. Hence, we must treat this three-dimensional body as follows. From Figure 1.17, the drag force on the shaded strip of surface area is

(p sin6>c.)(2jrг)- =2nrpdr

sin вс

Aerodynamic Forces and Moments

image31

Figure 1.17 Illustration for Example 1.2.


image30

The total drag due to the pressure acting over the total surface area of the cone is

rrb rn>

D= І Inrpdr — I Ілр-^dr

Jo Jo

The first integral is the horizontal force on the inclined surface of the cone, and the second integral is the force on the base of the cone. Combining the integrals, we have

D=f 2лг(р – PoJr/r = 7T(p – px)rl Jo

Referenced to the base area, nrft, the drag coefficient is

Подпись: Cn =Подпись: = c„D ЛГЬІР ~ Poo)

Подпись: CD = 2 sin2 вс

(Note: The drag coefficient for a cone is equal to its surface pressure coefficient.) Flence, using the newtonian sine-squared law, we obtain