Category Fundamentals of Aerodynamics

Center of Pressure

From Equations (1.7) and (1.8), we see that the normal and axial forces on the body are due to the distributed loads imposed by the pressure and shear stress distributions. Moreover, these distributed loads generate a moment about the leading edge, as given by Equation (1.11). Question: If the aerodynamic force on a body is specified in terms of a resultant single force R, or its components such as N and A, where on the body should this resultant be placed? The answer is that the resultant force should be located on the body such that it produces the same effect as the distributed loads. For example, the distributed load on a two-dimensional body such as an airfoil produces a moment about the leading edge given by Equation (1.11); therefore, N’ and A! must be placed on the airfoil at such a location to generate the same moment about the leading edge. If A! is placed on the chord line as shown in Figure 1.18, then N’ must be located a distance xcp downstream of the leading edge such that

MLE — (xcp)N

image32[1.20]

In Figure 1.18, the direction of the curled arrow illustrating M[E is drawn in the positive (pitch-up) sense. (From Section 1.5, recall the standard convention that aerodynamic moments are positive if they tend to increase the angle of attack.) Ex­amining Figure 1.18, we see that a positive N’ creates a negative (pitch-down) moment about the leading edge. This is consistent with the negative sign in Equation (1.20). Therefore, in Figure 1.18, the actual moment about the leading edge is negative, and hence is in a direction opposite to the curled arrow shown.

N’

image33

Figure 1.18 Center of pressure for an ai rfoil.


image34

Resultant force at leading edge


Center of Pressure

image35

Подпись: Figure 1.19Equivalent ways of specifying the force-and-moment system on an airfoil.

In Figure 1.18 and Equation (1.20), xcp is defined as the center of pressure. It is the location where the resultant of a distributed load effectively acts on the body. If moments were taken about the center of pressure, the integrated effect of the distributed loads would be zero. Hence, an alternate definition of the center of pressure is that point on the body about which the aerodynamic moment is zero.

Center of Pressure Подпись: ^LE L' Подпись: [1.21]

In cases where the angle of attack of the body is small, sin a ~ 0 and cos a ~ 1: hence, from Equation (1.1), L’ ~ N’. Thus, Equation (1.20) becomes

Examine Equations (1.20) and (1.21). As N’ and L’ decrease, xcp increases. As the forces approach zero, the center of pressure moves to infinity. For this reason, the center of pressure is not always a convenient concept in aerodynamics. However, this is no problem. To define the force-and-moment system due to a distributed load on a body, the resultant force can be placed at any point on the body, as long as the value of the moment about that point is also given. For example, Figure 1.19 illustrates three equivalent ways of specifying the force-and-moment system on an airfoil. In the left figure, the resultant is placed at the leading edge, with a finite value of { . In the middle figure, the resultant is placed at the quarter-chord point, with a finite value of M’y4. In the right figure, the resultant is placed at the center of pressure, with a zero moment about that point. By inspection of Figure 1.19, the quantitative relation between these cases is

MhE = — — L + Мсц = —xcpL [1.22]

Подпись: Example 1.3In low-speed, incompressible flow, the following experimental data are obtained for an NACA 4412 airfoil section at an angle of attack of 4°: q = 0.85 and cmx/4 = —0.09. Calculate the location of the center of pressure.

Solution

From Equation (1.22),

Center of Pressure

Center of Pressure

C

4


cp


-^cp 1 (^c/4/^00^ ) 1 Off, г/4

c 4 (L’/q^c) 4 с,

Подпись: 0.356_ 1 (-0.09)

“4 0.85

(Note: In Chapter 4, we will learn that, for a thin, symmetrical airfoil, the center of pressure is at the quarter-chord location. However, for the NACA 4412 airfoil, which is not symmetric, the center-of-pressure location is behind the quarter-chord point.)

Pathlines, Streamlines, and Streaklines

of a Flow

In addition to knowing the density, pressure, temperature, and velocity fields, in aerodynamics we like to draw pictures of “where the flow is going.” To accomplish this, we construct diagrams of pathlines and/or streamlines of the flow. The distinction between pathlines and streamlines is described in this section.

Consider an unsteady flow with a velocity field given by V = V(x, y, z, t). Also, consider an infinitesimal fluid element moving through the flow field, say, element A as shown in Figure 2.25a. Element A passes through point 1. Let us trace the path

of element A as it moves downstream from point 1, as given by the dashed line in Figure 2.25a. Such a path is defined as the pathline for element A. Now, trace the path of another fluid element, say, element В as shown in Figure 2.25b. Assume that element В also passes through point 1, but at some different time from element A. The pathline of element В is given by the dashed line in Figure 2.25b. Because the flow is unsteady, the velocity at point 1 (and at all other points of the flow) changes with time. Hence, the pathlines of elements A and В are different curves in Figure 2.25a and b. In general, for unsteady flow, the pathlines for different fluid elements passing through the same point are not the same.

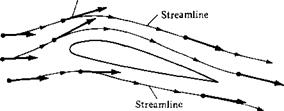
In Section 1.4, the concept of a streamline was introduced in a somewhat heuristic manner. Let us be more precise here. By definition, a streamline is a curve whose tangent at any point is in the direction of the velocity vector at that point. Streamlines are illustrated in Figure 2.26. The streamlines are drawn such that their tangents at every point along the streamline are in the same direction as the velocity vectors at those points. If the flow is unsteady, the streamline pattern is different at different times because the velocity vectors are fluctuating with time in both magnitude and direction.

In general, streamlines are different from pathlines. You can visualize a pathline as a time-exposure photograph of a given fluid element, whereas a streamline pattern is like a single frame of a motion picture of the flow. In an unsteady flow, the streamline pattern changes; hence, each “frame” of the motion picture is different.

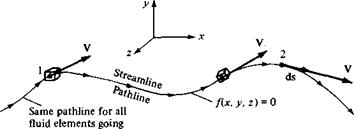
However, for the case of steady flow (which applies to most of the applications in this book), the magnitude and direction of the velocity vectors at all points are fixed, invariant with time. Hence, the pathlines for different fluid elements going through the same point are the same. Moreover, the pathlines and streamlines are identical. Therefore, in steady flow, there is no distinction between pathlines and streamlines;

Velocity vector

image150

Figure 3.36 Streamlines.

image151

through point 1

Figure 3.37 For steady flow, streamlines and pathlines are the same.

they are the same curves in space. This fact is reinforced in Figure 2.27, which illus­trates the fixed, time-invariant streamline (pathline) through point 1. In Figure 2.27, a given fluid element passing through point 1 traces a pathline downstream. All sub­sequent fluid elements passing through point 1 at later times trace the same pathline. Since the velocity vector is tangent to the pathline at all points on the pathline for all times, the pathline is also a streamline. For the remainder of this book, we deal mainly with the concept of streamlines rather than pathlines; however, always keep in mind the distinction described above.

Question: Given the velocity field of a flow, how can we obtain the mathematical equation for a streamline? Obviously, the streamline illustrated in Figure 2.27 is a curve in space, and hence it can be described by the equation f(x, y,z) =0. How can we obtain this equation? To answer this question, let ds be a directed element of the streamline, such as shown at point 2 in Figure 2.27. The velocity at point 2 is V, and by definition of a streamline, V is parallel to ds. Hence, from the definition of the vector cross product [see Equation (2.4)],

ds x V = 0 I [3.115]

Equation (2.115) is a valid equation for a streamline. To put it in a more recognizable form, expand Equation (2.115) in cartesian coordinates:

Equations (2.117a to c) are differential equations for the streamline. Knowing u, v, and w as functions of x, y, and z, Equations (2.117a to c) can be integrated to yield the equation for the streamline: fix, y, z.) = 0.

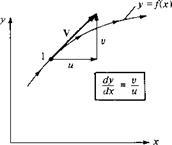
To reinforce the physical meaning of Equations (2.117a to c), consider a stream­line in two dimensions, as sketched in Figure 2.28a. The equation of this streamline is у = fix). Hence, at point 1 on the streamline, the slope is dyjdx. However, V with x and у components и and v, respectively, is tangent to the streamline at point 1. Thus, the slope of the streamline is also given by v/u, as shown in Figure 2.26. Therefore,

Подпись: ds = dx і + dy'] + dz к Y = ui + pj + wk

[2.1 18]

image152

(a)

Figure 2.28 (a) Equation of a stream in two-dimensional

cartesian space, (b) Sketch of a streamtube in three-dimensional space.


image153

Equation (2.118) is a differential equation for a streamline in two dimensions. From Equation (2.118),

v dx — и dy = 0

which is precisely Equation (2.117c). Therefore, Equations (2.117a to c) and (2.118) simply state mathematically that the velocity vector is tangent to the streamline.

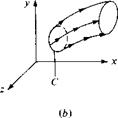
A concept related to streamlines is that of a streamtube. Consider an arbitrary closed curve C in three-dimensional space, as shown in Figure 2.28b. Consider the streamlines which pass through all points on C. These streamlines form a tube in space as sketched in Figure 2.28b; such a tube is called a streamtube. For example, the walls of an ordinary garden hose form a streamtube for the water flowing through the hose. For a steady flow, a direct application of the integral form of the continuity equation [Equation (2.53)] proves that the mass flow across all cross sections of a streamtube is constant. (Prove this yourself.)

Подпись: Example 2.3Consider the velocity field given by и = y/(x2 + y2) and v = —x/(x2 + y2). Calculate the equation of the streamline passing through the point (0, 5).
Solution

From Equation (2.118), dy/dx = v/u = —x/y, and

ydy = —x dx

Integrating, we obtain

+ c

where c is a constant of integration.

For the streamline through (0, 5), we have

52 = 0 + c or c — 25

Подпись: x2 + y2 = 25

Thus, the equation of the streamline is

Note that the streamline is a circle with its center at the origin and a radius of 5 units.

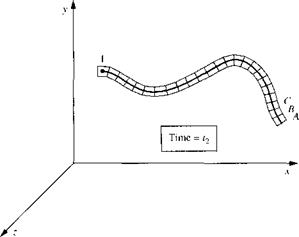
Streamlines are by far the most common method used to visualize a fluid flow. In an unsteady flow it is also useful to track the path of a given fluid element as it moves through the flow field, i. e., to trace out the pathline of the fluid element. However, separate from the ideas of a streamline and a pathline is the concept of a streakline. Consider a fixed point in a flow field, such as point 1 in Figure 2.29. Consider all the individual fluid elements that have passed through point 1 over a given time interval t2 — q. These fluid elements, shown in Figure 2.29, are connected with each other, like a string of elephants connected trunk-to-tail. Element A is the fluid element that passed through point 1 at time q. Element В is the next element that passed through point 1, just behind element A. Element C is the element that passed through point 1 just behind element B, and so forth. Figure 2.29 is an illustration, made at time t2, which shows all the fluid elements that have earlier passed through point 1 over the time interval (t2 — q). The line that connects all these fluid elements is, by definition, a

image154

Figure 2.29 Illustration of a streakline through point I.

streakline. We can more concisely define a streakline as the locus of fluid elements which have earlier passed through a prescribed point. To help further visualize the concept of a streakline, imagine that we are constantly injecting dye into the flow field at point 1. The dye will flow downstream from point 1, forming a curve in the x, y, z space in Figure 2.29. This curve is the streakline shown in Figure 2.29. A photograph of a streakline in the flow of water over a circular cylinder is shown in Figure 3.48. The white streakline is made visible by white particles that are constantly formed by electrolysis near a small anode fixed on the cylinder surface. These white particles subsequently flow downstream forming a streakline.

For a steady flow, pathlines, streamlines, and streaklines are all the same curves. Only in an unsteady flow are they different. So for steady flow, which is the type of flow mainly considered in this book, the concepts of a pathline, streamline, and streakline are redundant.

Airfoil Nomenclature

The first patented airfoil shapes were developed by Horatio F. Phillips in 1884. Phillips was an Englishman who carried out the first serious wind-tunnel experiments on airfoils. In 1902, the Wright brothers conducted their own airfoil tests in a wind tunnel, developing relatively efficient shapes which contributed to their successful first flight on December 17, 1903 (see Section 1.1). Clearly, in the early days of powered flight, airfoil design was basically customized and personalized. However, in the early 1930s, the National Advisory Committee for Aeronautics (NACA)—the

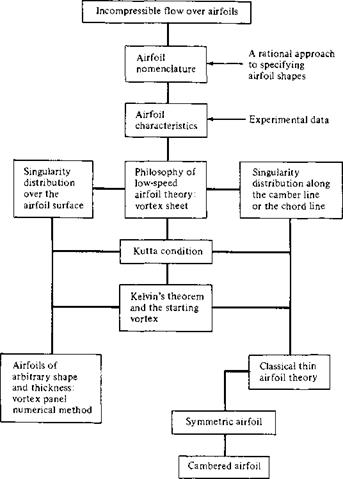
image301

Figure 4.2 Road map for Chapter 4.

forerunner of NASA—embarked on a series of definitive airfoil experiments using airfoil shapes that were constructed rationally and systematically. Many of these NACA airfoils are in common use today. Therefore, in this chapter we follow the nomenclature established by the NACA; such nomenclature is now a well-known standard.

Consider the airfoil sketched in Figure 4.3. The mean camber line is the locus of points halfway between the upper and lower surfaces as measured perpendicular to the mean camber line itself. The most forward and rearward points of the mean camber line are the leading and trailing edges, respectively. The straight line connecting the leading and trailing edges is the chord line of the airfoil, and the precise distance from

image302

Figure 4.3 Airfoil nomenclature.

the leading to the trailing edge measured along the chord line is simply designated the chord c of the airfoil. The camber is the maximum distance between the mean camber line and the chord line, measured perpendicular to the chord line. The thickness is the distance between the upper and lower surfaces, also measured perpendicular to the chord line. The shape of the airfoil at the leading edge is usually circular, with a leading-edge radius of approximately 0.02c. The shapes of all standard NACA airfoils are generated by specifying the shape of the mean camber line and then wrapping a specified symmetrical thickness distribution around the mean camber line.

The force-and-moment system on an airfoil was discussed in Section 1.5, and the relative wind, angle of attack, lift, and drag were defined in Figure 1.10. You should review these considerations before proceeding further.

The NACA identified different airfoil shapes with a logical numbering system. For example, the first family of NACA airfoils, developed in the 1930s, was the “four­digit” series, such as the NACA 2412 airfoil. Here, the first digit is the maximum camber in hundredths of chord, the second digit is the location of maximum camber along the chord from the leading edge in tenths of chord, and the last two digits give the maximum thickness in hundredths of chord. For the NACA 2412 airfoil, the maximum camber is 0.02c located at 0.4c from the leading edge, and the maximum thickness is 0.12c. It is common practice to state these numbers in percent of chord, that is, 2 percent camber at 40 percent chord, with 12 percent thickness. An airfoil with no camber, that is, with the camber line and chord line coincident, is called a symmetric airfoil. Clearly, the shape of a symmetric airfoil is the same above and below the chord line. For example, the NACA 0012 airfoil is a symmetric airfoil with a maximum thickness of 12 percent.

The second family of NACA airfoils was the “five-digit” series, such as the NACA 23012 airfoil. Here, the first digit when multiplied by | gives the design lift coefficient[13] in tenths, the next two digits when divided by 2 give the location of maximum camber along the chord from the leading edge in hundredths of chord, and the final two digits give the maximum thickness in hundredths of chord. For the NACA 23012 airfoil, the design lift coefficient is 0.3, the location of maximum camber is at 0.15c, and the airfoil has 12 percent maximum thickness.

One of the most widely used family of NACA airfoils is the “6-series” laminar flow airfoils, developed during World War II. An example is the NACA 65-218. Here,

the first digit simply identifies the series, the second gives the location of minimum pressure in tenths of chord from the leading edge (for the basic symmetric thickness distribution at zero lift), the third digit is the design lift coefficient in tenths, and the last two digits give the maximum thickness in hundredths of chord. For the NACA 65-218 airfoil, the 6 is the series designation, the minimum pressure occurs at 0.5c for the basic symmetric thickness distribution at zero lift, the design lift coefficient is

0. 2, and the airfoil is 18 percent thick.

The complete NACA airfoil numbering system is given in Reference 11. Indeed, Reference 11 is a definitive presentation of the classic NACA airfoil work up to 1949. It contains a discussion of airfoil theory, its application, coordinates for the shape of NACA airfoils, and a huge bulk of experimental data for these airfoils. This author strongly encourages you to read Reference 11 for a thorough presentation of airfoil characteristics.

As a matter of interest, the following is a short partial listing of airplanes currently in service which use standard NACA airfoils.

Airplane Airfoil

Beechcraft Sundowner Beechcraft Bonanza

Cessna 150 Fairchild A-10

Gates Learjet 24D General Dynamics F-16 Lockheed C-5 Galaxy

NACA 63A415 NACA 23016.5 (at root) NACA 23012 (at tip) NACA 2412 NACA 6716 (at root) NACA 6713 (at tip) NACA 64A109 NACA 64A204 NACA 0012 (modified)

In addition, many of the large aircraft companies today design their own special- purpose airfoils; for example, the Boeing 727, 737, 747, 757, and 767 all have spe­cially designed Boeing airfoils. Such capability is made possible by modern airfoil design computer programs utilizing either panel techniques or direct numerical finite – difference solutions of the governing partial differential equations for the flow field. (Such equations are developed in Chapter 2.)

Compressible Flow: Some Preliminary Aspects

With the realization of aeroplane and missile speeds equal to or even surpassing many times the speed of sound, thermodynamics has entered the scene and will never again leave our considerations.

Jakob Ackeret, 1962

7.1 Introduction

On September 30, 1935, the leading aerodynamicists from all comers of the world converged on Rome, Italy. Some of them arrived in airplanes which, in those days, lumbered along at speeds of 130 mi/h. Ironically, these people were gathering to discuss airplane aerodynamics not at 130 mi/h but rather at the unbelievable speeds of 500 mi/h and faster. By invitation only, such aerodynamic giants as Theodore von Karman and Eastman Jacobs from the United States, Ludwig Prandtl and Adolf Busemann from Germany, Jakob Ackeret from Switzerland, G. I. Taylor from Eng­land, Arturo Crocco and Enrico Pistolesi from Italy, and others assembled for the fifth Volta Conference, which had as its topic “High Velocities in Aviation.” Although the jet engine had not yet been developed, these men were convinced that the future of aviation was “faster and higher.” At that time, some aeronautical engineers felt that airplanes would never fly faster than the speed of sound—the myth of the “sound barrier” was propagating through the ranks of aviation. However, the people who attended the fifth Volta Conference knew better. For 6 days, inside an impressive Re­naissance building that served as the city hall during the Holy Roman Empire, these

individuals presented papers that discussed flight at high subsonic, supersonic, and even hypersonic speeds. Among these presentations was the first public revelation of the concept of a swept wing for high-speed flight; Adolf Busemann, who originated the concept, discussed the technical reasons why swept wings would have less drag at high speeds than conventional straight wings. (One year later, the swept-wing con­cept was classified by the German Luftwaffe as a military secret. The Germans went on to produce a large bulk of swept-wing research during World War II, resulting in the design of the first operational jet airplane—the Me 262—which had a moderate degree of sweep.) Many of the discussions at the Volta Conference centered on the effects of “compressibility” at high subsonic speeds, that is, the effects of variable density, because this was clearly going to be the first problem to be encountered by future high-speed airplanes. For example, Eastman Jacobs presented wind-tunnel test results for compressibility effects on standard NACA four – and five-digit airfoils at high subsonic speeds and noted extraordinarily large increases in drag beyond certain freestream Mach numbers. In regard to supersonic flows, Ludwig Prandtl presented a series of photographs showing shock waves inside nozzles and on various bodies— with some of the photographs dating as far back as 1907, when Prandtl started serious work in supersonic aerodynamics. (Clearly, Ludwig Prandtl was busy with much more than just the development of his incompressible airfoil and finite-wing theory discussed in Chapters 4 and 5.) Jakob Ackeret gave a paper on the design of su­personic wind tunnels, which, under his direction, were being established in Italy, Switzerland, and Germany. There were also presentations on propulsion techniques for high-speed flight, including rockets and ramjets. The atmosphere surrounding the participants in the Volta Conference was exciting and heady; the conference launched the world aerodynamic community into the area of high-speed subsonic and super­sonic flight—an area which today is as commonplace as the 130-mi/h flight speeds of 1935. Indeed, the purpose of the next eight chapters of this book is to present the fundamentals of such high-speed flight.

In contrast to the low-speed, incompressible flows discussed in Chapters 3 to 6, the pivotal aspect of high-speed flow is that the density is a variable. Such flows are called compressible flows and are the subject of Chapters 7 to 14. Return to Figure 1.38, which gives a block diagram categorizing types of aerodynamic flows. In Chapters 7 to 14, we discuss flows which fall into blocks D and F that is, we will deal with inviscid compressible flow. In the process, we touch all the flow regimes itemized in blocks G through J. These flow regimes are illustrated in Figure 1.37; study Figures 1.37 and 1.38 carefully, and review the surrounding discussion in Section 1.10 before proceeding further.

In addition to variable density, another pivotal aspect of high-speed compressible flow is energy. A high-speed flow is a high-energy flow. For example, consider the flow of air at standard sea level conditions moving at twice the speed of sound. The internal energy of 1 kg of this air is 2.07 x 10⁵ J, whereas the kinetic energy is larger, namely, 2.31 x 10⁵ J. When the flow velocity is decreased, some of this kinetic energy is lost and reappears as an increase in internal energy, hence increasing the temperature of the gas. Therefore, in a high-speed flow, energy transformations and temperature changes are important considerations. Such considerations come under

image487

Figure 7.1 Road map for Chapter 7.

the science of thermodynamics. For this reason, thermodynamics is a vital ingredient in the study of compressible flow. One purpose of the present chapter is to review briefly the particular aspects of thermodynamics which are essential to our subsequent discussions of compressible flow.

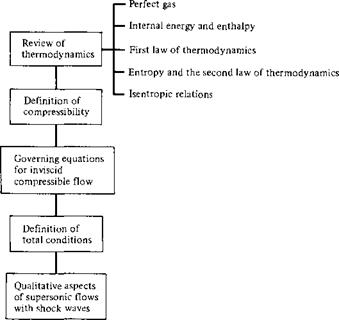
The road map for this chapter is given in Figure 7.1. As our discussion proceeds, refer to this road map in order to provide an orientation for our ideas.

Summary

Refer again to the road map for Chapter 1 given in Figure 1.6. Read again each block in this diagram as a reminder of the material we have covered. If you feel uncomfortable about some of the concepts, or if your memory is slightly “foggy” on certain points, go back and reread the pertinent sections until you have mastered the material.

This chapter has been primarily qualitative, emphasizing definitions and basic concepts. However, some of the more important quantitative relations are summarized below:


Summary

The center of pressure is obtained from


Mle

~T~


Mle

N


r’cp


[1.80] and [1.91]


The criteria for two or more flows to be dynamically similar are:

1. The bodies and any other solid boundaries must be geometrically similar.

2. The similarity parameters must be the same. Two important similarity parameters are Mach number M = V/a and Reynolds number Re = p V с/ц..

If two or more flows are dynamically similar, then the force coefficients Cl, Cd, etc., are the same.


image81image82

In fluid statics, the governing equation is the hydrostatic equation:

dp = ~gp dy

[1.52]

For a constant density medium, this integrates to

p + pgh = constant

[1.54]

or p і + pgh = P2 + pgh2

Such equations govern, among other things, the operation of a manometer, and also lead to Archimedes’ principle that the buoyancy force on a body immersed in a fluid is equal to the weight of the fluid displaced by the body.

Bernoulli’s Equation

As will be portrayed in Section 3.19, the early part of the eighteenth century saw the flowering of theoretical fluid dynamics, paced by the work of Johann and Daniel Bernoulli and, in particular, by Leonhard Euler. It was at this time that the relation between pressure and velocity in an inviscid, incompressible flow was first understood.

The resulting equation is


Bernoulli’s Equation

Equation (3.12) is called Euler’s equation. It applies to an inviscid flow with no body forces, and it relates the change in velocity along a streamline d V to the change in pressure dp along the same streamline.

Equation (3.12) takes on a very special and important form for incompressible flow. In such a case, p — constant, and Equation (3.12) can be easily integrated between any two points 1 and 2 along a streamline. From Equation (3.12), with p = constant, we have

Подпись:or

Подпись: or[3.13]

Equation (3.13) is Bernoulli’s equation, which relates pi and Vt at point 1 on a streamline to pz and V2 at another point 2 on the same streamline. Equation (3.13)

Подпись: p + pV2 = const along a streamline Подпись: [3.14]

can also be written as

Подпись: p + ~pV2 = const throughout the flow Подпись: [3.15]

In the derivation of Equations (3.13) and (3.14), no stipulation has been made as to whether the flow is rotational or irrotational—these equations hold along a streamline in either case. For a general, rotational flow, the value of the constant in Equation (3.14) will change from one streamline to the next. Flowever, if the flow is irrotational, then Bernoulli’s equation holds between any two points in the flow, not necessarily just on the same streamline. For an irrotational flow, the constant in Equation (3.14) is the same for all streamlines, and

The proof of this statement is given as Problem 3.1.

The physical significance of Bernoulli’s equation is obvious from Equations

(3.13) to (3.15); namely, when the velocity increases, the pressure decreases, and when the velocity decreases, the pressure increases.

Note that Bernoulli’s equation was derived from the momentum equation; hence, it is a statement of Newton’s second law for an inviscid, incompressible flow with no body forces. Flowever, note that the dimensions of Equations (3.13) to (3.15) are energy per unit volume (pV2 is the kinetic energy per unit volume). Flence, Bernoulli’s equation is also a relation for mechanical energy in an incompressible flow; it states that the work done on a fluid by pressure forces is equal to the change in kinetic energy of the flow. Indeed, Bernoulli’s equation can be derived from the general energy equation, such as Equation (2.114). This derivation is left to the reader. The fact that Bernoulli’s equation can be interpreted as either Newton’s second law or an energy equation simply illustrates that the energy equation is redundant for the analysis of inviscid, incompressible flow. For such flows, the continuity and momentum equations suffice. (You may wish to review the opening comments of Section 2.7 on this same subject.)

The strategy for solving most problems in inviscid, incompressible flow is as follows:

1. Obtain the velocity field from the governing equations. These equations, appro­priate for an inviscid, incompressible flow, are discussed in detail in Sections 3.6

and 3.7.

2. Once the velocity field is known, obtain the corresponding pressure field from Bernoulli’s equation.

However, before treating the general approach to the solution of such flows (Section 3.7), several applications of the continuity equation and Bernoulli’s equation are made to flows in ducts (Section 3.3) and to the measurement of airspeed using a Pitot tube (Section 3.4).

Example 3.1 I Consider an airfoil in a flow at standard sea level conditions with a freestream velocity of 50 m/s. At a given point on the airfoil, the pressure is 0.9 x 10⁵ N/m2. Calculate the velocity at this point.

Solution

At standard sea level conditions, рх = 1.23 kg/m3 and px = 1.01 x 10⁵ N/m2. Hence,

Pcо + pVl, = p + pV2

v – 01 x ‘O’ 7^1

U = 142.8 m/s

Modern Low-Speed Airfoils

The nomenclature and aerodynamic characteristics of standard NACA airfoils are discussed in Sections 4.2 and 4.3; before progressing further, you should review these sections in order to reinforce your knowledge of airfoil behavior, especially in light of our discussions on airfoil theory. Indeed, the purpose of this section is to provide a modem sequel to the airfoils discussed in Sections 4.2 and 4.3.

image357
image358

During the 1970s, NASA designed a series of low-speed airfoils that have perfor­mance superior to the earlier NACA airfoils. The standard NACA airfoils were based almost exclusively on experimental data obtained during the 1930s and 1940s. In con­trast, the new NASA airfoils were designed on a computer using a numerical technique similar to the source and vortex panel methods discussed earlier, along with numerical predictions of the viscous flow behavior (skin friction and flow separation). Wind – tunnel tests were then conducted to verify the computer-designed profiles and to obtain the definitive airfoil properties. Out of this work first came the general aviation— Whitcomb [GA(W) — 1] airfoil, which has since been redesignated the LS(1)-0417 airfoil. The shape of this airfoil is given in Figure 4.30, obtained from Reference 16. Note that it has a large leading-edge radius (0.08c in comparison to the standard 0.02c) in order to flatten the usual peak in pressure coefficient near the nose. Also, note that the bottom surface near the trailing edge is cusped in order to increase the camber and

Подпись: Figure 4.30 Profile for the NASA LS(1)-0417 airfoil.When first introduced, this airfoil was labeled the GA (W)-l airfoil, a nomenclature which has now been superseded. (From Reference 16.)
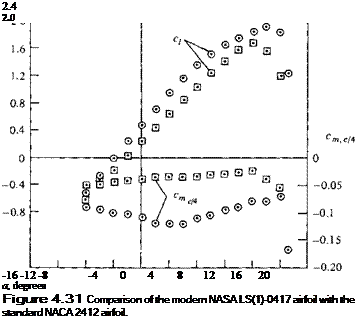
hence the aerodynamic loading in that region. Both design features tend to discourage flow separation over the top surface at high angle of attack, hence yielding higher values of the maximum lift coefficient. The experimentally measured lift and moment properties (from Reference 16) are given in Figure 4.31, where they are compared with the properties for an NACA 2412 airfoil, obtained from Reference 11. Note that Q. max for the NASA LS(1)-0417 is considerably higher than for the NACA 2412.

The NASA LS(1)-0417 airfoil has a maximum thickness of 17 percent and a design lift coefficient of 0.4. Using the same camber line, NASA has extended this airfoil into a family of low-speed airfoils of different thicknesses, for example, the NASA LS(l)-0409 and the LS(1)-0413. (See Reference 17 for more details.) In comparison with the standard NACA airfoils having the same thicknesses, these new LS(l)-04xx airfoils all have:

1. Approximately 30 percent higher c/imax•

2. Approximately a 50 percent increase in the ratio of lift to drag (L/D) at a lift coefficient of 1.0. This value of q = 1.0 is typical of the climb lift coefficient for general aviation aircraft, and a high value of L/D greatly improves the climb

Подпись: 2.4 2.0 -16 -12 -8 -4 0 4 8 12 16 20 a, degrees Figure 4.31 Comparison of the modern NASA LS(1)-0417 airfoil with the standard NACA 2412 airfoil.

© NASA LS(1)0417 (ref. 16), Re = 6.3 X 10⁶ 0 NACA 2412 (ref. 11), Re = 5.7 X 10⁶

performance. (See Reference 2 for a general introduction to airplane performance

and the importance of a high L/D ratio to airplane efficiency.)

It is interesting to note that the shape of the airfoil in Figure 4.30 is very similar to the supercritical airfoils to be discussed in Chapter 11. The development of the supercritical airfoil by NASA aerodynamicist Richard Whitcomb in 1965 resulted in a major improvement in airfoil drag behavior at high subsonic speeds, near Mach 1. The supercritical airfoil was a major breakthrough in high-speed aerodynamics. The LS(1)-0417 low-speed airfoil shown in Figure 4.30, first introduced as the GA(W)-1 airfoil, was a later spin-off from supercritical airfoil research. It is also interesting to note that the first production aircraft to use the NASA LS( 1 )-0417 airfoil was the Piper PA-38 Tomahawk, introduced in the late 1970s.

Подпись: DESIGN BOX
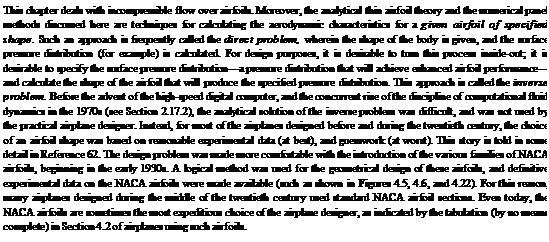
Подпись: This chapter deals with incompressible flow over airfoils. Moreover, the analytical thin airfoil theory and the numerical panel methods discussed here are techniques for calculating the aerodynamic characteristics for a given airfoil of specified shape. Such an approach is frequently called the direct problem, wherein the shape of the body is given, and the surface pressure distribution (for example) is calculated. For design purposes, it is desirable to turn this process inside-out; it is desirable to specify the surface pressure distribution—a pressure distribution that will achieve enhanced airfoil performance—and calculate the shape of the airfoil that will produce the specified pressure distribution. This approach is called the inverse problem. Before the advent of the high-speed digital computer, and the concurrent rise of the discipline of computational fluid dynamics in the 1970s (see Section 2.17.2), the analytical solution of the inverse problem was difficult, and was not used by the practical airplane designer. Instead, for most of the airplanes designed before and during the twentieth century, the choice of an airfoil shape was based on reasonable experimental data (at best), and guesswork (at worst). This story is told in some detail in Reference 62. The design problem was made more comfortable with the introduction of the various families of NACA airfoils, beginning in the early 1930s. A logical method was used for the geometrical design of these airfoils, and definitive experimental data on the NACA airfoils were made available (such as shown in Figures 4.5, 4.6, and 4.22). For this reason, many airplanes designed during the middle of the twentieth century used standard NACA airfoil sections. Even today, the NACA airfoils are sometimes the most expeditious choice of the airplane designer, as indicated by the tabulation (by no means complete) in Section 4.2 of airplanes using such airfoils.

In summary, new airfoil development is alive and well in the aeronautics of the late twentieth century. Moreover, in contrast to the purely experimental development of the earlier airfoils, we now enjoy the benefit of powerful computer programs using panel methods and advanced viscous flow solutions for the design of new airfoils. Indeed, in the 1980s NASA established an official Airfoil Design Center at The Ohio State University, which services the entire general aviation industry with over 30 dif­ferent computer programs for airfoil design and analysis. For additional information on such new low-speed airfoil development, you are urged to read Reference 16, which is the classic first publication dealing with these airfoils, as well as the concise review given in Reference 17.

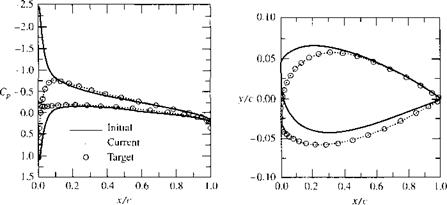
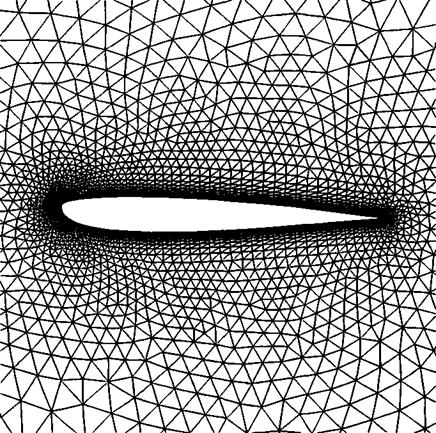
However, today the power of computational fluid dynamics (CFD) is revolutionizing airfoil design and anal­ysis. The inverse problem, and indeed the next step—the overall automated procedure that results in a completely optimized airfoil shape for a given design point—are being made tractable by CFD. An example of such work is illustrated in Figures 4.32 and 4.33, taken from the recent work of Kyle Anderson and Daryl Bonhaus (Refer­ence 68). Here, CFD solutions of the continuity, momentum, and energy equations for a compressible, viscous flow (the Navier-Stokes equations, as denoted in Section 2.17.2) are carried out for the purpose of airfoil design. Using a finite volume CFD technique, and the grid shown in Figure 4.32, the inverse problem is solved. The specified pressure distribution over the top and bottom surfaces of the airfoil is given by the circles in Figure 4.33a. The optimization technique is iterative and requires starting with a pressure distribution that is not the desired, specified one; the initial distribution is given by the solid curves in Figure 4.33a, and the airfoil shape corresponding to this initial pressure distribution is shown by the solid curve in Figure 4.33b. (In Figure 4.33b, the airfoil shape appears distorted because an expanded scale is used for the ordinate.) After 10 design cycles, the optimized airfoil shape


image360

Figure 4.32 Unstructured mesh for the numerical calculation of the flow over an airfoil. (Source: Anderson ond Bonhaus, Reference 68.)


(a) Pressure coefficient distributions


(,b) Airfoil shapes


Figure 4.33 An example of airfoil optimized design using computational fluid dynamics (Reference 68).


image361

that supports the specified pressure distribution is obtained, as given by the circles in Figure 4.33b. The initial airfoil shape is also shown in constant scale in Figure 4.32.

The results given in Figures 4.32 and 4.33 are shown here simply to provide the flavor of modern airfoil design and analysis. This is reflective of the wave of future airfoil design procedures, and you are encouraged to read the contemporary literature in order to keep up with this rapidly evolving field. However, keep in mind that the simpler analytical approach of thin airfoil theory discussed in the present chapter, and especially the simple practical results of this theory, will continue to be part of the whole “toolbox” of procedures to be used by the designer in the future. The fundamentals embodied in thin airfoil theory will continue to be part of the fundamentals of aerodynamics and will always be there as a partner with the modern CFD techniques.

The Basic Normal Shock Equations

Consider the normal shock wave sketched in Figure 8.3. Region 1 is a uniform flow upstream of the shock, and region 2 is a different uniform flow downstream of the shock. The pressure, density, temperature, Mach number, velocity, total pressure, total enthalpy, total temperature, and entropy in region 1 are p, p, 7), M, u, po,, ho, і, 7’o. i, and ^|, respectively. The corresponding variables in region 2 are denoted by p2, Pi, T2, M2, u2, po,2, ho,2, ?o,2, and s2. (Note that we are denoting the magnitude of the flow velocity by и rather than V; reasons for this will become obvious as we progress.) The problem of the normal shock wave is simply stated as follows: given the flow properties upstream of the wave (p, Tu M, etc.), calculate the flow properties (p2, T2, M2, etc.) downstream of the wave. Let us proceed.

Consider the rectangular control volume abed given by the dashed line in Figure 8.3. The shock wave is inside the control volume, as shown. Side ab is the edge view of the left face of the control volume; this left face is perpendicular to the flow, and its area is A. Side cd is the edge view of the right face of the control volume; this right face is also perpendicular to the flow, and its area is Л. We apply the integral form of conservation equations to this control volume. In the process, we observe three important physical facts about the flow given in Figure 8.3:

1. The flow is steady, that is, 9/9f = 0.

2. The flow is adiabatic, that is, q = 0. We are not adding or taking away heat from the control volume (we are not heating the shock wave with a Bunsen burner, for

Figure 8*3 Sketch of a normal wave.

example). The temperature increases across the shock wave, not because heat is being added, but rather, because kinetic energy is converted to internal energy across the shock wave.

3. There are no viscous effects on the sides of the control volume. The shock wave itself is a thin region of extremely high velocity and temperature gradients; hence, friction and thermal conduction play an important role on the flow structure inside the wave. However, the wave itself is buried inside the control volume, and with the integral form of the conservation equations, we are not concerned about the details of what goes on inside the control volume.

4. There are no body forces; f = 0.

The Basic Normal Shock Equations Подпись: [8.1]

Consider the continuity equation in the form of Equation (7.39). For the condi­tions described above, Equation (7.39) becomes

To evaluate Equation (8.1) over the face ab, note that V is pointing into the control volume whereas dS by definition is pointing out of the control volume, in the opposite direction of V; hence, V • dS is negative. Moreover, p and |V| are uniform over the face ab and equal to p and u, respectively. Hence, the contribution of face ab to the surface integral in Equation (8.1) is simply — pUA. Over the right face cd both V and dS are in the same direction, and hence V • dS is positive. Moreover, p and | V| are uniform over the face cd and equal to pn and «2, respectively. Thus, the contribution of face cd to the surface integral is P2U2A. On sides be and ad, V and dS are always perpendicular; hence, V • dS = 0, and these sides make no contribution to the surface

integral. Hence, for the control volume shown in Figure 8.3, Equation (8.1) becomes

Подпись: or Подпись: Pi «1 = p2u2 Подпись: [8.2]

Pi Mi A + p2u2A = 0

Equation (8.2) is the continuity equation for normal shock waves.

Consider the momentum equation in the form of Equation (7.41). For the flow we are treating here, Equation (7.41) becomes

Подпись: sПодпись: simage525[8.3]

Equation (8.3) is a vector equation. Note that in Figure 8.3, the flow is moving only in one direction (i. e., in the x direction). Hence, we need to consider only the scalar x component of Equation (8.3), which is

image526[8.4]

In Equation (8.4), (p dS)x is the x component of the vector (p dS). Note that over the face ab, dS points to the left (i. e., in the negative x direction). Hence, (p dS)x is negative over face ab. By similar reasoning, (p dS)x is positive over the face cd. Again noting that all the flow variables are uniform over the faces ab and cd, the surface integrals in Equation (8.4) become

Подпись: [8.5]

Подпись: or Подпись: Pi + Pll = p2 + p2u Подпись: [8.6]

P(-uA)u + p2(u2A)u2 — —(—pA + p2A)

Equation (8.6) is the momentum equation for normal shock waves.

Consider the energy equation in the form of Equation (7.43). For steady, adia­batic, inviscid flow with no body forces, this equation becomes

Подпись: s [8.7]

image528

Evaluating Equation (8.7) for the control surface shown in Figure 8.3, we have

Rearranging, we obtain

Подпись: El Pi Подпись: ■ ei Подпись: P2 . «2 — + Є2 + ~ Рг 2 Подпись: [8.9]

Dividing by Equation (8.2), that is, dividing the left-hand side of Equation (8.8) by PU and the right-hand side by P2U2, we have

From the definition of enthalpy, h = e + pv = e + р/р. Hence, Equation (8.9) becomes

[8.10]

Equation (8.10) is the energy equation for normal shock waves. Equation (8.10) should come as no surprise; the flow through a shock wave is adiabatic, and we derived in Section 7.5 the fact that for a steady, adiabatic flow, ho = h + Vі/2 = const. Equation (8.10) simply states that ho (hence, for a calorically perfect gas Го) is constant across the shock wave. Therefore, Equation (8.10) is consistent with the general results obtained in Section 7.5.

Подпись: Continuity: Momentum: Energy: The Basic Normal Shock Equations Подпись: [8.8] [8.6] [8.10]

Repeating the above results for clarity, the basic normal shock equations are

Examine these equations closely. Recall from Figure 8.3 that all conditions upstream of the wave, pi, «і, Pi, etc., are known. Thus, the above equations are a system of three algebraic equations in four unknowns, p2, U2, P2, and /12- However, if we add the following thermodynamic relations

Enthalpy: h2 = cpT2

Equation of state: p2 — P2RT2

we have five equations for five unknowns, namely, P2, U2, P2, ^2, and T2. In Section 8.6, we explicitly solve these equations for the unknown quantities behind the shock. However, rather than going directly to that solution, we first take three side trips as shown in the road map in Figure 8.2. These side trips involve discussions of the speed of sound (Section 8.3), alternate forms of the energy equation (Section 8.4), and compressibility (Section 8.5)—all of which are necessary for a viable discussion of shock-wave properties in Section 8.6.

Finally, we note that Equations (8.2), (8.6), and (8.10) are not limited to normal shock waves; they describe the changes that take place in any steady, adiabatic, inviscid flow where only one direction is involved. That is, in Figure 8.3, the flow is in the x direction only. This type of flow, where the flow-field variables are functions of x only [ p = p(x), и = u(x), etc.], is defined as one-dimensional flow. Thus, Equations (8.2), (8.6), and (8.10) are governing equations for one-dimensional, steady, adiabatic, inviscid flow.

Continuity Equation

In Section 2.3, we discussed several models which can be used to study the motion of a fluid. Following the philosophy set forth at the beginning of Section 2.3, we now apply the fundamental physical principles to such models. Unlike the above derivation of the physical significance of V • V wherein we used the model of a moving finite control volume, we now employ the model of a fixed finite control volume as sketched on the left side of Figure 2.11. Here, the control volume is fixed in space, with the flow moving through it. Unlike our previous derivation, the volume V and control surface S are now constant with time, and the mass of fluid contained within the control volume can change as a function of time (due to unsteady fluctuations of the flow field).

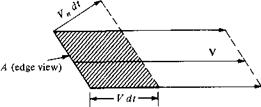
Before starting the derivation of the fundamental equations of aerodynamics, we must examine a concept vital to those equations, namely, the concept of mass flow. Consider a given area A arbitrarily oriented in a flow field as shown in Figure 2.16. In Figure 2.16, we are looking at an edge view of area A. Let A be small enough such that the flow velocity V is uniform across A. Consider the fluid elements with velocity V that pass through A. In time dt after crossing A, they have moved a distance V dt and have swept out the shaded volume shown in Figure 2.16. This volume is equal to the base area A times the height of the cylinder V„ dt, where V„ is the component of velocity normal to A; i. e.,

Volume = (V„dt)A

The mass inside the shaded volume is therefore

Подпись: [2.42]Mass = p(Vn dt)A

This is the mass that has swept past A in time dt. By definition, the mass flow through A is the mass crossing A per second (e. g., kilograms per second, slugs per second). Let m denote mass flow. From Equation (2.42).

. p{Vndt)A

m =——— :——

or


m = pVnA


[2.43]


image113

Figure 2.1 6 Sketch for discussion of mass flow through area A in a flow field.


Подпись: Area x density x component of flow velocity normal to the area

Equation (2.43) demonstrates that mass flow through A is given by the product

Подпись: Mass flux = — — pVn A Подпись: [2.44]

A related concept is that of mass flux, defined as the mass flow per unit area.

Typical units of mass flux are kg/(s • m2) and slug/(s • ft2).

The concepts of mass flow and mass flux are important. Note from Equation

(2.44) that mass flux across a surface is equal to the product of density times the component of velocity perpendicular to the surface. Many of the equations of aero­dynamics involve products of density and velocity. For example, in cartesian coor­dinates, V = Vxi + Vyj + Т, к = ui + uj 4- i/jk, where u, v, and w denote the x, y, and z components of velocity, respectively. (The use of u, v, and w rather than Vx, Vy, and V, to symbolize the x, у, and z components of velocity is quite common in aerodynamic literature; we henceforth adopt the u, v, and w notation.) In many of the equations of aerodynamics, you will find the products pu, pv, and pw always remember that these products are the mass fluxes in the x, y, and z directions, re­spectively. In a more general sense, if V is the magnitude of velocity in an arbitrary direction, the product p V is physically the mass flux (mass flow per unit area) across an area oriented perpendicular to the direction of V.

We are now ready to apply our first physical principle to a finite control volume fixed in space.

Doublet Flow: Our Third Elementary Flow

There is a special, degenerate case of a source-sink pair that leads to a singularity called a doublet. The doublet is frequently used in the theory of incompressible flow; the purpose of this section is to describe its properties.

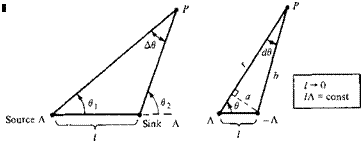
Consider a source of strength Л and a sink of equal (but opposite) strength —A separated by a distance /, as shown in Figure 3.24a. At any point P in the flow, the stream function is

A A r ,

t/r = —(0, – в2) =———— Ав [3.84]

2jt 2jt

where Ав = 02 — в as seen from Figure 3.24a. Equation (3.84) is the stream func­tion for a source-sink pair separated by the distance /.

Подпись: ф = lim /-*<) K—l AsaCOIlSt Подпись: A 2JT Подпись: [3.85]

Now in Figure 3.24a, let the distance / approach zero while the absolute magni­tudes of the strengths of the source and sink increase in such a fashion that the product lA remains constant. This limiting process is shown in Figure 3.24b. In the limit, as / -> 0 while lA remains constant, we obtain a special flow pattern defined as a doublet. The strength of the doublet is denoted by к and is defined as к = l A. The stream function for a doublet is obtained from Equation (3.84) as follows:

image241

where in the limit A6 d6 -> 0. (Note that the source strength A approaches an infinite value in the limit.) In Figure 3.24i>, let r and b denote the distances to point P from the source and sink, respectively. Draw a line from the sink perpendicular to r, and denote the length along this line by a. For an infinitesimal dG, the geometry

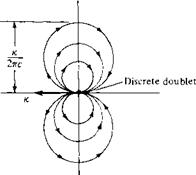
is a circle with a diameter d on the vertical axis and with the center located d/2 directly above the origin. Comparing Equations (3.89) and (3.90), we see that the streamlines for a doublet are a family of circles with diameter к/Ътс, as sketched in Figure 3.25. The different circles correspond to different values of the parameter c. Note that in Figure 3.24 we placed the source to the left of the sink; hence, in Figure 3.25 the direction of flow is out of the origin to the left and back into the origin from the right. In Figure 3.24, we could just as well have placed the sink to the left of the source. In such a case, the signs in Equations (3.87) and (3.88) would be reversed, and the flow in Figure 3.25 would be in the opposite direction. Therefore, a doublet has associated with it a sense of direction—the direction with which the flow

image242

Figure 3.25 Doublet flow with strength к.

moves around the circular streamlines. By convention, we designate the direction of the doublet by an arrow drawn from the sink to the source, as shown in Figure 3.25. In Figure 3.25, the arrow points to the left, which is consistent with the form of Equations (3.87) and (3.88). If the arrow would point to the right, the sense of rotation would be reversed, Equation (3.87) would have a positive sign, and Equation (3.88) would have a negative sign.

Returning to Figure 3.24, note that in the limit as l —> 0, the source and sink fall on top of each other. However, they do not extinguish each other, because the absolute magnitude of their strengths becomes infinitely large in the limit, and we have a singularity of strength (oo — oo); this is an indeterminate form which can have a finite value.

As in the case of a source or sink, it is useful to interpret the doublet flow shown in Figure 3.25 as being induced by a discrete doublet of strength к placed at the origin. Therefore, a doublet is a singularity that induces about it the double-lobed circular flow pattern shown in Figure 3.25.