Our heavyweight helicopter equal in the world does not have
In Rostov started production of the most load-lifting rotary-wing car The Russian holding «Helicopt[...]

Everything about aircrafts and helicopters. News and events in aviation worldwide. Civil, transportation, military helicopters and airplanes.

Everything about aircrafts and helicopters. News and events in aviation worldwide. Civil, transportation, military helicopters and airplanes.

Everything about aircrafts and helicopters. News and events in aviation worldwide. Civil, transportation, military helicopters and airplanes.

Everything about aircrafts and helicopters. News and events in aviation worldwide. Civil, transportation, military helicopters and airplanes.


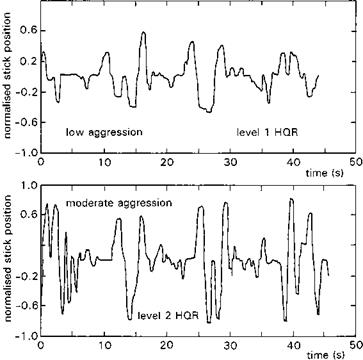
The chief attributes of agility are speed, precision and safety and all can be eroded by the increased difficulties of the operational situation. Not only the time pressures, but also the atmospheric conditions (e. g., gustiness) and UCE (see Section 2.2) will affect the agility factor and achieved HQRs significantly. In many of these cases there is a close correlation between pilot control activity, task difficulty and pilot rating, and in such cases the level of control activity can be related to pilot workload. Figure 2.45 shows the pilot’s lateral cyclic control for two different levels of aggression when flying a slalom MTE on the DRA’s advanced flight simulator (AFS); the details of this and other experiments will be provided in Chapter 7, but for now the varying frequency and amplitude levels are highlighted. The HQR levels are also noted on the legend,
|
Fig. 2.45 Time histories of lateral cyclic in a lateral slalom MTE |
|
|
indicating the degradation from Level 1 to 2 as the aggression is increased. In the case shown, the degradation corresponds to a task bandwidth increase.
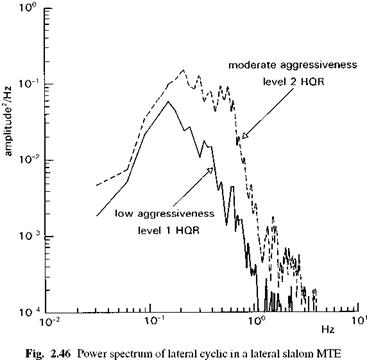
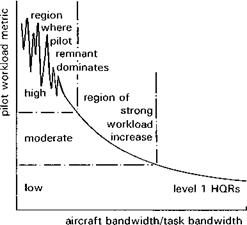
Another way of representing the pilot control activity is in the frequency domain, and Fig. 2.46 illustrates the power spectral density function for the lateral cyclic, showing the amount of control ‘energy’ applied by the pilot at the different frequencies. The marked increase in effort for the higher aggression case is evident, particularly above 1.5 Hz. There is evidence that one of the critical parameters as far as the pilot workload is concerned is the ratio of aircraft bandwidth to task bandwidth. The latter is easy to comprehend for an aircraft flying, for example, a sinusoidal slalom, when the task bandwidth is related to the ground track geometry and the aircraft ground speed. Bandwidths for more angular MTE tracks are less obvious, but usually some ratio of speed, or mean speed, to distance will suffice. Figure 2.47 illustrates conceptually the expected trend. A workload metric, e. g., rms of control activity or frequency at which some proportion of the activity is accounted for, is plotted against the bandwidth ratio. As the ratio increases one expects the pilot’s task to become easier, as shown. Conversely, as the ratio reduces, through either reduced aircraft bandwidth or increased task bandwidth, workload increases. There is a point at which the workload increases significantly, corresponding perhaps to pilot-induced oscillation onset, when the metric may no longer correlate with workload and where the control strategy is dominated by the so-called remnant, often reflecting confusion and a breakdown of the pilot acting as a quasi-linear element responding to task cue errors. Being able to detect incipient breakdown is important for establishing flying qualities boundaries and also for giving a pilot some advance warning of a potential high workload situation. Research in
|
Fig. 2.47 Conceptual relationship between pilot workload and the bandwidth ratio |
this field is still relatively immature, and most experiments rely heavily on subjective pilot opinion. To the author’s knowledge, there are no reliable workload meters, the human equivalent of a mechanical health and usage monitoring system (HUMS), used in operational service.
The DRA tests described above were part of a larger research programme aimed at providing a better understanding of the flying qualities deficiencies of current military types and quantifying future requirements. Of special interest was the impact of flying qualities on agility; the concept of agility will be developed further in Chapter 7 but, for this introductory Tour, a suitable definition is (Ref. 2.38)
the ability to adapt and respond rapidly and precisely with safety and with poise, to
maximize mission effectiveness.
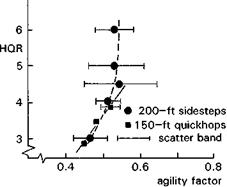
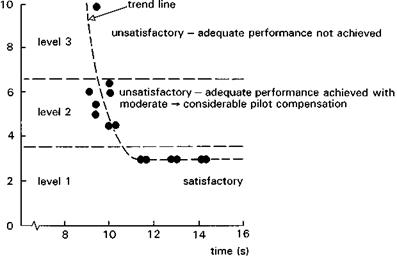
A key question that the results of the above research raised concerned how the agility might be related to the flying qualities. One interpretation the author favours is that agility is indeed a flying quality. This is supported by the concept of the agility factor: if the performance used in a particular MTE could be normalized by the performance inherently available in the aircraft, then in the limit, this ratio would reveal the extent of usable performance. A more convenient way of computing this factor is to take the ratio of the theoretically ideal task time with the achieved task time. The ideal time is computed based on the assumption that the time to maximum acceleration is zero. So in the sidestep, or any similar lateral translational manoeuvre for example, the bank angle changes are achieved instantaneously. In a pure bank and stop manoeuvre, the roll rate would be assumed to develop instantaneously. The agility factor is useful for comparing the inherent agility of configurations with the same performance or competing to meet the same performance requirements. The calculation procedure and some of the factor’s nuances will be elaborated on in Chapter 7. The Puma sidestep and quickhop MTE data converted to agility factors are shown with the HQRs in Fig 2.44. The trends shown previously in the time plots now appear even more dramatic; maximum agility factors for the Puma of 0.5-0.6 are achievable with borderline Level 2/3 HQRs only. The pilot can barely attain the adequate performance level, even with considerable workload. These tests were conducted in a clinical environment, with well-defined ground features and flown by skilled test pilots with opportunity to
|
Fig. 2.44 HQRs versus agility factor for the Puma flying sidestep and quickhop MTEs |
practice. In a real-world situation, the increased workload from other duties and the uncertainties of rapidly changing circumstances would inevitably lead to a further loss of agility or the increased risks of operation in the Level 3 regime; the pilot must choose in favour of safety or performance.
In agility factor experiments, the definition of the level of manoeuvre attack needs to be related to the key manoeuvre parameter, e. g., aircraft speed, attitude, turn rate or target motion. By increasing attack in an experiment, we are trying to reduce the time constant of the task, or reduce the task bandwidth. It is sufficient to define three levels – low, moderate and high, the lower corresponding to normal manoeuvring, and the upper to emergency manoeuvres.
A combination of deficiencies in vehicle dynamics, the need for the pilot to monitor carefully critical parameters for proximity to flight limits, the poor outside visual references at high aircraft attitude angles and the overall pilot stress induced by the need to fly a tightly constrained flight path very close to the ground result in a Level 2/3 ‘situation’. Of course, the Puma, as a medium support helicopter, was not designed to fly 200-ft sidesteps in 8 s – the approximate limit for the test configuration. Nevertheless, pilots were inhibited from using the full performance (bank angles of 30° were the maximum measured) and many of the pilots’ concerns are common to other types. A similar pattern emerged for the Lynx in the DRA tests and on aircraft used in trials conducted by the US Army (Ref. 2.37) during the same period. Also, the same trend appears for other MTEs, and is considered to represent a fundamental challenge to designers. Close to, say, within 20% of vehicle limits, it appears that the ‘edge’ is reached in several ways at the same time; flying qualities deficiencies are emerging strongly, just when the pilot has the greatest need for safe and predictable, or carefree, handling. The concept of carefree handling has been a familiar reality in aeroplane designs for some years, protecting against spin departure (e. g., Tornado) or deep stall (e. g., F-16) for example, but is yet to be implemented, at least in an active form, in helicopters. At the time of writing, another form of carefree handling, providing structural load alleviation, is being built into the computers of the fly-by-wire control system in the V22 Osprey. This topic is returned to in Chapter 7.
Flying qualities parameters need to be physically meaningful and measurable. Assembled together as a requirement specification, they need to embrace the CACTUS rules (Ref. 2.35) outlined later in Chapter 6. Also in Chapter 6, the range of different criteria and the measurement of associated parameters in flight and simulation will be critically reviewed in the light of these underlying requirements. It needs to be re-emphasized that in most functional roles today, both military and civil helicopters need some form of artificial stability and control augmentation to achieve Level 1 flying qualities, which therefore become important drivers for both bare-airframe and automatic flight control system (AFCS) design. Before exploring the scope for artificial augmentation on this Tour, it is worth illustrating just how, in a demanding and fully attentive flying task, an MTE, flying qualities deficiencies can lead to reduced task performance and increased pilot workload.
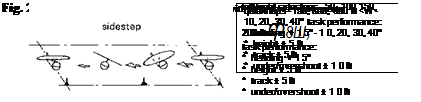 |
Test techniques for the demonstration of flying qualities compliance need to exercise the aircraft to the limits of its performance. Figure 2.42 illustrates two NoE, hover to hover, repositioning manoeuvres: the quickhop and the sidestep. Tests conducted at the DRA Bedford in the mid-1980s demonstrated the importance of the task urgency or aggression factor (Ref. 2.36) on pilot workload and task performance. The manoeuvres were flown at increasing levels of aggression until the shortest possible task time was achieved. Start and finish position constraints, together with a height/track corridor, defined the acceptable flight path. Performance was increased by increasing the initial pitch or roll angle, to develop the maximum translational acceleration; both test aircraft, Lynx and Puma, were operated at relatively low weights allowing for accelerations over the ground of greater than 0.8 g (~40° roll/pitch) corresponding to a hover thrust margin of about 30%. Figure 2.43 shows the recorded pilot HQRs as a function of task time for a Puma flying a 200-ft (60 m) sidestep. Above 11 s the pilot returned marginal Level 1 ratings; any reduction in task time below this resulted
|
Fig. 2.43 Variations of pilot HQRs with task time for Puma 200-ft sidestep |
in increasing workload. In fact, the pilot was unable to reduce the task time below 9 s and still achieve the flight path performance requirements. On one occasion the wheels hit the ground during the final recover to the hover; the pilot was applying full lateral cyclic, collective and pedal control, but, as a result of the roll and engine/rotorspeed governor response characteristics, the manoeuvre was not arrested in time. The low kinetic energy of the aircraft meant that no structural damage was incurred, but the pilot judged that he was ‘out of control’ and returned an HQR of 10 (Fig. 2.43).
For the small amplitude, higher frequency end of the response spectrum, two classic measures of quality – the step response character and low-order-equivalent system (LOES) response – have proved deficient for capturing the important features that relate to tracking and pursuit-type tasks in helicopters. The equivalent systems approach adopted in the fixed-wing community has many attractions, but the rotorcraft’s non-classical response types really make the LOES a non-starter in most cases. Also, the detailed shape of the step response function appears to be sensitive to small imperfections in the control input shape and measurement inaccuracies. Strictly, of course, the small amplitude tracking behaviour should have little to do with the step response and much more to do with amplitude and phase at high frequency. Nevertheless, the direction taken by ADS-33, in this area, was clarified only after considerable debate and effort, and it is probably fair to say that there is still some controversy associated with the adoption of the so-called bandwidth criteria.
For simple response types, maximum quickness is actually a close approximation to this more fundamental handling qualities parameter – bandwidth (Ref. 2.32). This parameter will be discussed in more detail in Chapter 6, but some elaboration at this point is worthwhile. The bandwidth is that frequency beyond which closed-loop stability is threatened. That may seem a long step from the preceding discussion, and some additional exposure is necessary. For any closed-loop tracking task, the natural delays in the pilot’s perceptual pathways, neuro-muscular and psycho-motor systems (Ref. 2.33), give rise to increasing control problems as the disturbance frequency increases. Without the application of pilot control lead, the closed-loop pilot/aircraft system will gradually lose stability as the pilot gain or disturbing frequency increases. The point of instability is commonly referred to as the crossover frequency and the bandwidth frequency corresponds to some lower value that provides an adequate stability margin. In practice, this is defined as the highest frequency at which the pilot can double his gain or allow a 135° phase lag between control input and aircraft attitude response without causing instability. The higher the bandwidth, the larger will be the aircraft’s safety margin in high gain tracking tasks, but just as we have implied a possible upper limit on the quickness, so bandwidth may be limited by similar overresponsiveness.
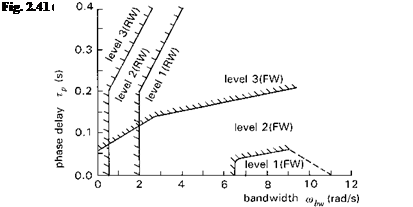
We have introduced some new flying qualities parlance above, e. g., crossover, perceptual pathways, gain and lead/lag, and the reader will need to carry these concepts forward to later chapters for elaboration. The whole question of short-term attitude control has been discussed at some length because of its critical importance to any flying task; changing attitude tilts the rotor thrust vector and reorients the aircraft and hence the flight path vector. It is not surprising that handling criteria are most substantially developed on this topic. For the case of small amplitude, high-frequency pitch motions (see Fig. 2.37), bandwidth criteria have been developed for both fixed- and rotary-wing aircraft. For both types of aircraft the criteria are displayed in two-parameter form with the phase delay parameter, Tp. Phase delay relates to the rate of change of phase with frequency above the crossover frequency and is also a measure of the equivalent time delay between attitude response and pilot control input. Fig. 2.41 tells a similar story to the comparison of fixed – and rotary-wing criteria for mid-term stability (cf. Fig. 2.39); there is a range in the Tp, rnbw plane where Level 1 helicopter characteristics correspond to Level 3 aeroplane characteristics. The boundaries in Fig. 2.41 are typical of the mission-oriented criteria found in modern specifications; they apply to air-combat tasks for helicopters and, more generally, to Category A flight phases for aeroplanes (see Ref. 2.3). They have been developed from the best available test data relating to current operational requirements. To a large extent, the striking differences between the fixed – and rotary wing relate directly to different task requirements; as yet, rotarywing aircraft have not been required to deliver the performance of their fixed-wing counterparts. On the other hand, it would be very difficult to confer such bandwidth performance on a conventional helicopter from an engineering point of view, so a large
degree of capability tailoring is inevitable. In later chapters, some of the configuration constraints and design limitations will be discussed in more detail.
Earlier, we dismissed equivalent low-order systems as being inadequate at characterizing helicopter attitude characteristics. While this is true for conventional helicopters without, or having limited authority, stability and control augmentation, future aircraft with task-tailored control laws can more usefully be described in this way. Later, in Chapters 6 and 7, we shall introduce the conceptual simulation model (CSM, Ref. 2.34), which is, in effect, a greatly simplified helicopter model in LOES form. The assumption underlying this model structure is that with active control, the flying qualities can be tailored in a wide range of different forms described now by simple equivalent systems. Flying qualities research at DRA using the CSM has been ongoing since the early 1980s and has enabled many of the desirable characteristics of future helicopters with active control technology (ACT) to be identified. This theme will be pursued in the later flying qualities chapters.
There is one helicopter flying characteristic that can, at least for the limited frequency range associated with pilot control, be described in terms of a simple first – order response – the vertical or heave axis in the hover. While it is recognized that the vertical axis dynamics are dominated by air mass and flapping motion at higher frequency, below about 5 rad/s the vertical velocity response (h) to collective (Sc) can be described by the LOES:
![]()
 |
h _ Ke Theqs Sc Tf. s + 1
heq
This formulation characterizes the first-order velocity response as a transfer function, with gain or control power K and time delay Tf. The pure time delay Tf is an artifact included to capture any initial delay in achieving maximum vertical acceleration, e. g., due to rotor or air-mass dynamics. The acceptable flying qualities can then be defined in terms of the LOES parameters. Vertical axis flying qualities and flight path control in forward flight are also profoundly affected by the dynamic characteristics of the engine and rotorspeed governor system. Agile behaviour can be sustained only with rapid and
sustained thrust and torque response, both of which are dependent on fast powerplant dynamics. As usual there is a trade-off, and too much agility can be unusable and wasteful. This will be a recurring theme of Chapter 7.
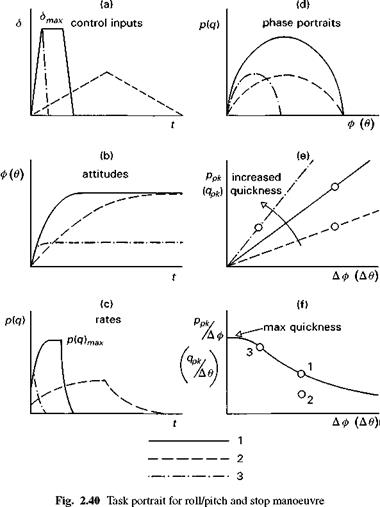
A pilot’s most immediate impressions of a helicopter’s flying qualities are likely to be formed as he or she attempts to maintain attitude and position in the hover, and later as the pilot manoeuvres and accelerates into forward flight. Here, the qualities of most interest are not the mid-long-term stability characteristics, but more the small-moderate-large amplitude, short-term response to control inputs (see Fig. 2.37). Consider the kinematics of a manoeuvre to change aircraft attitude. This may correspond, for example, to the initial phase of an acceleration from the hover (pitch) or a bank manoeuvre to turn in forward flight (roll). The so-called task portrait sketches in Fig. 2.40 illustrate the variations in pilot’s control inputs (a), the attitudes (b) and rates (c) and include the manoeuvre (phase plane) portrait (d) and task signature diagrams ((e) and (f)), corresponding to three different pilot control strategies. The example assumes a simple rate response type. Case 1 corresponds to the pilot applying maximum control input as rapidly as possible and stabilizing out with an attitude change. Case 2 corresponds to the pilot manoeuvring more gently to achieve the same attitude. Case 3 corresponds to the pilot applying a much sharper maximum-pulse input, achieving much the same rate as in case 2 but settling to a smaller final attitude. For the third case, the input is so sharp that the aircraft does not have time to reach its steady-state rate response. The three cases are distinguished by the degree of aggressiveness and the size of the pilot input, i. e., by different frequency and amplitude content. The task signature diagrams (e) and (f) are constructed by computing the peak rate, ppk, and associated attitude change Аф for the different manoeuvres; each represents a point on the diagram. The ratio of peak rate to attitude change, shown in Fig 2.40(f), is a key parameter. Designated the ‘quickness’ parameter in ADS-33, this ratio has a maximum achievable value for a given attitude change. For large manoeuvres, the limit is
* Pilot required to perform non-control-related sidetasks for a moderate period of time.
|
|
naturally set by the maximum achievable rate or the attitude control power, p(q)max; case 1 represents an example of such a situation. The quickness is a frequency measure and, for small amplitudes, represents the maximum ‘closed-loop’ frequency achievable from the aircraft. It is therefore, on the one hand, a measure of the inherent manoeuvre performance or agility of the aircraft and, on the other, a handling qualities parameter. If the maximum achievable quickness is too small, then the pilot may complain that the aircraft is too sluggish for tracking-type tasks; if the quickness is too high, then the pilot may complain of jerkiness or oversensitivity.
In the early days of helicopter testing, these differences were often a surprise to the fixed-wing test pilots. Research into helicopter flying qualities at the Royal Aircraft Establishment goes back to the 1940s when engineers and pilots were getting to grips with the theory and practice respectively. In these early days of helicopter research, one of the key concerns was stability, or rather the lack of it. Stewart and Zbrozek (Ref. 2.31) describe a loss-of-control incident on an S-51 helicopter at RAE in 1948. Quoting from the pilot’s report in the reference:
When the observer said he was ready with his auto-observer, I pushed the stick forward about six inches and returned it quickly to its original position. The aircraft continued in straight and level flight for approximately three to five seconds before it slowly started a phugoid motion, with the nose dropping away slightly in the first instance. Each oscillation became greater, i. e. the dive and climb becoming steeper with every oscillation; it was accompanied by roll, at the bottom of the dive during the ‘pull-out’, it had maximum bank to the right.
The observer intimated recovery action to be taken at the end of the third oscillation; as the aircraft came over the top from the climb to go into the dive, I eased the stick forward to help it over the top. The stick felt light and there appeared to be no additional response from the aircraft; as the aircraft commenced diving again, I eased the stick back to where I considered I had pushed it from, thinking that I would let the speed build up somewhat before easing the stick further back to pull out of the dive. Quite a steep dive developed and just as I was about to ease the stick back, probably three seconds after the previous stick movement, there was suddenly severe vibration throughout what seemed to be the whole machine. From then on until recovery was effected (I estimate five to ten seconds later), I have no clear recollection of what took place. I think that immediately after the vibration, the aircraft flicked sharply to the left and nearly on to its back; it then fell more or less the right way up but the fuselage was spinning, I think, to the right. It fell into a steep dive and repeated the performance again; I selected autorotation quite early during the proceedings. Once I saw the rotor rpm at 140, and later at 250. There
|
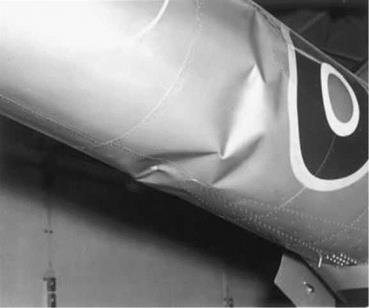
Fig. 2.38 Fuselage failure on Sikorsky S-51 (Ref. 2.31) |
were moments when the stick was very light and others when it was extremely heavy.
The machine, I think, did three of these manoeuvres; it seemed to want to recover during the second dive but it actually responded to the controls during the third dive. Height when straight and level was 400feet above sea level (height loss 800feet).
The aircraft responded normally to the controls when under control again; I flew back to the airfield and landed.
The pilot had excited the phugoid mode with a longitudinal cyclic pulse; recovery action was initiated at the end of the third oscillation, the aircraft increased speed in a dive and during the pull-out the blades hit the droop stop, and eventually the fuselage, causing a rapid uncontrollable rolling motion. The resulting erratic motions, during which the pilot became disoriented, eventually settled down and the aircraft was flown back to RAE and landed safely. The ‘auto-observer’ recorded a peak normal acceleration of more than 4 g during the manoeuvre, causing severe buckling to occur in the rear fuselage (Fig. 2.38). Two of the conclusions of the analysis of this incident were
(1) ‘… large rapid movements of the controls are to be avoided, particularly at high speed’.
(2) ‘some form of flight testing technique should be devised whereby the susceptibility of a helicopter to this trouble should be ascertained in the prototype stage’.
These conclusions are as relevant today as they were in the early days of helicopter flight testing; the ‘trouble’ noted above is still a feature of unaugmented helicopters. Today, however, there exist flying qualities criteria that define the boundaries of
|
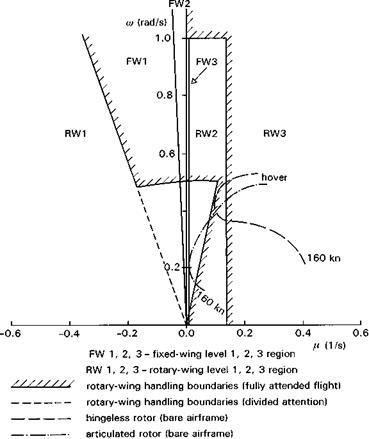
Fig. 2.39 Long period pitch stability characteristics |
acceptable mid-term pitch characteristics. Figure 2.39 illustrates the frequency/ damping requirements set down in ADS-33; the Level 1/2 and 2/3 boundaries are shown for both helicopters and fixed-wing aircraft (Ref. 2.3) for ‘fully attended’ flight. Also included are the loci of characteristics for the two baseline simulation configurations, Helisim Lynx and Helisim Puma, in bare airframe or unstabilized configurations. Several points can be drawn out of this figure. First, there is a range where characteristics that are acceptable as Level 1 for helicopters are classified as Level 3 for fixed-wing aircraft. Secondly, for most of their flight envelopes, our two Helisim aircraft will not even meet the Level 3 requirements of the fixed-wing criteria. The fact is that it is impossible to build helicopters that, without augmentation, meet the fixed-wing standards; earlier in this chapter we discussed one of the reasons for this concerning the positive stability derivative Mw. But this is not a good reason for degrading the boundaries for safe flight. On the contrary, the boundaries in Fig. 2.39 are defined by flight results, which implies that rotary-wing pilots are willing to accept much less
Pilot can devote full attention to attitude and flight path control.
than their fixed-wing counterparts. Hoh, in Ref. 2.4, has suggested two reasons for this:
(1) ‘helicopter pilots are trained to cope with, and expect as normal, severe instabilities and cross-axis coupling;’ and
(2) ‘the tasks used in the evaluations were not particularly demanding’.
The two reasons go together and helicopters could not be used safely for anything but gentle tasks in benign conditions until feedback autostabilization could be designed and built to suppress the naturally divergent tendencies.
Included in Fig. 2.39 is the helicopter boundary for ‘divided attention’ operations; this eliminates all unstable machines by requiring a damping ratio of 0.35. Thus, helicopters that need to operate in poor weather or where the pilot has to release the controls, or divert his attention to carry out a secondary task, need some form of artificial stabilization. This conclusion applies to both military and civil operations, the increased emphasis on safety for the latter providing an interesting counterpoint; criteria for civil helicopter flying qualities will be discussed further in Chapter 6.
The S-51 incident described above illustrates two important consequences of flying qualities deficiencies – that pilot disorientation and aircraft strength are the limiting factors, i. e., the things that eventually ‘give’, and can therefore terminate the situation following loss of control. This is the key to understanding that good flying qualities are ‘mission critical’.
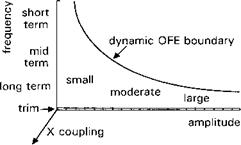
At a deeper level the response types themselves can be classified further in terms of their frequency and amplitude characteristics, a perspective that we found useful in the modelling discipline described in the previous stop on this Tour. Figure 2.37 illustrates the structure, with the response classified into three levels of amplitude (small, moderate and large) and three frequency ranges, corresponding to long-, mid – and short-term behaviour. The zero frequency motion is identified as the trim line. In recognition of the multitude of cross-couplings inherent to helicopters, we have added the third dimension on the figure; to date, the criteria for cross-coupling requirements are considerably more immature than for the direct response. The boundary curve in the figure indicates the limits to practical flying, with higher frequency attitude and flight path motions restricted to small amplitude, and large amplitude motions restricted to
|
Fig. 2.37 Frequency and amplitude characterization of aircraft response |
the lower frequency range. This representation will provide a convenient structure for developing quantitative response criteria later in Chapter 6.
Typical helicopter characteristics can now be discussed within the framework of this response-type classification. An unstable, low-frequency oscillation involving changes in speed and height characterizes the mid-long term, small amplitude response and stability of helicopter pitch motion. This mode can take the formof a mildly unstable pendulum-type motion in the hover, to a rapidly divergent ‘phugoid’ oscillation at high speed. Aircraft design and configuration parameters, e. g., cg location, rotor type and tailplane design, can have a marked effect on the stability of this mode in forward flight. At forward cg extremes, the oscillation can stabilize at moderate speeds, whereas with aft cg loadings for some configurations, particularly hingeless rotors or helicopters with small horizontal tailplanes, the oscillation can ‘split’ into two aperiodic divergences at high speed, with time to double amplitude less than 1sin severe cases. The mode differs from the fixed-wing ‘phugoid’ in that speed changes during the climbs and dives induce pitching moments, which cause significant variations in fuselage and rotor incidence and thrust.
While pilot-subjective opinion will always be the deciding factor, quantitative criteria are needed as design targets and to enable compliance demonstration throughout the design and certification phases. The most comprehensive set of requirements in existence is provided by the US Army’s Aeronautical Design Standard for handling qualities – ADS-33 (Ref. 2.1), which will be referred to regularly throughout this text, particularly in Chapters 6, 7 and 8. During the initiation of these requirements, it was recognized that new criteria were urgently needed but could only ever be as valid as the underlying database from which they were developed. Hoh (Ref. 2.4), the principal author of ADS-33, commented that key questions needed to be asked of any existing test data.
(1) Were the data generated with similar manoeuvre precision and aggressiveness required in current and future operational missions?
(2) Were the data generated with outside visual cues and atmospheric disturbances relevant to and consistent with current operations?
Most of the existing data at that time (early 1980s) were eliminated when exposed to the scrutiny of these questions, and the facilities of several NATO countries were harnessed to support the development of a new and more appropriate database, notably
Canada (NAE, Ottawa), Germany (DLR, Braunschweig), UK (DRA Bedford, then RAE) and, of course, the United States itself, with the activity orchestrated by the US Army Aeroflightdynamics Directorate at the Ames Research Center.
The criteria in ADS-33 have been validated in development and any gaps represent areas where data are sparse or non-existent. To quote from ADS-33:
The requirements of this specification shall be applied in order to assure that no limitations on flight safety or on the capability to perform intended missions will result from deficiencies in flying qualities.
For flight within the OFE, Level 1 handling qualities are required. Three innovations in ADS-33 requiring specification to ensure Level 1 handling are the mission task element (MTE), the usable cue environment (UCE) and the response type (e. g., rate command, attitude hold – RCAH). These can be seen to relate directly to three of the reference points discussed earlier in this chapter. Referring to Fig. 2.13 we see how, for slalom and sidestep MTEs, rate command response types are deemed adequate to provide Level 1 pitch or roll handling qualities for flight in conditions of a UCE 1. For low-speed operations however, the response type will need upgrading to attitude command, attitude hold (ACAH) for flight in the degraded visual environment of a UCE 2, while a translational rate command with position hold (TRCPH) is needed for flight in the IMC – like UCE 3. The task, the environment and the aircraft dynamics therefore interact to determine the flying qualities.
The scale, shown in summarized form in Fig. 2.35, is divided into three ‘levels’; the crucial discriminators are task performance and pilot workload. Pilot handling quality ratings (HQR) are given for a particular aircraft configuration, flying a particular task under particular environmental conditions; these points cannot be overemphasized. Some projection from the ‘simulated’ experimental test situation to the operational situation will be required of the test pilot, but extrapolation of handling qualities from known to new conditions is generally unacceptable, which explains why compliance testing needs to be comprehensive and can be so time consuming.
The rating scale is structured as a decision tree; requiring the pilot to arrive at his or her ratings following a sequence of questions/answers, thoughtful considerations and, possibly, dialogue with the test engineer. A Level 1 aircraft is satisfactory without improvement, and if this could be achieved throughout the OFE and for all mission tasks, then there should never be complaints concerning the piloting task. In practice, there has probably never been an aircraft this good, and Level 2 or even, on occasions, Level 3 characteristics have been features of operational aircraft. With a Level 2 aircraft, the pilot can still achieve adequate performance, but has to use moderate to extensive compensation and, therefore, workload. At the extreme of Level 2 (HQR 6) the mission is still flyable, but the pilot has little spare capacity for other duties and will not be able to sustain the flying for extended periods without the dangers that come from fatigue, i. e., the attendant safety hazards that follow from the increased risk of pilot error. These are the penalties of poor flying qualities. Beyond Level 2, the unacceptable should never be allowed in normal operational states, but this category is needed to describe the behaviour in emergency conditions associated with flight in severely degraded atmospheric conditions or following the loss of critical flight systems.
|
Fig. 2.36 Presentation of pilot handling qualities ratings showing variation with task, environmental or configuration parameter |
The dilemma is that while performance targets can be defined on a mission requirement basis, the workload, and hence rating, can vary from pilot to pilot. The need for several opinions, to overcome the problem of pilot variability, increases the duration of a test programme and brings with it the need to resolve any strong differences of opinion. Pilot ratings will then typically be displayed as a mean and range as in Fig. 2.36. The range display is vital, for it shows not only the variability, but also whether the opinions cross the levels. Half ratings are allowed, except the 3.5 and 6.5 points; these points are not available when the pilot follows the HQR decision sequence properly (Fig. 2.35).