Our heavyweight helicopter equal in the world does not have
In Rostov started production of the most load-lifting rotary-wing car The Russian holding «Helicopt[...]

Everything about aircrafts and helicopters. News and events in aviation worldwide. Civil, transportation, military helicopters and airplanes.

Everything about aircrafts and helicopters. News and events in aviation worldwide. Civil, transportation, military helicopters and airplanes.

Everything about aircrafts and helicopters. News and events in aviation worldwide. Civil, transportation, military helicopters and airplanes.

Everything about aircrafts and helicopters. News and events in aviation worldwide. Civil, transportation, military helicopters and airplanes.


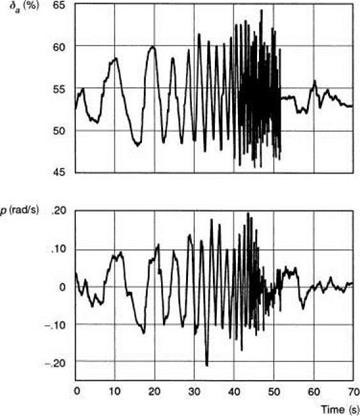
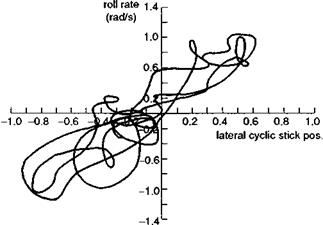
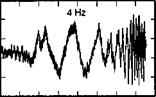
One of the failings of time domain criteria arises when trying to make accurate measurements of the rise times in the step response. While it is relatively easy and economical to apply a step input, the shapes of the rate and attitude response are very sensitive to the detailed form of the control input, and aircraft initial conditions. Errors in rise time computation, particularly for the smaller values (O(0.1 s)), can be large. Since the significant handling qualities parameter is actually the slope of the phase, any errors in rise time calculation will reflect in a poor estimation of the high frequency phase. On the other hand, the frequency response function is fairly robust to analysis, although considerably more calculation effort is required, and frequency response data are more difficult and far more time consuming to capture in flight test. Since the first publication of ADS-33 in the mid-1980s, considerable experience has been gained in the measurement of bandwidth and phase delay in flight (Refs 6.40-6.49). The recommended test input is a sine wave form with gradually increasing frequency applied at the pilot’s controls. Figure 6.34 illustrates a roll axis frequency ‘sweep’
|
Fig. 6.34 Roll axis frequency sweep for Bo105 (Ref. 6.43) |
showing the pilot’s control position and aircraft roll rate response for the Bo105 from a test speed of 80 knots. The test manoeuvre is complete in about 1 min, the pilot uses about 10-15% of the control range and the roll rate is contained within the range ±20o/s.
From the accumulated knowledge of frequency sweeping, a number of rules of thumb can be applied when designing and conducting a flight test. These concern both safety and performance aspects and are now addressed in turn.
(1) Frequency range The range of frequencies covered in the sweep need only be high enough to capture the phase characteristics up to twice the 180o phase lag frequency. Unfortunately, this latter frequency may not be known precisely prior to the test, and experience has shown that it can vary widely across different types, e. g., 22 rad/s on the Bo105 (Ref. 6.43) and 12 rad/s on the OH-58D (Refs 6.41, 6.42). Also, there may be only limited data available on the airframe/rotor structural modes within this frequency range. It is therefore very important to establish the upper frequency limit and the influence on structural modes very carefully with exploratory test inputs before applying a full frequency sweep. Reference 6.42 recommends a frequency range of 0.1-2 Hz, but clearly this is inadequate for higher bandwidth helicopters like the Bo105.
(2) Maintaining trim – instability One of the principal problems with the frequency sweeping of helicopters without stability augmentation is their natural tendency to diverge from the trim condition, particularly during the low-frequency portion of the sweep input. If this is allowed to happen, then clearly the validity of the data is questionable; the engineer can no longer relate the computed bandwidth to a particular flight condition, and nonlinear effects are likely to spoil the overall quality of the data. The pilot needs to apply ‘uncorrelated’ corrective inputs, superimposed on the sweep, to keep the aircraft manoeuvring about the trim condition. This can sometimes be very difficult if not impossible to accomplish satisfactorily, particularly close to hover or for pitch axis sweeps at high speed. In cases where the natural stability of the aircraft is so poor that frequency sweeping is not practicable, then it may well be necessary to deduce the open-loop, bare-airframe, characteristics from sweep results with the SCAS engaged.
(3) Cross-coupling While cross-coupling, in itself, is not a problem during frequency sweeping, it has become a practice for pilots to negate the cross-coupled motion with control inputs, primarily to preserve the mean trim condition. For example, the pitch and yaw moments generated during a roll sweep can soon give rise to large flight – path excursions. Even assuming the pilot is able to apply perfect cancelling inputs there are two data contamination effects that will need to be taken into account. First, the roll response will no longer be due to the lateral cyclic only, but there will be components at various frequencies due to the cross-control inputs. These can, in principle, be extracted using conditional frequency analysis (see below), effectively deriving the secondary frequency characteristics as well as the primary. Second, any correlation between the primary and secondary control inputs will make it very difficult to separate out the primary frequency response, even using the conditional techniques. As noted above, one solution is to apply corrective cross-coupled control inputs that are uncorrelated with the primary axis, e. g., occasional pulse-type inputs to recover airspeed, pitch attitude or sideslip.
(4) Control amplitude The magnitude of the control input is a compromise between achieving the highest signal-to-noise ratio to maximize the information content, and minimizing the excursions from trim and the potential for exciting dangerous loads. It has been found that there is a natural tendency for the inexperienced pilot to increase the control amplitudes as the frequency increases, in order to maintain the same overall amplitude of aircraft response. This should reduce with training (see point (7)). A general rule of thumb is that the control inputs should be kept to within ±10% of full control throw.
(5) Repeats Repeat runs are always required in flying qualities tests to ensure that at least one good data point is captured; for frequency sweeping, the recommended minimum number of repeats is two, to provide at least two quality runs for averaging in the frequency analysis.
(6) Duration The time duration of a frequency sweep depends on the frequency range to be covered, primarily the lower limit, and the rate of change of frequency. Assuming the latter to be about 0.1 Hz, experience has shown that sweep durations between 50 and 100 s are typical. Constraining factors will be the natural stability of the aircraft, influencing the time spent at low frequencies, and the rotor speed, largely influencing the upper limit.
(7) Training and practice One of the most important safety factors that can be included in a frequency sweep test programme is an adequate level of training for pilots. First, there is the simple matter of training pilots to apply a slowly varying sine wave with an amplitude of perhaps ±1 cm. Experience has shown that pilots new to sweeping tend to increase the amplitude of the controls as the frequency increases and they are not always aware that this is happening. Also, it is very difficult for a pilot to judge what is a 2-, 3- or 4-Hz input without experience. Ideally, the pilot would initiate his or her training by following through on the controls while the instructor applied the sweep with the aircraft on the ground. Sweeps on all controls could be taught this way to give the pilot a feel for the kind of hand and feet motion required. The pilot could then practice with a display providing feedback on the frequency and amplitude. After the trainee pilot is confident in his or her ability to apply the input shape, the training can continue in the simulator and eventually in flight, where the pilot needs to practice before the definitive inputs are made. Practising gives the pilot knowledge about what corrective inputs are required in other axes to maintain the aircraft close to the reference flight condition. Practising also allows the engineers conducting the structural loads monitoring to guide the trial better. But pilot-applied frequency sweeps are best done with two crew, one applying the input, the other calling the tune.
(8) Manual or automated inputs – it takes two to sweep In theory, it should be possible to design a frequency sweep for application through an automatic control input device that has superior properties to a manual input, e. g., repeatability, and better defined frequency content. However, the sweeping experience to date, especially with unstabilized helicopters, indicates that manual inputs are to be preferred, because of the increased flexibility in uncertain situations; and the more irregular shapes to the manual inputs actually have a richer information content. This situation has to improve in favour of the auto-inputs with time, but it should be remembered that the bandwidth frequency relates to the attitude response to the pilot’s stick input and not to the control servo input. With auto-inputs applied at the servo actuator, the additional transfer function between stick and servo would still need to be determined. Experience at the DRA with manual frequency sweeping has emphasized the value of the second crew member providing timing assistance to the pilot by counting out with rhythm, particularly at the lower frequencies. Counting out periods of 20, 16, 12, 8, 4 and 2 s helps the pilot to concentrate on applying a series of sine waves at increasing frequencies. At higher frequencies the pilot needs to rely on a learned technique, the counting then being a significant distraction.
(9) Load monitoring for structural resonances Frequency sweeping can damage a helicopter’s health and it is important to take this warning seriously. However, with the right preparations and precautions, the damage can be controlled and quantified. Some of the precautions have already been discussed under the headings of frequency range and amplitude, but it is important to know as much as possible about potential structural resonances before embarking on this kind of test input. In the case of a new aircraft, it is prudent to establish the rotor/fuselage coupled modes using the structural test development aircraft prior to making the bandwidth measurements. However, most of the testing carried out in the late 1980s was conducted on experimental aircraft, sometimes without a thorough analysis of potential resonances. Tests conducted by the US Army on the AH-64A and OH-58D (Ref. 6.42) revealed several potential problems. A divergent vertical bounce was experienced during longitudinal cyclic hover sweeps in the AH-64 at about 5 Hz. Damaged tail rotor support components were found following yaw axis sweeps, again on the AH-64. On the OH-58D, sweep tests excited an oscillation in the mast mounted sight, which was not felt by the crew, but only detected visually by the crew of the chase aircraft and through the telemetry at the ground station.
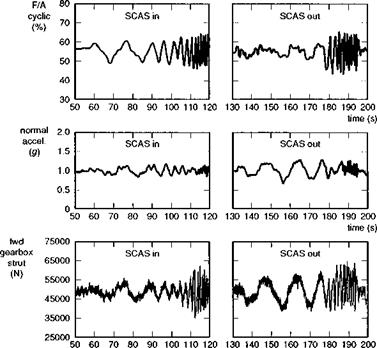
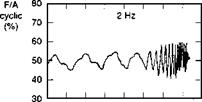
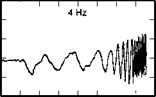
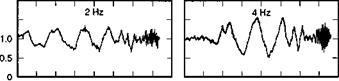
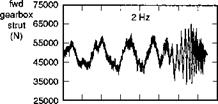
Earlier, at the Royal Aircraft Establishment, the first UK sweep tests were conducted with the research Puma fitted with a full fatigue usage monitoring strain gauge fit (Ref. 6.45). Higher fatigue usage was encountered in pitch axis sweeps in forward flight, and although we are still discussing the roll axis, the results are of such general significance in understanding the role of load monitoring that they are presented here. The tests were conducted to derive equivalent low-order system models for pitch axis dynamics (reported in Refs 6.28 and 6.45), but the test inputs were essentially the same as for the bandwidth measurement. Figure 6.35(a) illustrates two longitudinal cyclic frequency sweeps, one with the SCAS engaged, the other disengaged, captured at 60 knots airspeed. The additional data are the normal acceleration at the fuselage floor and the stress in the forward gearbox strut, derived from the component strain, which transpired to be the most critical for the pitch manoeuvre. The control input is maintained within the recommended range and the control frequency spectrum is primarily below 2 Hz, the required test upper limit. The larger response at the lower frequencies with the SCAS disengaged is noted. Figure 6.35(b) shows results at 100 knots, for two cases, one where the frequency range was limited to 2 Hz, the second where it was extended to 4 Hz. In the second case, the crew experienced significant vertical bounce at the higher end of the range. The normal acceleration record shows amplitude excursions of ±0.25 g at high frequency. A combination of real-time monitoring through a telemetry link to a ground station coupled with post-flight fatigue life accumulation analysis revealed the extent of the damage done during these tests. Figure 6.36 shows data for one flight (Flt No 728) comprising nine sweeps over the speed range 60-120 knots. The
|
|
|
|
|
|
|
|
|
|
![]()
Fig. 6.35 Longitudinal cyclic frequency sweeps on DRA research Puma: (a) 60 knots: SCAS on and off; (b) 100 knots: 2 Hz and 4 Hz
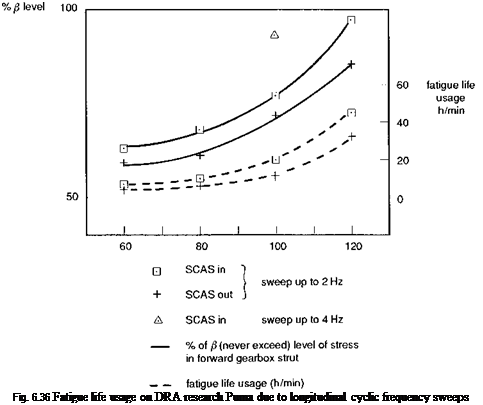
figure shows the percentage of the never-exceed fatigue load level, the so-called ^-level, in the forward gear box strut and the fatigue life usage across the speed range, for both SCAS-in and SCAS-out. A striking result is that the SCAS-out manoeuvres were less damaging than the SCAS-in manoeuvres. The SCAS-in sweep at 120 knots resulted in gearbox strut loads within 5% of the ^-level. The single triangle point at 100 knots corresponds to the case shown in Fig. 6.35(b), when the frequency range was extended to 4 Hz, again taking the load close to the limit. At the higher speeds, component life was being fatigued at the rate of more than 40 h/min. Following these tests, the calculation of the fatigue life used during flight 728 revealed that more than 11 h of life had been used in just nine sweeps. Accumulated life over the period of the tests indicated that the gearbox mounts were prematurely approaching their 2000-h limit. The aircraft was grounded while the gearbox mounts and other related components were replaced.
The lessons learned during these first few years of sweeping suggest that load monitoring, preferably in real time, is the safest precaution against undue structural damage. This requirement elevates the risk level associated with flying qualities testing, placing increased instrumentation demands on prototype aircraft. However, as will be discussed in the sections on subjective assessment in Chapter 7, flying
MTEs can also incur larger than usual fatigue life usage. The new approach to flying qualities criteria and test, epitomized by ADS-33, is clearly much more than just a new cookbook.
(10) Incrementally safe This final rule attempts to sum up the approach by emphasizing the importance to safety of engaging with frequency sweeping in an incremental manner, increasing frequency and amplitude only when confidence has been gained at lower values.
These ten rules have been laboured because of the novelty and the safety implications associated with frequency sweeping and because of the lack of guidance in the open literature. A frequency sweep is a flying qualities test but it shares many of the same characteristics as a loads test. Indeed, it might be argued that a rotor/airframe loads scan using the same test technique would yield valuable data for the stress engineers to conduct their part of the airframe qualification. It seems only natural, and certainly economical, to combine the activities in one test programme for a new aircraft, hence elevating the safety issues involved in bandwidth testing to the proper level.
The bandwidth criterion aims to discern handling qualities that avoid or exacerbate the problems that some pilots experience when ‘tightening-up’ in a closed-loop compensatory tracking task. For obvious reasons this high precision/performance criterion has
|
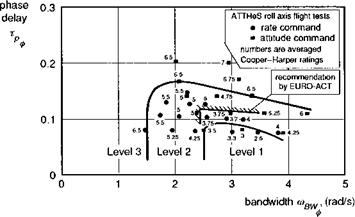
Fig. 6.32 Proposed roll axis bandwidth criteria from European tests (Refs 6.36, 6.37) |
0 1 2 3 4 5
(rad/s)
Fig. 6.33 Bandwidth/phase delay criteria for roll axis tracking task according to ADS-33D
(Ref. 6.38)
broad application across military helicopter uses. Considering civil helicopter design, certification and operations, there are several application areas that could potentially benefit from bandwidth (Ref. 6.39). Precise positioning of an underslung load is a good example, although even the military requirements are, at the time of writing, fairly immature in this area. All-weather operations requiring recoveries to moving decks is another example. The whole area of search and rescue is one where civil (and military) helicopters can be flown close to the pilot’s limits, with the requirements for precise positioning in confined spaces. With safety as an emphasis in civil helicopter operations, the case for introducing civil MTEs that include high-precision elements into the certification process is considered to be strong. The future application of ACT to civil helicopters, with the potential for increased phase delay, will strengthen this case; it is far better to highlight potential problems in certification than to experience them for the first time in operation. Of course, one of the great strengths of substantiated criteria, like bandwidth, is that they can be used in the design process to ensure satisfactory flying qualities are built in, with the aim of making the certification process a formality.
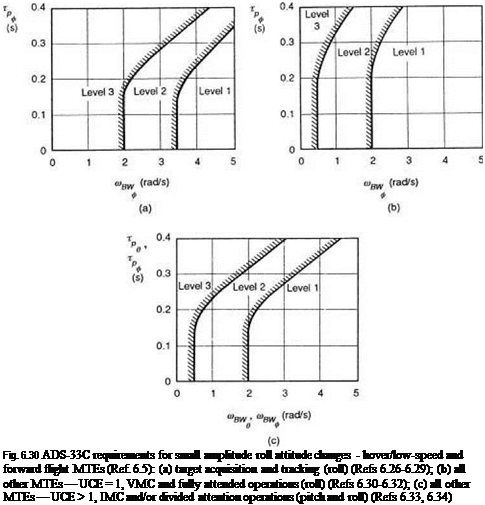
The ADS-33C quality boundaries for bandwidth and phase delay are presented on two – parameter handling qualities diagrams as shown in Figs 6.30(a)-(c), corresponding to the different MTE classes shown; the roll axis boundaries are applicable both to low speed and to forward flight regimes. The references provided in the legend to each figure record the supporting data from which the boundaries were developed. It is probably true that more effort has been applied, and continues to be applied, to defining these boundaries than any other. The criteria are novel and considerable effort was required to convince the manufacturing community in particular that the frequency domain criteria were more appropriate than the time domain parameters. The lower, vertical portions of each boundary indicate the minimum acceptable bandwidths, with tracking and air – combat MTEs demanding the highest at 3.5 rad/s for Level 1. The curved and upper portions of the boundaries indicate the general principle that the higher the bandwidth, the higher is the acceptable phase delay, the one compensating for the other.
It may seem surprising that Level 1 handling qualities are possible with phase delays of more than 300 ms. Two points need to be made about this feature. First, a study of the references will indicate that, although the data in these areas is very sparse, they genuinely indicate the trends shown. Second, it would be practically impossible to build a helicopter with a bandwidth of, say, 3 rad/s and with a phase delay of 300 ms (Fig. 6.30(b)); the latter would almost certainly drive the bandwidth down to less than 1 rad/s. This dependence of bandwidth on the same parameters that have a first-order effect on phase delay is perhaps the only weakness of this two-parameter handling qualities diagram. The point is illustrated in Fig. 6.31, which shows the contours of equi-damping and time delay overlaid on the UCE 1 roll bandwidth boundaries. The contours are derived from a simple, rate response ‘conceptual handling qualities model’ (Refs 6.3, 6.35), which can be written in transfer function form
where K is the overall gain or, in this case, the rate sensitivity, т is a pure time delay; am can be considered to be equivalent to the roll damping, – Lp. The results in Fig. 6.31 show that the addition of a pure time delay can have a dramatic effect on both bandwidth and phase delay. With т set to zero, the bandwidth would be equal to rnm.
Therefore, a 70-ms pure time delay can reduce the bandwidth of a 12 rad/s aircraft (e. g., with hingeless rotor) down to 4 rad/s. The bandwidth reduction is much less significant on helicopters with low roll damping (e. g., with teetering rotors); the same lags reduce the bandwidth of a 3 rad/s aircraft to about 1.9 rad/s. Note that, according to Fig. 6.30(a), defining the roll bandwidth requirements for tracking tasks, a bandwidth of 4 rad/s corresponds to Level 1 while a bandwidth of 1.9 rad/s corresponds to Level 3.
The model similar to that described by eqn 6.12 was used to investigate the effects of different levels of pilot aggression, or task bandwidth, on the position of the handling qualities boundaries in Fig. 6.31, using the DRA advanced flight simulator (AFS) (Ref. 6.3). The results will be presented later in the discussion on subjective measurement of quality in Chapter 7, but the test results confirmed the ADS – 33C boundaries to within 0.5 HQR, up to moderate levels of aggression. The research reported in Ref. 6.3 was part of a larger European ACT programme aimed at
|
Fig. 6.31 Equi-damping and time delay contours overlaid on ADS-33C handling qualities chart (Ref. 6.8) |
establishing guidelines for the handling characteristics of future ACT helicopters (Ref. 6.36). This international programme made complementary use of ground-based and in-flight simulation facilities. Of particular concern was the effect of transport delays introduced by the digital computing associated with ACT, and tests were conducted to try to establish whether the curved boundaries on the ADS-33C criteria would still be appropriate. In a similar time frame a new series of flight and simulator tests was conducted under the US Army/German MoU to check the location of the upper phase delay boundaries (Ref. 6.37). A new lateral slalom task was derived that contained tight tracking elements that could potentially discern PIO tendencies. Both the EuroACT and US/GE research derived results that suggested a levelling of the phase delay boundary between 100 and 150 ms would be required. Figure 6.32 summarizes the results, showing the recommended phase delay caps from the two evaluations. At the time of writing, these recommendations are regarded as tentative, although they have led to a revision of the ‘official’ requirements, appearing in the latest version of ADS-33 (ADS – 33D, Ref. 6.38), as shown in Fig. 6.33. The reduction in phase delay is accompanied by a relaxation in the bandwidth requirement for roll tracking tasks. The evolution of these criteria illustrates once again the powerful effect of task on handling qualities and the strong design driver that handling qualities will be for future ACT helicopters.
The quality of flying in the small amplitude-high frequency range of our framework diagram was initially encapsulated in a single-parameter bandwidth. Unfortunately, the situation turned out more complicated and it was not long before cases of equi- bandwidth configurations with widely varying handling qualities were found. Again, Hoh sheds light on this in Refs 6.23 and 6.24. For a wide variety of systems there is a unique relationship between the bandwidth frequency and the shape of the phase curve in the frequency domain beyond the bandwidth frequency. The steeper the phase ‘roll-off’, then the lower the bandwidth and, with relatively simple high-order effects like transport delays and actuator lags, the increasing phase slope correlates directly with bandwidth. However, for more general high-order dynamics, the phase delay has to be computed as an independent measure of handling, since configurations with markedly different phase slope can have the same bandwidth. A case is cited in Ref. 6.24 where two configurations with the same bandwidth were rated as Level 2 and 3, simply because the phase slopes were very different (Fig. 6.29). Pilots are particularly sensitive to the slope of the phase at high frequency, well beyond the bandwidth frequency but still within the range of piloting, e. g., > 10 rad/s. In a closed-loop tracking task, when high precision is required, pilots will find that high values of phase slope make it very difficult for them to adapt their control strategy to even small changes in frequency,
|
|
hence task disturbance. This and related effects reinforce the point that for tracking tasks the pilot is very sensitive to effects easily described in the frequency domain but hardly noticeable as delays following step inputs. The actual parameter selected to represent the shape of the phase is the phase delay, тp, defined as
where A®2®180 is the phase change between «180 and 2«180. The phase delay is therefore related to the slope of the phase between the crossover frequency and 2«180. Reference 6.5 notes that if the phase is nonlinear in this region, then the phase delay can be determined from a linear least-squares curve fit, in a similar way to the computation of equivalent time delay in LOES analysis.
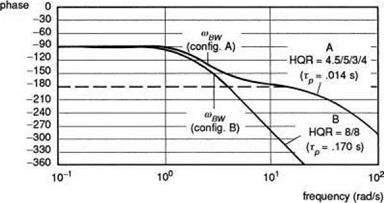
In Ref. 6.23, Hoh describes results from a simulator assessment of attitude command response types for a recovery to a ship MTE. The tests were conducted on the NASA vertical motion simulator (VMS) specifically to evaluate the effectiveness of rise time criteria. The step response characteristics of the different configurations tested are shown in Fig. 6.24. An important result of the tests was that the three evaluation pilots rated all the configurations within a fairly tight HQR spread. The pilots were
|
Fig. 6.24 Pilot HQRs for different step response characteristics at constant bandwidth (Ref. 6.23) |
almost unaware of the different time domain characteristics for this precision landing manoeuvre. What the configurations in Fig. 6.24 do have in common is the attitude bandwidth, even though the damping ratio varies from 0.5 to 1.3. This is a very compelling result and calls for a definition and description of this unique new handling qualities parameter.
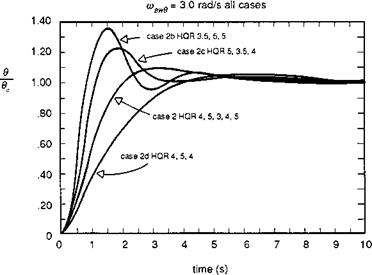
The bandwidth parameter is defined in Fig. 6.25 as the lesser of two frequencies, the phase-limited or gain-limited bandwidth, derived from the phase and gain of the
|
Fig. 6.25 Definition of bandwidth and phase delay from ADS-33 (Ref. 6.5) |
frequency response of attitude to pilot’s cyclic control. The phase bandwidth is given by the frequency at which the phase is 135°, i. e., the attitude lags behind the control by 135°. The gain bandwidth is given by the frequency at which the gain function has increased by 6 dB relative to the gain when the phase is 180°. The 180° phase reference is significant because it represents a potential stability boundary for closed- loop tracking control by the pilot. If a pilot is required to track a manoeuvring target or to maintain tight flight path control during turbulent conditions, then there are three related problems that hinder control effectiveness. First, at high enough frequencies, the aircraft response will lag behind the pilot’s control input by 180°, requiring the pilot to apply significant control lead to anticipate the tracked or disturbed motion (as the aircraft rolls to port, the pilot must also apply lateral cyclic to port to cancel the motion). Second, at higher frequencies the response becomes attenuated and, to achieve the same tracking performance, the pilot has to increase his control gain. Third, and most significant, any natural lags in the feedback loop between an attitude error developing and the pilot applying corrective cyclic control can result in the pilot-aircraft combination becoming weakly damped or even unstable. The combination of these three effects will make all air vehicles prone to PIOs above some disturbance frequency, and one of the aims of the bandwidth criteria is to ensure that this frequency is well outside the range required to fly the specified MTEs with the required precision. Thus, a high phase-bandwidth will ensure that the phase margin of 45°, relative to the 180° phase lag, is sufficient to allow the pilot to operate as a pure gain controller, accepting his own natural phase lags, without threatening stability. The gain bandwidth limit protects against instability should the pilot elect to increase his gain or his level of aggression at high frequency. Of course, a skilful pilot can operate effectively well beyond the limits defined by simple theory, by applying more complex control strategies. This always leads to an increase in workload and hence less spare capacity for the pilot to give attention to secondary tasks, any of which could become primary at any time in consideration of overall safety or survivability. For a wide range of systems, the phase bandwidth is equal to or less than the gain bandwidth.
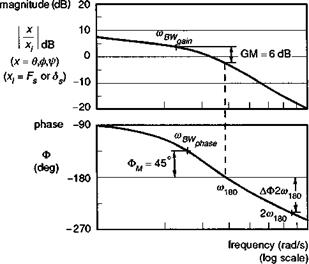
The bandwidth criteria apply in ADS-33 to both rate and attitude response-types, except that for attitude response types, only the phase bandwidth applies. This nuance leads us to examine the gain-limited bandwidth in a little more detail, following the discussion in Ref. 6.24, where Hoh reports that the ‘… gain bandwidth is included because a low value of gain margin tends to result in a configuration that is PIO prone. Low gain margin is a good predictor of PIO prone configurations because small changes in the pilot gain result in a rapid reduction in phase margin’. An example of a gain-limited bandwidth system is given in Ref. 6.24 and reproduced here as Fig. 6.26. Here, there is a modest value of phase bandwidth, but the gain margin available to the pilot when operating around this frequency, for example, to ‘tighten-up’ in an effort to improve performance, is limited and considerably less than the 6 dB available at the gain bandwidth. Hoh describes the problem succinctly when he states that, ‘The phenomenon is insidious because it depends on pilot technique. A smooth, nonaggressive pilot may never encounter the problem, whereas a more aggressive pilot could encounter a severe PIO’. Hoh goes on to discuss the rationale for not including the gain margin limit for attitude command systems. Basically, because the attitude stabilization task is accomplished by the augmentation system, the pilot should not be required to work at high gains with inner-loop attitude control. If he does, and experiences a PIO tendency, then simply backing off from the tight control strategy
|
Fig. 6.26 Example of a gain-margin limited system (Ref. 6.24) |
will solve the problem. To conclude this discussion we quote further from Hoh (Ref. 6.24):
We are faced with a dilemma: on the one hand gain-margin-limited ACAH response types lead to PIOfor super precision tasks, and on the other, disallowing such configurations robs the pilot ofworkload relieffor many other, less aggressive, MTEs. The approach taken herein (in the ADS-33C spec) has been to eliminate gain marginfrom the definition of bandwidth for ACAH response types, but to recommend avoidance of ACAH systems where the gain bandwidth is less than the phase bandwidth, especially if super precision tasks are required. Additional motivation for not including gain bandwidth as a formal requirement for ACAH was that the PIO due to gain margin limiting has not been found to be as violent for ACAH response types. It should be emphasised that this is not expected to be the case for rate or RCAH response types, where the pilot attitude closure is necessary to maintain the stable hover, and consequently, it is not possible to completely ‘back out’ of the loop. Therefore gain bandwidth is retained for these response types.
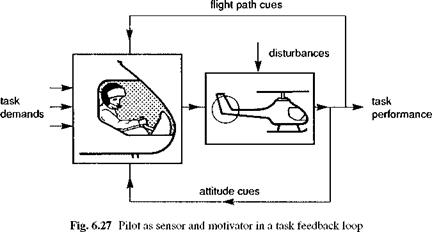
Gain-margin-limited systems result from a large phase delay, combined with flat amplitude characteristics such as shown in Fig. 6.27. Large phase delays usually result from inherent rotor system time delay (65 to 130 ms), combined with computer throughput delays, actuator lags, filters, etc. The flat amplitude characteristic is, of
|
course, inherent to ACAH, and can occur in RCAH response types due to the nature of feedforward equalization. |
Another interpretation of bandwidth can be gleaned from its origins out of the development of the so-called crossover model of human pilot behaviour (Ref. 6.25), which treats the pilot action in performing tracking control tasks as an element in a feedback loop (Fig. 6.27). In single-axis tasks, for a wide variety of aircraft dynamic characteristics, the pilot adapts his control strategy so that the product of the pilot and aircraft dynamics take the simple transfer function form
coce-t s
Yp(s)Ya(s) « —————— (6.10)
s
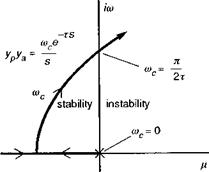
Therefore, for example, if the rate response is a simple first-order lag, then the pilot will compensate by applying a simple lead with approximately the same time constant as the response lag. This form of overall open-loop characteristic will be applicable over a range of frequencies depending on the application. A key property of this form of model is highlighted by the root locus diagram of its stability characteristics when in a closed-loop system (Fig. 6.28). The pilot can increase the overall gain rnc to regulate the
|
Fig. 6.28 Root locus of crossover model eigenvalues as pilot gain is increased |
performance of the tracking task, but doing so will degrade the stability of the closed – loop system. The pure time delay, caused by mental processing and neuromuscular lags, is represented by the exponential function in the complex plane (i. e., Laplace transform) that has an infinite number of poles in the left-hand transfer function plane. The smallest of these moves to the right as the pilot gain is increased in the crossover model links up with the left moving rate-like pole, and the pair eventually become neutrally stable, with 180° phase shift, at the so-called crossover frequency as shown in Fig. 6.28. This simple but very effective model of human pilot behaviour has been shown to work well for small amplitude single-axis tracking tasks and leads to the concept of a natural stability margin defined by the gain or phase margin from the point of neutral stability. This is the origin of the bandwidth criteria.
It would not be an exaggeration to say that handling qualities research, for both fixed – and rotary-wing aircraft, has concentrated on the short-term response to control inputs, and the roll and pitch axes have absorbed most of the efforts within this research. The primary piloting task under consideration in this region is attitude regulation,
|
|
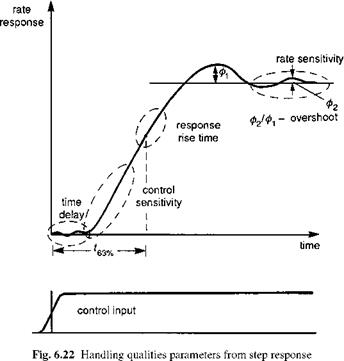
appropriate to tracking tasks when fine attitude corrections are required to maintain a precise flight trajectory or position. Most of the early work aimed at defining quality in this region focused on the response to step control inputs. Figure 6.22 illustrates the key characteristics associated with the step response:
(1) control sensitivity – the initial angular acceleration per unit of control input (e. g., inch of stick travel);
(2) rate sensitivity – the final steady-state rate per unit of control input; more generally this would be called response sensitivity to account for other response types;
(3) response time constant(s) – the time(s) to some proportion of the steady-state response; for simple first-order systems, the time constant t63% is sufficient to characterize the simple exponential growth;
(4) time delay – delay before there is a measurable aircraft response; this can be grouped into category (3) but we separate it because of its special meaning;
(5) overshoot – ratio of successive peaks in oscillatory time response.
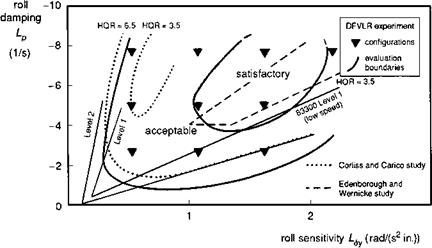
This list suggests that there needs to be at least five, and perhaps even more, handling qualities parameters that characterize the rise times, sensitivities and damping of the step control response in the time domain. Before we discuss the appropriateness of this further, it is worth reviewing one particular criterion that had gained widespread acceptance, prior to the publication of ADS-33 – the so-called damping/sensitivity diagram (Fig. 6.23). The damping derivative Lp(1/s) is plotted against the control sensitivity derivative Lgy (rad/(s2 in)), where Sy is the lateral cyclic stick displacement. The use of derivatives in this criteria format stems from the assumption of a linear
|
Fig. 6.23 Short-term roll handling qualities – damping/sensitivity boundaries (Ref. 6.20) |
first-order type response where these two parameters completely describe the time response characteristics (Lp is the inverse of t63%, and L$y is the initial acceleration of the step response function; the ratio of control sensitivity to damping gives the rate sensitivity). On Fig. 6.23, taken from Ref. 6.20, we have drawn the various boundaries set by data from previous experiments. While we have to recognize that boundary lines on this two-parameter handling qualities chart will be task dependent, there is good reason to believe that the wide spread of quality boundaries in Fig. 6.23 is actually a signal that the criteria are not appropriate to short-term response criteria in general. For simple first-order systems, or classical roll rate response types easily modelled in simulation, the contour shapes in the figure will be entirely appropriate. However, there are two principal reasons why Fig. 6.23 is not generally applicable and hence the situation does not meet the CACTUS rules:
(1) Short-term helicopter roll response is typically non-classical, with higher order dynamics distorting the first-order contributions.
(2) For tasks requiring the pilot to perform attitude regulation, there is strong evidence that the pilot’s impression of handling qualities is not particularly sensitive to the shape of the response to a step input.
With regard to the first point, in the early unpublished versions of the revision to MIL-H-8501, time domain step response criteria were proposed, based on fixed-wing experience, which included three rise time parameters and one overshoot parameter as shown in Table 6.2.
This criteria set was based entirely on flight data, largely gathered on the variable stability Bell 205 operated by the Flight Research Laboratory in Ottawa; ground-based simulator results were discounted because there were too many unresolved questions about data from rate response types obtained from simulation. Reference 6.21, in summarizing the contribution of the Canadian Flight Research Laboratory to the ADS – 33 effort, presents results showing the discrepancy between ground-based simulation and in-flight simulation results; the ground-based tests showed no significant Level 1
|
Table 6.2 Limiting values of time response parameters for roll rate response type in hover and low speed MTEs
|
achievement. The proposed time domain parameters in Table 6.2 were derived from the limited flight test results available at the time. The criteria proposed for attitude command systems required the rise times to be a function of the effective damping ratio of the response, and were therefore even more complicated. The emphasis on finding suitable time domain criteria for both roll and pitch attitude short-term response was partly driven by the helicopter community’s familiarity with this format, stemming partly from the history of usage of MIL-H-8501A and the traditional damping/sensitivity two-parameter handling qualities diagram. Had there not been a potentially very effective alternative being developed in parallel with the time domain parameters, the ADS-33 development may well have persisted with this kind of format.
Measurement problems aside (and these are potentially significant), the reality is that, although the step response function may be a simple clinical concept, pilots rarely use step response control strategies in attitude regulation and tracking tasks, and it was only a matter of time before the community became convincingly won over to the frequency domain and the alternate proposal – the bandwidth criterion. Before discussing bandwidth in some detail it is worth saying a few words about the archetypal frequency domain approach – low-order equivalent systems (LOES), used extensively in fixed-wing handling criteria (Ref. 6.6). The argument goes that the higher frequency ranges of vehicle dynamics characterizing the short-term responses are dominated by the roll subsidence and short-period pitch modes. Obtaining frequency response data, by exciting the aircraft around the natural frequencies, provides amplitude and phase characteristics to which low-order equivalent systems can be fitted numerically to estimate natural frequency and damping, for which quality boundaries can be defined on two-parameter diagrams. The fixed-wing handling requirements state that this approach is not applicable to non-classical response types and offer the bandwidth criterion as an alternate approach in these cases. It was recognized early on in the development effort that the naturally non-classical behaviour of helicopters would exclude LOES as a general candidate for roll and pitch response (Ref. 6.22), particularly for Level 2 and 3 configurations, and little research has been conducted in this area, at least for roll response.
The most appropriate parameter for defining the quality of flying large amplitude manoeuvres is the control power available, i. e., the maximum response achievable by applying full control from the trim condition. For rate command systems this will be measured in deg/s, while for attitude command response, the control power is measured in degrees. This ‘new’ definition found in ADS-33 contrasts with the earlier MIL-H – 8501 and fixed-wing criteria where the control power related to the maximum control
moment available. To avoid confusion we conform with the ADS-33 definition. Perhaps more than any other handling qualities parameter, the control power is strongly task dependent. Figure 6.15 illustrates this with the minimum control power requirements for Level 1 handling qualities (according to ADS-33) corresponding to MTEs that require limited, moderate and aggressive manoeuvring. The figure shows requirements for rate response types in low speed and forward flight MTEs. The minimum rate control power requirements vary from 15°/s in forward flight IMC through to 90°/s in air combat.
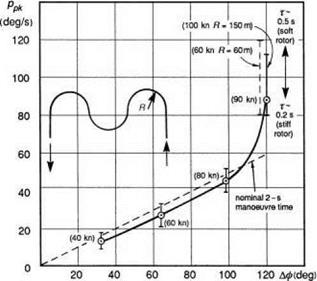
Ground-based simulations conducted at the RAE in the late 1970s (Ref. 6.17) were aimed at defining the agility requirements for battlefield helicopters and roll control power was given particular attention. Figure 6.16 shows the maximum roll rates used in the roll reversal phase of a triple bend manoeuvre as a function of roll angle change for various flight speeds. The dashed manoeuvre line corresponds to the theoretical case when the reversal is accomplished in just 2 s. For the cases shown, the control power was set at a high level (> 120°/s) to give the test pilots freedom to exploit as much as they needed. For speeds up to about 70 knots, the pilot control strategy followed the theoretical line, but as the speed increased to 90 and 100 knots there was a marked increase in the maximum roll rates used. This rapid change in control strategy at some critical point as task demands increase is significant and will be discussed later in Chapter 7. The spread of data points corresponds to different rotor configurations, resulting in different roll time constants as shown in the figure. With the larger time constants, corresponding to articulated or teetering rotor heads, the pilots typically used 30-40% more roll rate than with the shorter time constants typical of hingeless rotors. It appears that with ‘soft’ rotors, the pilot will use more control to quicken the manoeuvre. This more complex control strategy leads to an increase in
|
Fig. 6.16 Peak roll rates from triple bend manoeuvre |
workload and a degradation in the pilot opinion of handling qualities, a topic we shall return to in Chapter 7. The study of Ref. 6.17 concluded that for rapid nap-of-the-earth (NoE) manoeuvring in the mid-speed range, a minimum control power requirement of 100% was necessary for helicopters with moderately stiff rotors, typical of today’s hingeless rotor configurations.
The measurement of control power is, in theory, quite straightforward; establish trimmed flight and apply maximum control until the response reaches its steady state. In practice, unless great care is taken, this is likely to result in large excursions in roll, taking the aircraft to potentially unsafe conditions, especially for rate command response types. A safer technique is to establish a trimmed bank angle (< 60°) and apply a moderate step input in lateral cyclic, recovering before the aircraft has rolled to the same bank in the opposite direction. The manoeuvre can now be repeated with increasing control input sizes and several data points collected to establish the functional relationship between the roll response and control step size. Applying this incremental technique it will usually be unnecessary to test at the extremes of control input size. Either the minimum requirements will have been met at lower input sizes or the response will be clearly linear and extrapolation to full control is permissible. For the cases requiring the highest control powers, e. g., air combat MTEs, it may be necessary (safer) to capture the data in a closed-loop flight test, e. g., with the aircraft flown in an air combat MTE. In both open – and closed-loop testing, two additional considerations need to be taken into account. First, care should be taken to avoid the use of pedals to augment the roll rate. In operational situations, the pilot may choose to do this to increase performance, but it can obscure the measurement of roll control power. Second, at high rotor thrust, the rotor blades can stall during aggressive manoeuvring, with two effects. The loss of lift can reduce the roll control effectiveness and the increase in drag can cause torque increases that lead to increased power demands. These are real effects and if they inhibit the attainment of the minimum requirements then the design is lacking. Because of the potentially damaging nature of the test manoeuvres for control power estimation, online monitoring of critical rotor and airframe stresses is desirable, if not essential.
Neither the civil handling requirements (Ref. 6.10), nor Def Stan 00970 (Ref. 6.9), refer to criteria for control power per se, but instead set minimum limits on control margin in terms of aircraft response. This normally relates to the ability to manoeuvre from trimmed flight at the edge of the OFE. Def Stan 00970 defines control margin in terms of the control available to generate a response of 15°/s in 1.5 s. The old MIL-H-8501A required that at the flight envelope boundary, cyclic control margins were enough to produce at least 10% of the maximum attainable hover roll (or pitch) moment. The FAAs adopt a more flexible approach on the basis that some configurations have been tested where a 5% margin was sufficient and others where a 20% margin was inadequate (Ref. 6.13). Specifically, for FAA certification, what is required from flight tests is a demonstration that at the never-exceed airspeed, ‘a lateral control margin sufficient to allow at least 30° banked turns at reasonable roll rates’ must be demonstrated. ADS-33 is clearly more performance oriented when it comes to setting minimum control power requirements, and this philosophy extends to the moderate amplitude criteria, where the introduction of a new parameter, the manoeuvre quickness, has taken flying qualities well and truly into the nonlinear domain.
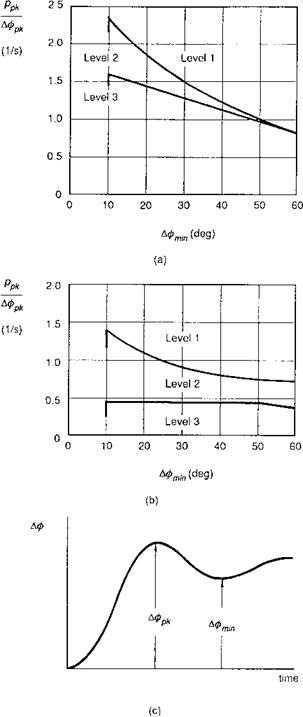
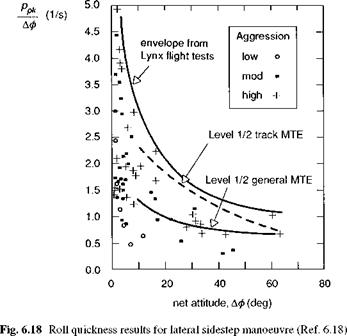
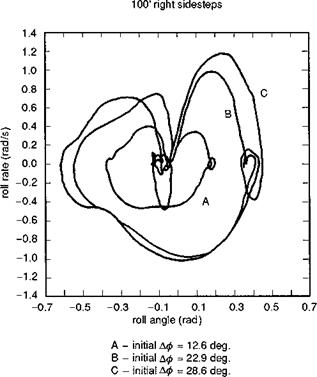
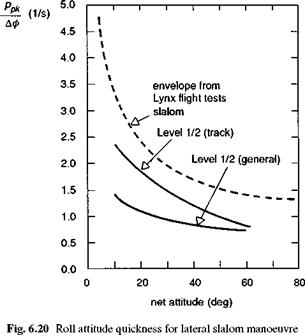
Moderate amplitude roll requirements broadly apply to manoeuvres within the range -60° <ф< 60° that include military NoEMTEs, such as quick-stop, slalom, and civil helicopter operations in harsh conditions, e. g., recovery to confined areas in gusty conditions and recovery following failed engine or SCAS. The development of attitude quickness has already been discussed in some detail. The definition of quickness used in ADS-33 has been developed to relate to non-pure response types and includes a subtlety to account for oscillatory responses. Figure 6.17 shows the roll axis quickness criteria boundaries from ADS-33, including the definition of the attitude parameters required to derive quickness. Once again the task-oriented nature of flying qualities is highlighted by the fact that there are different boundary lines for different MTE classes, even within the low-speed regime (see Ref. 6.5 for full details). Figure 6.18 shows the quickness envelope for the Lynx flying a lateral sidestep compared with the two Level 1 ADS-33 boundaries. The companion Fig. 6.19 illustrates the phase plane portraits for the sidestep flown at three levels of aggressiveness. Even in this relatively small-scale MTE, roll rates of nearly 70°/s are being used during the reversals (cf. Fig. 6.8). The sidestep task, flown in low wind conditions, strictly relates to the ‘general MTE’ class, indicating that the Lynx has at least a 60% task margin when flying this particular MTE. For the track boundary, the margin appears less, but it should be noted that the sidestep task in low wind is not the most demanding of MTEs and the Lynx will have a higher task margin than shown. To highlight this, Fig. 6.20 shows the roll quickness envelope for Lynx flying the lateral slalom MTE at 60 knots, with the ADS – 33 Level 1/2 boundaries for forward flight MTEs. The rise in quickness to limiting values occurred for this aircraft at the highest aspect ratio when the pilot reached the lateral cyclic stops in the roll reversals. Lynx is particularly agile in roll and we see in Fig. 6.20, possibly some of the highest values of quickness achievable with a modern helicopter. The additional points on Fig. 6.18 will be discussed below.
The compliance testing for quickness depends on roll response type; with rate command, a pulse-type input in lateral cyclic from the trim condition will produce a
![]()
|
|
|
|
Fig. 6.19 Phase plane portraits for Lynx flying lateral sidestep MTE |
|
|
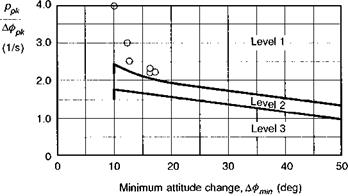
discrete attitude change. As noted above, for a helicopter with linear response characteristics, the quickness will be independent of input size and what is required is a decrease in the cyclic pulse duration until the required level of response is attained. In practice, the shorter the pulse, the larger the pulse amplitude has to be in order to achieve a measurable response. Figure 6.21 illustrates flight test results from the DLR’s Bo105, showing different values of roll quickness achieved between 10° and 20° attitude change (Ref. 6.19). A maximum quickness of 4 rad/s was measured for this aircraft at the lower limit of the moderate amplitude range. For longer duration inputs, quickness values only just above the ADS-33 boundary were measured, as shown, highlighting the importance of applying sharp enough inputs to establish the
|
Fig. 6.21 Roll attitude quickness measured on Bo105 at 80 knots (Ref. 6.19) |
quickness margins. It should be remembered that for compliance demonstration with ADS-33, all that is required is to achieve values in the Level 1 region.
For attitude response types, it may be necessary to overdrive initially the control input, followed by a return to steady state consistent with the commanded attitude. The control reversal is recommended to overcome the natural stability associated with the attitude command response type, and a moderate amount is allowable to achieve the maximum quickness.
The use of attitude quickness has some appeal in establishing control effectiveness requirements for civil helicopter handling qualities. As with the military requirements, however, establishing a test database from civil MTEs is essential before boundaries can be set. One area that could be well served by quickness is the response characteristics required to recover from SCAS failures; another could be the recovery from upsets due to vortex wakes of fixed-wing aircraft or other helicopters. Establishing quantitative criteria in these areas could have direct impact on the integrity requirements of the stability augmentation systems on the one hand and the operating procedures of helicopters at airports on the other. One of the obvious benefits of robust handling criteria is that they can help to quantify such aspects at the design stage.
In Fig. 6.18, the additional data points shown are computed from the time histories of sidestep data taken from tests conducted on the DRA advanced flight simulator (Ref. 6.3). These and other MTE tests will be discussed in more detail in Chapter 7, but a point worth highlighting here is the spread of quickness values in relation to the level of aggression adopted by the pilot. The level of aggression was defined by the initial roll angle, and hence translational acceleration, flown. High aggression corresponded to roll angles of about 30°, with hover thrust margins around 15%. At the lower end of the moderate amplitude range (between 10° and 20°), the maximum quickness achieved at low aggression was about 0.7, rad/s, which would correspond to the level of performance necessary to fly in UCE 2 or 3; ADS-33 states that meeting the quickness requirements is not mandatory for these cases (Ref. 6.5). The moderate aggression case would be typical of normal manoeuvring, and the maximum quickness achieved, around 1.5 rad/s, conforms well with the ADS-33 minimum requirement boundary. At the higher levels of aggression, quickness values correlate closely with those achieved with the Lynx in flight test at around 2.5 rad/s, a not-too-surprising result, as the simulation trials were designed to explore the maximum achievable task performance at similar thrust margins to the flight trials.
The large and moderate amplitude criteria extend down to 10° roll attitude. Below this, in the small amplitude range, we can see from Fig. 6.18 that the quickness measurements increase to values well beyond the moderate amplitude boundary. But quickness is no longer an appropriate parameter in this region and we have to look at a different formulation to measure flying quality here.
The ability to generate rolling moments about the aircraft’s centre of gravity serves three purposes. First, to enable the pilot to trim out residual moments from the fuselage, empennage and tail rotor, e. g., in a pure hover, sideslipping flight, slope landings, hovering in side-winds. Second, so that the rotor thrust vector can be reoriented to manoeuvre in the lateral plane, e. g., repositioning sidestep, attitude regulation in tight flight path control. Third, so that the pilot can counteract the effects of atmospheric disturbances. All three can make different demands on the aircraft, and flying qualities criteria must try to embrace them in a complementary way.
6.3.1 Task margin and manoeuvre quickness
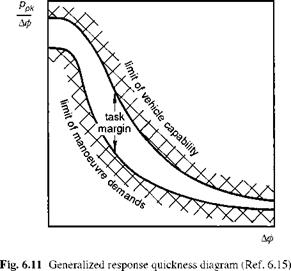
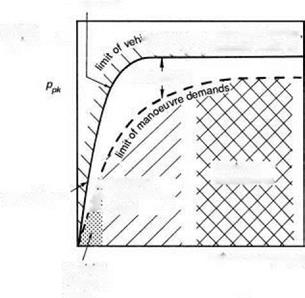
The roll axis has probably received more attention than any other over the years, possibly as a carry-over from the extensive research database in fixed-wing flying qualities, but also because roll control arguably exhibits the purest characteristics and is most amenable to analysis. A comprehensive review of roll flying qualities is contained in Ref. 6.15. In this work, Heffley and his co-authors introduced the concept of the ‘task signature’ or ‘task portrait’, discussed in Chapter 2 of this book (see Fig. 2.40), and also the ‘task margin’, or the control margin beyond that required for the task in hand. The basic ideas are summarized conceptually in Fig. 6.6, which shows how the roll rate requirements vary with manoeuvre amplitude (i. e., change in roll angle). The manoeuvre demand limit line is defined by the tasks required of the helicopter in the particular mission. The task margin is the additional vehicle capability required for emergency operations. The manoeuvre amplitude range can conveniently be divided into the three ranges discussed earlier – small, moderate and large – corresponding to precise tracking, discrete manoeuvring and maximum manoeuvre tasks, as shown.
 attitude change {йф)
Fig. 6.6 Roll rate requirements as a function of manoeuvre amplitude (Ref. 6.15)
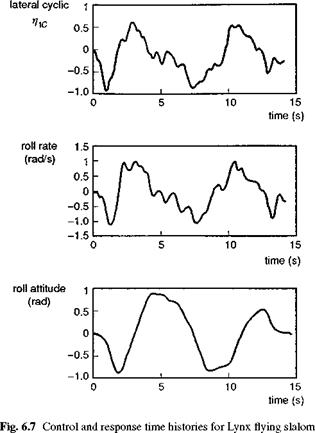
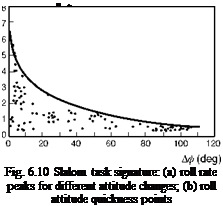
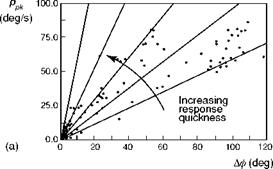
Highlighted in Fig. 6.6 are the principal design features that define the outer limit of vehicle capability – rotor stiffness in the small amplitude range and Lock number in the high amplitude range; the actuation rate and authority limits also define the shape of the capability boundary in the moderate to high amplitude range. To convert Fig. 6.6 into a form compatible with the frequency/amplitude diagram in Fig. 6.5 requires us to look back at the very simple task signature concept. Figure 6.7 shows the time histories of lateral cyclic, roll attitude and rate for a Lynx flying a slalom MTE (Ref. 6.16). The manoeuvre kinematics can be loosely interpreted as a sequence of attitude changes each associated with a particular roll rate peak, emphasized in the phase plane portraits in Fig. 6.8. For the case of the Lynx, roll control is essentially rate command, so that the attitude rate follows the control activity reasonably closely (see Fig. 6.9). The task signature portrait in Fig. 6.10 (a) shows selected rate peaks plotted against the corresponding attitude change during the slalom. Each point represents a discrete manoeuvre change accomplished with a certain level of aggression or attack. Points that lie on the same ‘spoke’ lines correspond to similar levels of attack by the pilot. We reserve the descriptors ‘attack’ and ‘aggression’ for the pilot behaviour, and use the expression ‘quickness’ to describe this temporal property of the manoeuvre. Manoeuvre quickness, or in the present case roll attitude quickness, is the ratio of peak rate to attitude change during a discrete manoeuvre and was first proposed in Ref. 6.15 as an alternate flying qualities or control effectiveness parameter:
The data in Fig. 6.10 (a) are transformed into quickness values in Fig. 6.10 (b). If we transform the generalized boundaries on Fig. 6.6 into quickness, by plotting the slope
|
|
|
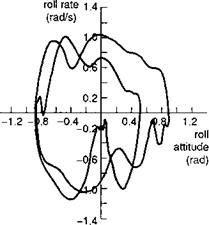
Fig. 6.8 Phase plane portrait for Lynx flying slalom manoeuvre |
![]()
|
|
 |
|
|
of the boundary lines against the attitude changes, we arrive at Fig. 6.11, showing the characteristic hyperbolic shape with amplitude of Fig. 6.5. For a given roll attitude change, there will be a maximum value of achievable quickness defined by the limit of the vehicle capability. When the manoeuvre amplitude is high enough, the limiting function in Fig. 6.11 will genuinely be hyperbolic, as the maximum rate is achieved and the limit is inversely proportional to the attitude change. This trend is confirmed in Fig. 6.10 (b), which shows the envelope of maximum quickness derived in the Lynx slalom flight trials described in Ref. 6.16. The highest roll attitude changes of more than 100° were experienced during the roll reversal phases of the MTE. Values of quickness up to 1 rad/s were measured during these reversals, indicating that pilots were using at least 100°/s of roll rate at the highest levels of aggression. In the low amplitude range the quickness rises to more than 5 rad/s, although with the small values of roll attitude change here, the extraction of accurate values of quickness is difficult. The quickness parameter has gained acceptance as one of the innovations of ADS-33, applicable to the moderate amplitude range of manoeuvres. We shall return to this discrimination later in this section but first we examine some of the theoretical aspects of quickness, applied to a simple model of roll control.
The first-order approximation to roll response has been discussed in Chapters 2,4 and 5, and the reader needs to be aware of the limited range of validity when applied to helicopters. Nevertheless, this simple model can be used to gain useful insight into the theoretical properties of quickness. We consider the first-order, differential equation of motion of a rate command response-type helicopter, written in the form
p Lpp — L 01c 01c — Lpps 01c (6.2)
where p is the roll rate and 01 c the lateral cyclic control; we have neglected any rotor or actuation dynamics in this model. The damping and control derivatives have been discussed in detail in Chapter 4. The response to a step input in lateral cyclic is an exponential growth to a steady-state roll rate ps. To derive a value for attitude
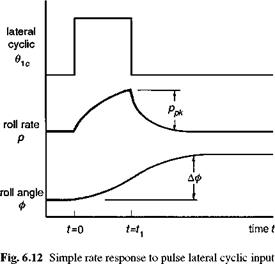
quickness we need to consider the response to a pulse input of duration ti, which leads to a discrete attitude change Аф (Fig. 6.12). Analytic expressions for the roll rate and attitude response expressions then have two forms, one during the application of the pulse and the second after the pulse:
t < t1 : p = ps (1 – eLpt) 61c, ф = L – (1 + Lpt – eLpt) 91c
(6.3)
t > t1 : p = pseLpt (e-Lpt1 – 1) 91c, ф = ф(1 – L – (eLpt1 – 1)
(eLp(t-t1) – 1) 91c (6.4)
From these expressions the attitude quickness can be formed and, after some reduction, we obtain the simple expression
![]()
 |
M = – b-(1 – e-f1) Аф t1
where
t1 = —L pt1 (6.6)
The normalized time i) given by eqn 6.6 can be thought of as the ratio of the manoeuvre duration to the time constant of the aircraft. The quickness, normalized by the roll damping, is shown plotted against?1 in Fig. 6.13. One important result of this analysis is that the quickness is independent of control input size. For a 2-s pulse, the quickness will be the same from a small and large input; this is essentially a property of the linear system described by eqn 6.2 and may no longer be true when nonlinearities are
|
0.6 |
|
0.4 |
|
0.2 |
|
1.0 |
|
2.0 |
|
3.0 |
|
4.0 t: 5.0 normalized time |
Equation 6.8 tells us that when the manoeuvre is slow relative to the aircraft time constant, then the latter plays a small part in the quickness and the attitude change is practically equal to the roll rate times the pulse time. Equation 6.7 describes the limit for small-duration control inputs, when the roll transient response is still evolving. This case requires closer examination because of its deeper significance which should become apparent. The inverse of the roll damping is equal to the time to reach 63% of ps following a step input, but the parameter has another related interpretation in the frequency domain. Heuristically, frequency would appear to be more significant than amplitude in view of the insensitivity of quickness to control input size. The phase angle between the roll rate as output and the lateral cyclic as
(rjm amplitude

 When the phase between p and Qc is 45°, then the frequency is numerically equal to the damping Lp. This corresponds to the case when the attitude response is 135° out of phase with the control input. We shall see later in this section that the frequency when the attitude response lags the control by 135° is defined by a fundamental handling parameter – the (open-loop) attitude bandwidth. For non-classical response types we shall show that the attitude bandwidth is a more significant parameter than the roll damping and conforms more closely with many of the CACTUS rules. Bandwidth is one of the central parameters in ADS-33.
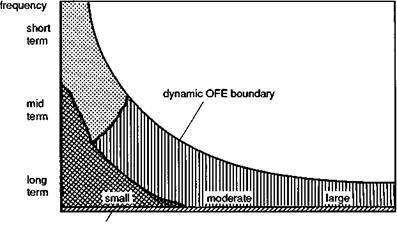
Returning to our framework diagram, we are now in a better position to examine quality criteria and the associated flight test measurement techniques; we divide the diagram into three ‘dynamic’ regions as shown (Fig. 6.14). We broadly follow the ADS-33 definition of the amplitude ranges:
(1) small, ф < 10°, continuous closed loop, compensatory tracking;
(2) moderate, 10° < ф < 60°, pursuit tracking, terrain avoidance, repositioning;
(3) large, ф > 60°, maximum manoeuvres;
and review selected military and civil criteria. On Fig. 6.14 we have included the narrow range of zero to very low frequency to classify trim and quasi-static behaviour. The first of the ‘manoeuvre’ regions combines moderate and large amplitude roll attitude criteria.
This chapter is concerned with those flying qualities characteristics that can be quantified in parametric, and hence, numerical, terms. A range of new concepts in quality discrimination were established during the 1980s and are now taking a firm hold in the development of new projects in both Europe and the United States. Some background interpretation and discussion of the development rationale are provided from the author’s own perspective, particularly relating to the quantitative criteria in the US Army’s ADS-33. Before ADS-33, the existing mandatory and even advisory design criteria were so ill-matched to the high performance helicopter that achieving compliance with these in simulation provided little insight into problems that might occur in flight. Furthermore, aircraft that demonstrated compliance during flight test could still be unfit for their intended role. These two paradoxical situations have prevailed since design criteria were first written down and their continued existence can be tolerated only on two counts. First, there is the argument that criteria should not constrain the design creativity unduly and, second, that handling qualities of new designs in new roles should not be prejudiced by a limited database derived from older types. These two points should serve to alert us to the need for living requirements criteria that are robust; the term robust is applicable in this context to requirements that meet the so-called CACTUS rules (Ref. 6.14), namely
(1) Complete – covering all missions, flight phases and response characteristics, i. e., all the internal and external influencing factors;
(2) Appropriate – the criteria formats should be robust enough to discern quality in the intended range of application (e. g., frequency domain rather than time domain criteria for pilot-induced oscillation (PIO) boundaries);
(3) Correct – all Level 1/2 and 2/3 quality boundaries should be positioned correctly;
(4) Testable – from design through to certification;
(5) Unambiguous – clear and simple, easy to interpret; perhaps the most challenging of the rules, and vital for widespread acceptance;
(6) Substantiated – drawn and configured from a database derived from similar types performing similar roles; perhaps the single most important rule that underpins the credibility of new criteria.
Striving to meet the CACTUS rules is recognized as a continuing challenge for the flying qualities engineer as roles develop and new data become available. The criteria discussed in this chapter conform to the rules to varying degrees, some strongly, some hardly at all; we shall attempt to reflect on these different levels of conformity as the chapter progresses.
Turning to the framework of ADS-33, Table. 6.1 provides an overview snapshot for selected MTEs. The figure links together the key innovations of the specification – the response types (RT), the mission task elements (MTE) and the usable cue environment (UCE). The UCE, derived from pilot subjective ratings of the quality of visual task cues, will be discussed in more detail later in Chapter 7. Its introduction into ADS-33 draws attention to the need for different flying qualities in different visual conditions, in particular in so-called degraded visual environments (DVE), when flying close to the ground. A UCE of 1 corresponds to conditions where the pilot has very good visual cues to support the control of attitude and velocity, while a UCE 3 corresponds to conditions where the pilot can make small and gentle corrections only because of deficient visual cues. Table 6.1 tells us that to achieve Level 1 flying qualities in the selected MTEs, rate command is adequate in a UCE 1 while the requirements become more demanding in poorer UCEs. Attitude command is required for pitch and roll in a UCE of 2 and translational rate command with position and height hold for a UCE 3.
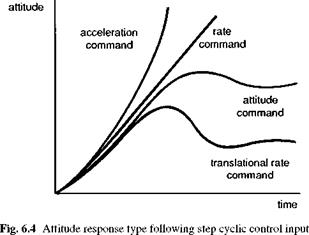
The RT relates to the character of the response in the first few seconds following a pilot-applied step control input. Figure 6.4 shows how the attitude varies for the
|
Table 6.1 Response-type requirements in different usable cue environments for selected MTEs
|
|
RC – |
rate command |
rapid bob up/down, hover turn, |
|
TC – |
turn coordination (applies to yaw and pitch response) |
rapid transition to precision hover, sonar dunking, rapid |
|
ACAH – |
attitude command, attitude hold (roll and pitch) |
sidestep, rapid accel-decel, |
|
RCDH – |
rate command, direction hold (yaw) |
target aquisition and tracking, |
|
RCHH – PH – TRC – |
rate command, height hold (heave) position hold (horizontal plane) translational rate command |
divided attention tasks |
|
|
different types in pure form, including for completeness, the acceleration RT. Rate Command (RC) response is generally regarded as the simplest practical type found with conventional helicopters. The definition of rate command in ADS-33 actually allows for variations in the response away from the pure rate to include the variety of current helicopters that do not fall neatly into the pure categories but still exhibit satisfactory handling qualities. A basic requirement is that the initial and final cockpit controller force, following an attitude change, shall be the same sign. As the RTs become more directly related to translational response, two associated factors impact the pilotage. First, attitude command (AC) is easier to fly than RC, and translational rate command (TRC) is easier to fly than attitude command, attitude hold (ACAH). With TRC, not only is the attitude loop automatically closed, thus relieving the pilot of the higher gain-attitude stabilization, but also the velocity feedback loop is automatically closed, reducing piloting essentially to a steering task. Second, the additional stability is achieved at the expense of manoeuvrability and agility. The highest performance can, in principle, be achieved with an acceleration command RT through a direct force/moment inceptor, but the pilot would have to work so hard (performing three mental integrations) to achieve flight path accuracy that the additional performance ‘available’ would almost certainly be wasted. As the RT becomes progressively more stable, the available manoeuvre performance envelope reduces. This is completely in accord with the need for the higher levels of augmentation, of course. Pilots will not normally require high performance in DVE. The different requirements highlighted by Table 6.1 reinforce the importance of task in the quality of flying. But it is not sufficient to define the RT; the detailed character of the response in the short-long term and at small-large amplitude needs quantifying. We need a framework for this deeper study of response quality.
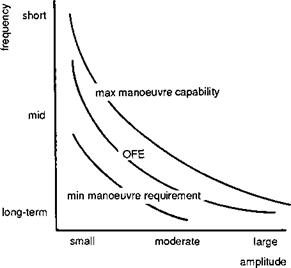
Figure 6.5 illustrates a convenient division of aircraft response characteristics on one of our reference diagrams, showing response frequency against amplitude. The discriminators – large, medium and small for amplitude and long, mid and short term for frequency – are intended to encompass, in a meaningful and systematic way, all of the task demands the pilot is likely to encounter. The framework includes the zero and very low frequency trim, and the zero and very low amplitude stability areas. A third dimension, cross-coupling, is added to highlight that direct response characteristics are insufficient to describe response quality fully. The hyperbolic-like boundary shows how the manoeuvre envelope of an aircraft is constrained – as the amplitude increases, then various physical mechanisms come into play that limit the speed at which the manoeuvre can be accomplished, e. g., control range, actuator rate, rotor thrust/moment capability, etc. The boundary represents the dynamic OFE and flying qualities criteria are required across the full range of frequency and amplitude.
This chapter is primarily concerned with the characteristics required to confer a helicopter with Level 1 flying qualities, although we shall give some attention to Level 2 characteristics since most operational helicopters spend a considerable time in Level 2.
|
Fig. 6.5 Equi-response contours on the frequency-amplitude plane |
Within the sections, each of the four primary response axes will be discussed – roll, pitch, yaw and heave, along with the variety of different cross-coupling mechanisms. The other important internal factors, inceptors and displays, will be discussed in Chapter 7; they both have strong influences in flying qualities, particularly for flight in degraded visual conditions and at flight envelope limits where tactile cueing through the pilot’s controls is particularly important. Where appropriate, some comparison with fixed – wing aircraft criteria and quality boundaries will be made. A as the reader embarks on this chapter, it is worth noting that while considerable progress has been made with helicopter flying qualities criteria between the mid-1980s and early-1990s, the evolutionary process is continuing. At the time of writing the second edition of this book the same is true, and some of the developments, particularly the requirements criteria in ADS-33, are summarized in Section 6.9. Chapter 8 addresses degraded handling qualities. The author has had to be selective with the material covered in view of the considerable amount of relevant published work in the literature. This comment is particularly germane to the coverage given to ADS-33 criteria; readers are earnestly referred to these design guidelines and associated references in the open literature for a more precise and complete definition of handling boundaries. We begin with the roll axis and this will allow us to introduce and develop a range of concepts also applicable to the other axes of control.
With this intentionally catch-all parlance, Def Stan 970 leaves it to the manufacturer to decide how this is to be achieved. In contrast, the criteria in ADS-33 quantify responsiveness and sensitivity and lay down mandatory quality boundaries on measurable parameters. A comparison of the philosophy in the two distinct approaches could occupy much of this chapter but the author is reluctant to embark on such a venture. In the author’s view, however, one thing that does need to be stressed is that the resources applied to the development of ADS-33, and the harnessing of the best international facilities, have resulted in a breakthrough in the development of helicopter flying qualities – all based on the creation of a new flying qualities test database, the absence of which has hindered several previous initiatives over the last 25 years. Def Stan 970 complements the more substantiated US requirements, and those areas where 970 provides additional insight will be highlighted in this chapter.
If we turn to flying qualities requirements for civil helicopters, we find safety a much more significant driver and the requirements are once again more qualitative in nature (Refs 6.10-6.13). Of major concern are the safety of operations in the ever – decreasing weather minima and the ability of the pilot to recover to safe flight following major system failures. Handling qualities research efforts have therefore been focused on the development of requirements for artificial stability to support IFR flight and flight test procedures for recovering from failures. The increased emphasis on military flying qualities requirements in recent years has also prompted a closer examination of the potential of the new criteria formats for civil applications. One such review is reported in Ref. 6.12, and some of the ideas arising from this study will be sampled throughout Chapters 6 and 7.
This chapter is primarily about how Level 1 helicopters should behave and how to test for compliance, not how they are made. Design issues are touched on occasionally in the context of criteria development but will not be central to the discussion. The reader is referred to Chapters 4 and 5 for implicit design considerations through the analysis of trim, stability and response. However, the subject of design for helicopter flying qualities, including bare airframe and stability and control augmentation, is left for a future book and perhaps to an author closer to the manufacturing disciplines.