Category HELICOPTER FLIGHT DYNAMICS

Beyond Level 1 Modelling

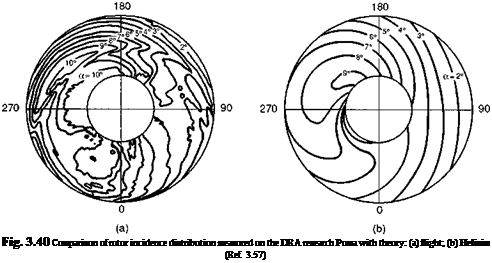
‘Theory is never complete, final or exact. Like design and construction it is continu­ally developing and adapting itself to circumstances’. We consider again Duncan’s introductory words and reflect that the topic of this final section in this model-building chapter could well form the subject of a book in its own right. In fact, higher levels of modelling are strictly outside the intended scope of the present book, but we shall attempt to discuss briefly some of the important factors and issues that need to be con­sidered as the modelling domain expands to encompass ‘higher’ DoFs, nonlinearities and unsteady effects. The motivation for improving a simulation model comes from a requirement for greater accuracy or a wider range of application, or perhaps both. We have already stated that the so-called Level 1 modelling of this chapter, augmented with ‘correction’ factors for particular types, should be quite adequate for defining trends and preliminary design work and should certainly be adequate for gaining a first-order understanding of helicopter flight dynamics. In Chapters 4 and 5 comparison with test data will confirm this, but the features that make the Level 1 rotor modelling so amenable to analysis – rigid blades, linear aerodynamics and trapezoidal wake struc­ture – are also the source of its limitations. Figure 3.40, for example, taken from Ref. 3.57, compares the rotor incidence distribution for the Puma helicopter (viewed from below) derived from flight measurements of rotor blade leading edge pressure, with the Level 1 Helisim prediction. The flight condition is a straight and level trim at 100 knots. While there are similarities in the two contour plots, theory fails to capture many of the details in the flight measurements. The region of high incidence on the retreating side is more extensive and further outboard in the flight results, and there is a clearly defined ridge in the flight measurement caused by the blade vortex interaction, which is, of course, completely missed by Helisim. At this 100-knot trim condition, Helisim may well predict the controls to trim reasonably accurately, simply because the integrated forces and moments tend to smooth out the effects of the detailed dif­ferences apparent in Fig. 3.40. However, there are a wide range of problems where the details become significant in the predictive capability of modelling. Examples include the pitch-up effect of blade stall in ‘high g’ manoeuvres, the transient rotor torque ex­cursions in rapid rolls, the effects of blade icing or battle damage on power and control

Подпись:
margins. If we consider the effects of the rotor wake on the tail rotor and empennage, then the simple trapezoidal downwash model fails to predict important effects, for example tail rotor control margins in quartering flight or the strong couplings induced by the wake effects on the rear fuselage and empennage, particularly in manoeuvres. High-fidelity simulation requires that these effects can be predicted, and to achieve this we need to consider the modelling elements at Levels 2 and 3, as described in Table 3.1. The following qualitative discussions will draw heavily from the published works of selected contributors to the field of enhanced rotorcraft modelling. The author is all too aware of the enormous amount of published work and achievements by a great number of researchers in Europe and the United States in recent years, particularly to rotor aeroelastic modelling, and a complete review is surely the topic for another text. The aim here is to draw the readers’ attention to selected advances that lay emphasis on physical understanding.

Integrated Equations of Motion of the Helicopter

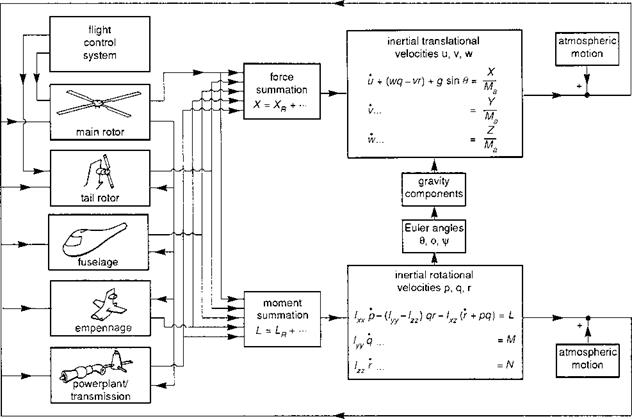
In the preceding sections the equations for the individual helicopter subsystems have been derived. A working simulation model requires the integration of the subsystems in sequential or concurrent form, depending on the processing architecture. Figure 3.39 illustrates a typical arrangement showing how the component forces and moments depend on the aircraft motion, controls and atmospheric disturbances. The general

Подпись: 160 Helicopter Flight Dynamics: Modelling

Fig. 3.39 The integrated helicopter simulation model


nonlinear equations of motion take the form

X = F(x, u, t)

(3.293)

where the state vector x has components from the fuselage xf, gine/rotorspeed Xp and control actuation xc subsystems, i. e.,

rotors xr, en-

X = {x f, Xr, X p, Xc }

(3.294)

xf = {u, w, q, Q,v, р, ф, r}

(3.295)

xr = {/A Ac, As, ^, Ao As}

(3.296)

xp = Qe, Qe}

(3.297)

xc = Ao, As, Ao Ar)

(3.298)

where we have assumed only first-order flapping dynamics.

SCAS inputs apart, the control vector is made up of main and tail rotor cockpit controls,

u = (m, ms, mc, nor) (3.299)

Written in the explicit form of eqn 3.293, the helicopter dynamic system is described as instantaneous and non-stationary. The instantaneous property of the systemrefers to the fact that there are no hysteretic or more general hereditary effects in the formulation as derived in this chapter. In practice, of course, the rotor wake can contain strong hereditary effects, resulting in loads on the various components that are functions of past motion. These effects are usually ignored in Level 1 model formulations, but we shall return to this discussion later in Section 3.4. The non-stationary dynamic property refers to the condition that the solution depends on the instant at which the motion is intitiated through the explicit dependence on time t. One effect, included in this category, would be the dependence on the variation of the atmospheric velocities – wind gusts and turbulence. Another arises from the appearance of aerodynamic terms in eqn 3.293 which vary with rotor azimuth.

The solution of eqn 3.293 depends upon the initial conditions – usually the heli­copter trim state – and the time histories of controls and atmospheric disturbances. The trim conditions can be calculated by setting the rates of change of the state vector to zero and solving the resultant algebraic equations. However, with only four controls, only four of the flight states can be defined; the values of the remaining 17 variables from eqn 3.293 are typically computed numerically. Generally, the trim states are unique, i. e., for a given set of control positions there is only one steady-state solution of the equations of motion.

The conventional method of solving for the time variations of the simulation equations is through forward numerical integration. At each time step, the forces and moments on the various components are computed and consolidated to produce the total force and moment at the aircraft centre of mass (see Fig. 3.39). The simplest integration scheme will then derive the motion of the aircraft at the end of the next time step by assuming some particular form for the accelerations. Some integration methods smooth the response over several time steps, while others step backwards and forwards through the equations to achieve the smoothest response. These various elaborations are

required to ensure efficient convergence and sufficient accuracy and will be required when particular dynamic properties are present in the system (Ref. 3.56). In recent years, the use of inverse simulation has been gaining favour, particularly for model validation research and for comparing different aircraft flying the same manoeuvre. With inverse simulation, instead of the control positions being prescribed as functions of time, some subset of the aircraft dynamic response is defined and the controls required to fly the manoeuvre computed. The whole area of trim and response will be discussed in more detail in Chapters 4 and 5, along with the third ‘problem’ of flight dynamics – stability. In these chapters, the analysis will largely be confined to what we have described as Level 1 modelling, as set down in detail in Chapter 3. However, we have made the point on several occasions that a higher level of modelling fidelity is required for predicting flight dynamics in some areas of the flight envelope. Before we proceed to discuss modelling applications, we need to review and discuss some of the missing aeromechanics effects, beyond Level 1 modelling.

Pitch and roll control

The swash plate concept was introduced in Chapter 2 (Fig. 2.5) as one of the key innovations in helicopter development, allowing one-per-rev variations in rotor blade pitch to be input in a quasi-steady manner from the actuators. The approximately 90° phase shift between cyclic pitch and the cyclic flapping response comes as a result of forcing the rotor with lift changes at resonance. In practice, cyclic pitch can be applied through a variety of mechanisms; the conventional swash plate is by far the most common, but Kaman helicopters incorporate aerodynamic surfaces in the form of trailing edge flaps and cyclic control in the Westland Lynx is effected through the so-called ‘dangleberry’, with the blade control rods running inside the rotor shaft. Whatever the physical mechanism, cyclic pitch requires very little energy to apply at one-per-rev, and, for our purposes, a generalized swash plate is considered, with a minimum of three actuators to provide the capability of tilting the swash plate at an arbitrary angle relative to the rotor shaft.
pitch jyl5


cyclic

mixer


го I


cyclic

mixer


yaw r/


interlink


collective


to pitch channel

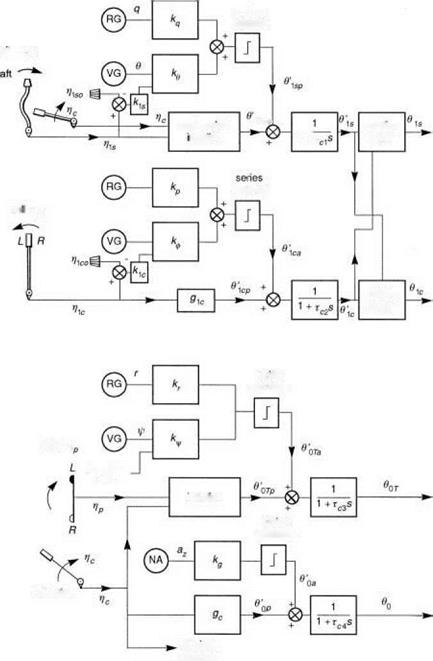
Fig. 3.36 Schematic of helicopter flight control system

Progressing downwards along the control rods (assumed rigid) from the blades, and through the rotating swash plate, we come to the so-called mixing unit. This com­bines the actuation outputs from the two cyclic controls with a phase angle. For articu­lated and hingeless rotor configurations, even in the hover, the phase lag between cyclic pitch and flap is less than 90° and, to achieve a pure pitch or roll control, the pilot needs to apply a coupled input. As the forward speed increases, the response coupling changes due to the increased aerodynamic damping effects. A single mixing is usually selected as a compromise between these different conditions and can be written in the form

Подпись: $1s cos ^f sin X^f '$1 s' $1c — sin ^f cos X^f _$1 c_ (3.279)

where tyf is the mixing angle, usually between 8° and 12°, and a prime simply denotes the cyclic angle before mixing.

The next stage in the reverse sequence is the actuation itself. Most modern helicopters incorporate powered flying controls through hydraulic actuation. The actuation system is quite a complicated mechanism with its own feedback control designed to ensure that the response and stability to control inputs has good perfor­mance and stability characteristics. The actuation system has inherent nonlinearities at both small and large amplitudes, including rate limiting when the pilot demands more than the hydraulic system can supply. Typical rate limits are of the order 100% of full actuator range per second. Helicopters fitted with an AFCS usually incorporate a limited authority series actuation system driven by the voltage outputs of the SCAS element. As shown in Fig. 3.36, these augmentation inputs to the actuators are limited to amplitudes of the order ±10% of the full actuator throw. For our purposes we assume that each actuation element can be represented by a first-order lag, although it has to be recognized that this is a crude approximation to the complex behaviour of a complcated servo-elastic system; hence, we write the cyclic actuator outputs as the sum of pilot (subscript p) and AFCS (subscript a) inputs in the transfer function form

$ 1s p + $ 1sa 1s 1 + Tc1s

(3.280)

! $ 1c + $ 1c 77 1cp 1ca

$ 1c — ч

1 + Tc2s

(3.281)

The time constants Tc1 and Tc2 are typically between 25 and 100 ms, giving actuation bandwidths between 40 and 10 rad/s. For systems operating at the lower end of this

bandwidth range, we can expect the actuation to inhibit rapid control action by the pilot.

The mechanical control runs connect the actuators to the pilot’s cyclic stick through a series of levers and pulleys. At the stick itself, an artificial feel system is usually incorporated to provide the pilot with stick centring tactile cues. A simple spring with a breakout force is the most common form of feel system found in heli­copters, with a constant spring gradient, independent of flight condition or manoeuvre state. If we neglect the dynamics of these elements, then the relationship for roll and pitch cyclic can be written in the simple algebraic form as

$1 Cp — g1co + g1ci mc + (gcco + gcci Vic)Vc (3.283)

where the g coefficients are the gains and offsets, and nic and nis are the pilot’s cyclic stick inputs. Included in the above equations are simple interlinks between the collective and cyclic, so that a collective input from the pilot also drives the cyclic control runs. In this way, collective to roll and pitch couplings can be minimized. The coefficients in eqns 3.282-3.283 can conveniently be expressed in terms of four parameters:

61s0 – the pitch at zero cyclic stick and zero collective lever V1si – the pitch at maximum cyclic stick and zero collective lever $1s2 – he pitch at zero cyclic stick and maximum collective lever 6iS3 – the pitch at maximum cyclic stick and maximum collective lever

The coefficients can therefore be written as

g1so — $1so g1s1 — &1s1 — $1s0 g1co — $1s2 — $1S1

g1c1 — ($1s3 – &1s2) – ($1s1 – 01so) (3.284)

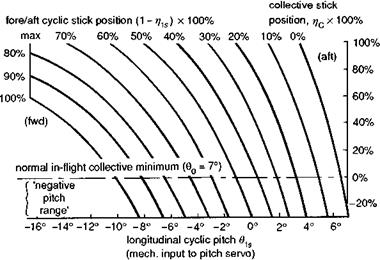
This analysis assumes a linear relationship between control movement and actuator input. In practice, the mechanical system will exhibit some nonlinearities particularly at the extremities of control throw due to the geometry of the linkage, and look-up tables will be a more appropriate representation. For example, Fig. 3.37 illustrates the cyclic/collective interlink functionality for the Lynx helicopter (Ref. 3.54).

With regard to the autostabilizer inputs, these will, in general, be complex func­tions of sensor and control inputs with various filters arranged to stabilize the feedback

Fig. 3.37 Geometry of mechanical interlink between collective and cyclic for Lynx

(Ref. 3.54)

dynamics and protect against sensor noise. For the present purposes we shall assume that the autostabilizer adds feedback control signals proportional to attitude and an­gular rate, together with a feedforward signal proportional to the pilot’s control input, referred to some adjustable datum (Fig. 3.36). This allows the zero or mid-range of the autostabilizer to be reset by the pilot during flight. This would be necessary, for exam­ple, if the attitude gains were high enough to cause saturation as the speed increases from hover to high speed. Other systems automatically disengage the attitude stabiliza­tion when the pilot moves his control, thus obviating the need for a pilot-adjustable zero (e. g., Puma). The simple proportional autostabilizer can be described by the equations

Oisa = keO + kqq + kis (nis – nis0) (3.285)

Oica = kфф + kpp + kic (nic – nic0) (3.286)

In Chapter 4, we shall demonstrate how rate stabilization alone is typically inadequate for stabilizing a helicopter’s unstable pitch motion. However, with a combination of fairly modest values of rate and attitude gains, k (O (0.i)), a helicopter can be stabilized throughout its OFE, and a pilot can fly ‘hands off’ or at least with some divided attention, hence allowing certification in IFR conditions. However, a low-authority AFCS will quickly saturate in aggressive manoeuvres, or during flight in moderate to severe turbulence, and can be regarded only as an aid to steady flight.

Yaw control

Подпись: 0 0T Подпись: 0 0Tp + 0 0Ta i + Tc3s Подпись: (3.287)

In a similar way, the pilot and autostabilizer commands are input to the yaw actuator servo in the simplified first-order transfer function form

The gearing between the actuator input and the yaw control run variable, ncT, can be written as

e0Tp = gTo + gTi ncT (3.288)

where the control run is generally proportional to both pedal, np, and collective lever, nc, inputs, in the form

ncj = gcT0(i – np) + Iі – 2gcTo) nc (3.289)

In eqn 3.289, the collective lever accounts for the normal mechanical interlink between collective and yaw to reduce yaw excursions following power inputs. Equation 3.289 is a linear approximation to a relationship that can become strongly nonlinear at the extremes of the control range, when the interlink geometry reduces the sensitivity. Figure 3.38 illustrates the nonlinear variation for the Lynx helicopter (Ref. 3.54).

Heave control

Finally, the main rotor collective pitch output from the main rotor servos, achieved through raising and lowering the swash plate, can be written in terms of the mechanical

and electrical inputs from the pilot and autostabilizer respectively, namely

Подпись:Подпись: (3.291)

– 0 0p + 0 0a

0 0 = T1—————-

1 + Tc4s

The gearing with the collective lever is written as

°0p = gc0 + gc1 Пс

For most modern helicopters, there is no autostabilizer component in the collective channel, but for completeness we include here a simple model of the so-called collective acceleration control (Ref. 3.55) found in the Lynx. An error signal proportional to the normal acceleration is fed back to the collective, i. e.,

00a = kgaz (3.292)

For the Lynx, this system was implemented to provide dissimilar redundancy in the SCAS. At high speeds, the collective is a very effective pitch control on hingeless rotor helicopters, and this additional loop supplements the cyclic stabilization of aircraft pitch attitude and rate.
Flight control system

The flight control system model includes the pilot’s controls, mechanical linkages, actuation system and control rods; it also includes any augmentation through feedback control and hence will, in general, encompass the sensors, computing element and any additional actuation in parallel and/or in series with those driven by the mechanical inputs from the pilot. This description corresponds to the classical layout found in most contemporary helicopters. Discussion on the modelling requirements for full authority, digital, active control systems are not covered in this book. We refer to Fig. 3.36 as we develop the model of the flight control system, from the rotors through to the cockpit controls – the cyclic, collective and pedals. In the following analysis, the cockpit controls are represented by the variable n, with appropriate subscripts; in all cases,

0 < n < 1 (3.278)

with the positive sense defined by a positive increase in the corresponding rotor blade angle (see Fig. 3.36). The automatic flight control system (AFCS) is usually made up of stability and control augmentation system (SCAS) functions, applied through series actuators, and autopilot functions applied through parallel actuators. In this section we consider only the modelling of the SCAS.

Powerplant and rotor governor

In this section we derive a simplified model for a helicopter’s rotorspeed and associated engine and rotor governor dynamics based on the Helisim powerplant model (Ref. 3.4). The rotorspeed of a turbine-powered helicopter is normally automatically governed to operate over a fairly narrow range with the steady-state relationship given by the equation

Подпись: (3.266)Qe = – K3(a – Пі)

where Qe is the turbine engine torque output at the rotor gearbox, Й is the rotorspeed and Q, i is the so-called idling rotorspeed, corresponding to approximately zero engine torque. Equation 3.266 is sometimes described as the droop law of the rotor, the droop constant K3 indicating the reduction in steady-state rotorspeed between autorotation and full power (e. g., in climb or high-speed flight). The rotor control system enforces this droop to prevent any ‘hunting’ that might be experienced should the control law attempt to maintain constant rotorspeed. Rotorspeed control systems typically have two components, one relating the change (or error) in rotorspeed with the fuel flow, af, to the engine, i. e., in transfer function form

-^[Ge(s)] -^ (3.267)

af

the second relating the fuel input to the required engine torque output

Подпись: (3.268)a f

—– ► [ He(s)]

The most simple representative form for the fuel control system transfer functions is a first-order lag

a f (s)


Kei

1 + Te1s


Ge(s)


(3.269)


where a bar above a quantity signifies the Laplace transform.

The gain Kei can be selected to give a prescribed rotorspeed droop (e. g., between 5 and 10%) from flight idle fuel flow to maximum contingency fuel flow; we write the ratio of these two values in the form

a fmax a fidle


(3.270)


mi


The time constant re1 will determine how quickly the fuel is pumped to the turbine and, for a fast engine response, needs to be 0(0.1 s).

The engine torque response to the fuel injection can be written as a lead-lag element

Подпись:1 + re2s 1 + re3s

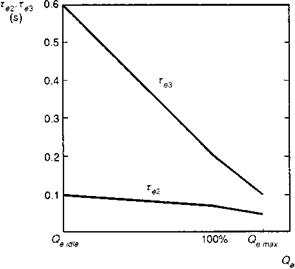
Fig. 3.35 Variation of engine time constants with torque

The gain Ke2 can be set to give, say, 100% Qe at some value of fuel flow rn f (e. g., 75% o)fmax), thus allowing a margin for maximum contingency torque. In the engine model used in Ref 3.4, the time constants in this dynamic element are a function of engine torque. Figure 3.35 illustrates the piecewise relationship showing tighter control at the engine power limit. Linear approximations for the lag and lead constants can be written in the form

%2 — Te2(Qe) ^ T20 + T21 Qe

Te3 — Te3(Qe) ~ T30 + T31 Qe (3.272)

where the time constant coefficients change values at Qe — 100%.

Coupling the two-engine/rotor subsystems gives the transfer function equation

H — Ge (s) He (s) (3.273)

or, in time-domain, differential form

Qe —————- {(Te1 + re3) Qe + Qe + K3 (й — + Te2й)} (3.274)

тЄ1 тЄ3

where

K3 — Ke1 Ke2 —————- Qemax————————————— (3.275)

3 e1 e2 (1 — ttmt) ‘ ‘

and

This second-order, nonlinear differential equation is activated by a change in rotor speed and acceleration. These changes initially come through the dynamics of the rotor/transmission system, assumed here to be represented by a simple equation relating the rotor acceleration (relative to the fuselage, — r) to the applied torque, i. e., the

difference between the applied engine torque and the combination of main rotor Q r and tail rotor torque Qt, referred to the main rotor through the gearing gT, i. e.,

1

^ = r + —(Qe — qr — gTQT) (3.277)

Ir

where Ir is the combined moment of inertia of the rotor hub and blades and rotating transmission through to the free turbine, or clutch if the rotor is disconnected as in autorotation.

The empennage aerodynamic forces and moments

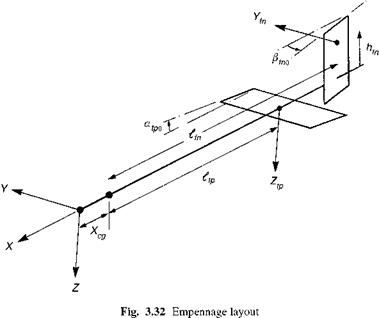
The horizontal tailplane and vertical fin, together forming the empennage of a heli­copter, perform two principal functions. In steady forward flight, the horizontal tailplane generates a trim load that reduces the main rotor fore-aft flapping; similarly, the verti­cal fin generates a sideforce and yawing moment serving to reduce the tail rotor thrust requirement. In manoeuvres, the tail surfaces provide pitch and yaw damping and stiff­ness and enhance the pitch and directional stability. As with the fuselage, the force and moments can be expressed in terms of coefficients that are functions of incidence and sideslip angles. Referring to the physical layout in Fig. 3.32, we note that the principal components are the tailplane normal force, denoted Ztp, and given by

1 2

Ztp = 2pVtpStpCztp(atp, Ptp) (3.252)

which gives rise to a pitching moment at the centre of gravity, i. e.,

Mtp = (ltp + xcg) Ztp (3.p53)

and the fin sideforce, denoted by Yfn, i. e.,

1 2

Yfn = pPVfrSfnCyjn(afn, f) (3.254)

which gives rise to a yawing moment at the centre of gravity, i. e.,

Подпись: (3.255)

Nfn — (lfn + xcg) Yfn

where Stp and Sfn are the tailplane and fin areas respectively.

The local incidence at the tailplane, assumed constant across its span, may be written as

where

Подпись: Vtp(3.259)

Подпись: ltp - R hr - htp Подпись: and Подпись: ltp hr — htp Подпись: (3.260)

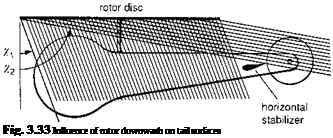
The parameter kxtp defines the amplification of the main rotor wake uniform velocity from the rotor disc to the tail. The tailplane incidence setting is denoted by atp0. The main rotor wake will impinge on the horizontal tail surface only when the wake angle falls between X1 and X2, given by (see Fig. 3.33)

otherwise, kxtp can be set to zero.

In Ref. 3.49, Loftin gives wind tunnel measurements for a NACA 0012 aerofoil section for the complete range of incidence, -180° < a < 180°. From these data, an approximation to the normal force coefficient can be derived in the form

Cztp < Cztpl Cztp (atp) — a0tp sin atp (3.261)

і і sin atp

|QJ > Czp Czp(atp) — – Czp у—p (3-262)

Подпись: Fig. 3.33 Influence of rotor downwash on tail surfaces

where a0p is, effectively, the slope of the tailplane lift coefficient curve for small angles of incidence. The value of this parameter is assumed to be a mean value for the whole surface. Typically, helicopter tailplanes are fairly low aspect ratio surfaces, sometimes having endplates to increase the effective angle of attack. Values of a0tp between 3.5

and 4.5 are typical. The constant limit value Cztpi is approximately 2 for the NACA 0012 aerofoil, corresponding to the drag coefficient in two-dimensional vertical flow.

The above formulation, leading to constant rotor downwash over the tailplane, can be improved in two relatively simple respects. First, the spanwise variation of downwash at the tail can be derived from the lateral distribution of downwash from the main rotor, Лі. Second, the downwash at time t at the tail can be estimated from the loading conditions at time t — St on the main rotor, where St is the time taken for the flow to reach the tail. This effect manifests itself in an acceleration derivative, or force and moment due to rate of change of incidence, and is discussed in more detail in Chapter 4. The lateral variation in downwash over the horizontal tail generates a roll moment and can also lead to a strong variation of pitching moment with sideslip, as discussed by Cooper (Ref. 3.50) and Curtiss and McKillip (Ref. 3.51).

Подпись: (3.263) (3.264) (3.265)

The local angle of sideslip and velocity (in x-y plane) at the vertical fin may be written in the form

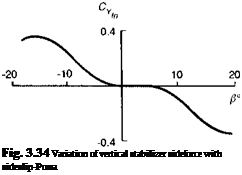
The loading on the vertical surface can be derived in much the same way as the tailplane, either as a simple analytic function or via a table look-up. One additional complexity, characteristic of helicopter fins, is that they are sometimes quite thick aerofoil sections, carrying within them the tail rotor torque tube. The lift generated at small values of incidence on aerofoils with thickness ratios greater than about 20% can be negated by the lower surface suction near the trailing edge, as discussed by Hoerner and Borst (Ref. 3.52). Figure 3.34, approximated from wind tunnel measurements on the SA 330 Puma (Ref. 3.53), shows how the fin sideforce varies with sideslip angle; over the first 5° of incidence, no lift (sideforce) is produced. This effect partly explains the loss of directional stability and attendant weak Dutch roll damping on the Puma, an aspect that will be the subject of further discussion in Chapters 4 and 5.

Подпись: Fig. 3.34 Variation of vertical stabilizer sideforce with sideslip-Puma

The forces generated by the empennage at small values of incidence and sideslip can be represented either by look-up tables or by high-order polynomials, e. g., the Puma

fin sideforce requires at least a fifth-order function to match the strongly nonlinear feature illustrated in Fig. 3.34 (see the Appendix, Section 4B.1).

The fuselage aerodynamic forces and moments

The flow around the fuselage and empennage is characterized by strong nonlinear­ities and distorted by the influence of the main rotor wake. The associated forces and moments due to the surface pressures and skin friction are therefore complex functions of flight speed and direction. While computer modelling of the integrated flowfield is no longer an impossible task, most of the flight mechanics modelling to date has been based on empirical fitting of wind tunnel test data, gathered at a limited range of dynamic pressure and fuselage angles of incidence, at model (Ref. 3.47) or full scale (Ref. 3.48). Assuming ‘similar’ fluid dynamics at the test and full-scale flight conditions, we note that the forces at a general flight speed, or dy­namic pressure, can be estimated from the data at the measured conditions through the relationship

/ pfV2S

F(V, pf) = F(Vtest, Ptest) ———– ‘f 1 (3.240)

ptestVt2estStest)

where the subscript test refers to the tunnel test conditions and S is a reference area. Most of the published test data have been measured on isolated fuselage shapes, although the findings of Ref. 3.47 have shed light on the principal effects of rotor wake/fuselage interaction and the approximate formulation outlined below is based on this work.

The three most significant components in forward flight are the fuselage drag, which dominates the power requirement at high speed, and the pitching and yawing moment changes with incidence and sideslip respectively. The fuselage rolling mo­ment is usually small except for configurations with deep hulls where the fuselage aerodynamic centre can be significantly below the aircraft centre of gravity. At lower speeds, the fuselage aerodynamic loads are correspondingly smaller, although signif­icant effects will be the sideforce in sideways flight and the vertical load and yawing moment due to the main rotor wake. The fuselage moments are generally destabilizing, resulting from the greater planform and side area ahead of the aircraft centre of gravity. These two points will not, in general, be coincident. In addition, wind tunnel test data are relative to a third point, generally referred to as the ‘fuselage aerodynamic refer­ence point’, to be distinguished from our ‘fuselage reference point’ below the main rotor hub on the aircraft x-axis. Fuselage aerodynamic data measured in a wind tunnel are usually presented in wind tunnel axes as lift, drag, sideforce and corresponding moments about the tunnel-fixed reference system. We assume that the transformation from wind tunnel to fuselage axes has been applied so that we work with forces in the moving fuselage axes system. The effect of rotor downwash can be approximately taken into account by assuming the fuselage is immersed in the uniform component, through the assumption of superposition; hence, the fuselage incidence and velocity can be written as

af = tan-1 ^^ , Vf = (u2 + v2 + w2)1/2, k® < 0 (3.241)

af = tan-1 ^ , Vf = (u2 + v2 + wk)1/2, ko > 0 (3.242)

where

wk = w – kkf ЯRko (3.243)

and kkf is a constant taking into account the increase in downwash at the fuselage relative to the rotor disc. The fuselage sideslip angle is defined as

P f = sin-1( V_j (3.244)

The forces and moments may now be written in the generalized form:

12

Xf = 2 P V2 SpCxf (a f, Pf) (3.245)

12

Zf = 2 P Vf SpCzf (a f, Pf) (3.246)

12

Mf = 2PVjSplfCmf (af, Pf) (3.247)

12

Yf = 2 P Vf SsCyf (a f, Pf) (3.248)

12

Lf = 2PVjSslfClf (af, Pf) (3.249)

12

Nf = 2pVfSslfCnf(af, Pf) (3.250)

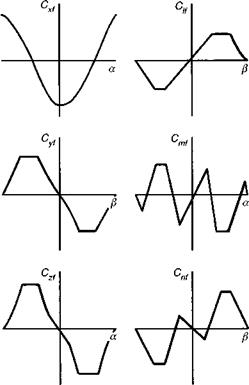
where Sp and Ss are the plan and side areas of the helicopter fuselage, respectively. Typ­ically, the force and moment coefficients will be derived from table look-up functions of incidence and sideslip. Piecewise linear variations illustrating the main character­istics over the incidence and sideslip range, -180° to +180°, are shown in Fig. 3.31. The yaw moment is sometimes defined as two functions corresponding to forward and rearward flight, i. e.,

Cnf — Cnfa, u > 0

Cnf = Cnfb, u < 0 (3.251)

The fuselage X force has a minimum value at small angles of incidence, and is prac­tically zero in vertical flight (a = 90°). The pitching moment increases linearly with incidence up to some moderate value when flow separation at the leeward fuselage hull causes a loss in circulatory lift and moment and a corresponding loading reversal. The Y and Z forces have similar shapes, rising to maximum values at 90° of incidence

Fig. 3.31 Typical variation of fuselage aerodynamic force coefficients with incidence angles

and sideslip respectively. The breakpoints shown in Fig. 3.31 are very much dependent on the particular fuselage configuration. To account for local, more strongly nonlinear effects, smaller incidence and sideslip intervals would certainly be required. Numeri­cal values for Lynx, Bo105 and Puma fuselage aerodynamic coefficients are given in Appendix 4B. Here the data are taken from wind tunnel tests conducted so that X, Z and M varied only with angle of incidence and Y and N varied only with angle of sideslip. Using these data in conjuction with the equations 3.241-3.250, one should be careful to acknowledge the absence of the cross effects, e. g., the variation of X force with sideslip. The simplest expedient is to delete the v2 term in the expression for Vf, eqns 3.241 and 3.242. A more general approach could be to assume a simple cos в shape so that the X force becomes zero at в = 90°.

The above discussion has been restricted to essentially steady effects whereas, in practice, the relatively bulbous shapes of typical helicopter fuselages, with irregular contours (e. g., engine and rotor shaft cowlings), give rise to important unsteady sepa­ration effects that are difficult to simulate accurately at model scale; unsteady effects in manoeuvring flight are also difficult to account for. The problem is exacerbated by the immersion in the rotor downwash at low speed. Sophisticated wind-tunnel and computer modelling techniques are available nowadays but are often very expensive, and confidence in such techniques is still reduced by lack of full-scale validation data.

The tail rotor

The tail rotor operates in a complex flowfield, particularly in low-speed flight, inground effect, sideways flight and in the transition to forward flight. The wake of the main rotor, together with the disturbed air shed from the main rotor hub, rear fuselage and vertical stabilizer, interacts with the tail rotor to create a strongly non-uniform flowfield that can dominate the tail rotor loading and control requirements. The basic

equations for tail rotor forces and moments are similar to those for the main rotor, but a high-fidelity tail rotor model will require a sophisticated formulation for the normal and in-plane components of local induced inflow. Initially, we shall ignore the non-uniform effects described above and derive the tail rotor forces and moments from simple considerations. The interactional effects will be discussed in more detail in Section 3.4.2. The relatively small thrust developed by the tail rotor, compared with the main rotor (between 500 and 1000 lb (2220 and 4440 N) for a Lynx-class helicopter), means that the X and Z components of force are also relatively small and, as a first approximation, we shall ignore these.

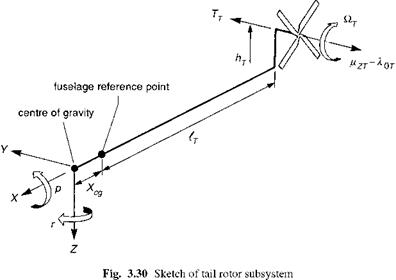
Referring to the tail rotor subsystem in Fig. 3.30, we note that the tail rotor sideforce can be written in the form

Yt = P(atRt)2sra0T(nR2T)(Ft (3.219)

a0TSTj

Подпись: CTT Подпись: TT P(QTRT )2(n RT) Подпись: (3.220)

where ат and Rt are the tail rotor speed and radius, st and a0T the solidity and mean lift curve slope, and Ctt the thrust coefficient given by eqn 3.220:

Подпись: FT = 1 Подпись: 3 Sfn 4 nR?T Подпись: (3.221)

The scaling factor Ft is introduced here as an empirical fin blockage factor, related to the ratio of fin area Sfn to tail rotor area (Ref. 3.46):

Подпись: (3.222)

Подпись: , (HZT 7OT) , HT + 2 + ~2 вит
Подпись: 2CIL) = вА Л + 314 a0Tsj 3 I 2 HT

Using the same two-dimensional blade element theory applied to the main rotor thrust derivation, we can write the tail rotor thrust coefficient as

where 0qt and 0* are the effective tail rotor collective and cyclic pitch respectively. Tail rotors are usually designed with a built-in coupling between flap and pitch, the S3 angle, defined by the parameter ^3 = tan S3, hence producing additional pitch inputs when the rotor disc cones and tilts (in MBC parlance). This coupling is designed to reduce transient flapping angles and blade stresses. However, it also results in reduced control sensitivity; the relationship can be written in the form

00T = 0Ot + k-3 вот

0*sT = 01st + hPtsT (3.223)

where 0ot and 0ist are the control-system – and pilot-applied control inputs; the cyclic inputs are usually zero as tail rotors are not normally fitted with a tilting swash plate. Note that the cyclic change is applied at the same azimuth as the flapping, rather than with the 90° phase shift as with swash-plate-applied cyclic on the main rotor; the S3 – applied cyclic is therefore fairly ineffective at reducing disc tilt and is actually likely to give rise to more first harmonic cyclic flapping than would otherwise occur. Again, using the main rotor derivations, particularly the coning relationship in eqn 3.64, we note that the effective collective pitch may be written as

0Ot + k3 ( 872 ) 3 {Hz — 70т)

0*t =——————- ————————————- (3.224)

1 – T (! + HT)

The S3 angle is typically set to -45°, which reduces the tail rotor control effectiveness significantly. The cyclic flap angles can be written in the hub-wind axes form (using the cyclic relationships in eqn 3.64)

(3.225)

HT0Ot 2HT (Hzt 7Ot) k3 (3 + 2ht^ ftlswT (3.226)

eicwT —

Подпись: (3.227)

The tail rotor hub aerodynamic velocities are given by

where the velocities of the tail rotor hub relative to the aircraft centre of gravity have been taken into account, and the factor kiT scales the normal component of main rotor inflow at the tail rotor (at this point no time lag is included, but see later in Chapter 4). The tail rotor uniform inflow is given by the expression

The inflow is determined iteratively in conjunction with the tail rotor thrust coefficient. In the above equations we have assumed that the tail rotor has zero hinge moment, a valid approximation for the rotor forces. For teetering hub blade retention (e. g., in the Bo105), the coning angle at the hub centre can be assumed to be zero and no collective pitch reductions occur.

The tail rotor torque can be derived using the same assumptions as for the main rotor, i. e.,

Подпись:Подпись: (3.231)Подпись: (3.232)Qt = – p(QtRt)2nR3T a0T st (—— 2 a0TsT
with induced and profile torque components as defined by

= (Pzr – ^0t)(^CtL) + – OL – (1 + 34)

a0T sT 4a0T

The mean blade drag coefficient is written as

$T = $0T + &2TC T

While the tail rotor torque is quite small, the high rotorspeed results in a significant power consumption, which can be as much as 30% of the main rotor power and is given by the expression

Pt = Qt Qt (3.233)

The tail rotor forces and moments referred to the aircraft centre of gravity are given approximately by the expressions

Xt ~ TtPcT

(3.234)

£

II

>7

(3.235)

Zt ~ – TtPisT

(3.236)

Lt ~ hT^T

(3.237)

mT ~ (lT + xcg)ZT – qt

(3.238)

NT = -(lT + xcg)YT

(3.239)

The above expressions undoubtedly reflect a crude approximation to the complex aerodynamic environment in which the tail rotor normally operates, both in low – and high-speed flight. We revisit the complexities of interactional aerodynamics briefly in Section 3.4.2.

3.2.2 Fuselage and empennage

Ground effect on inflow and induced power

Operating helicopters close to the ground introduces a range of special characteristics in the flight dynamic behaviour. The most significant is the effect on the induced velocity

(a)


(b)

Fig. 3.26 Lynx (a) and Bo105 (b) rotor hubs


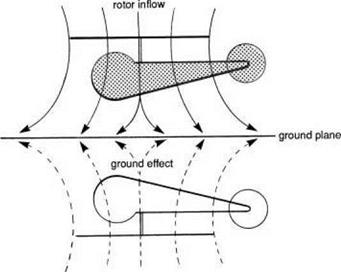
Fig. 3.27 Ground effect on a helicopter in hovering flight


at the rotor and hence the rotor thrust and power required. A succinct analysis of the principal effects from momentum considerations was reported in Ref. 3.43, where, in addition, comparison with test data provided useful validation for a relatively simple theory. Close to the ground, the rotor downwash field is strongly influenced by the surface as shown in Fig. 3.27. In Ref. 3.43, Cheeseman and Bennett modelled the ground plane influence with a rotor of equal and opposite strength, in momentum terms, at an equidistance below the ground (Fig. 3.27). This mirror image was achieved with a simple fluid source that, according to potential flow theory, served to reduce the inflow Vi at the rotor disc in hover by an amount given by

Подпись:AdVi

16n zg

where Zg is the distance of the ground below the rotor disc and Ad is the rotor disc area. The rotor thrust, at constant power, can be written as the ratio of the induced velocity out-of-ground effect (oge) to the induced velocity in-ground effect (ige). Reference 3.43 goes on to derive an approximation for the equivalent thrust change in forward flight with velocity V, the approximation reducing to the correct expression in hover, given by eqn 3.218.

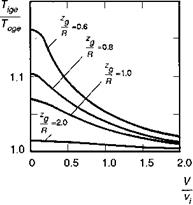
Подпись: Tige Toge Подпись: Figure 3.28 illustrates the variation in normalized thrust as a function of rotor height above ground and forward velocity. Ground effect is most significant in hover, and, below heights of the order of a rotor radius, thrust increments of between 5 and 15% are predicted. In forward flight, ground effect becomes insignificant above normalized(3.218)

Fig. 3.28 Influence of ground effect on rotor thrust (Ref. 3.43)

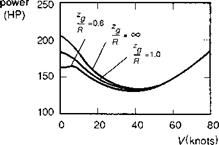
Fig. 3.29 Influence of ground effect on power (Ref. 3.43)

speeds of 2. Simple momentum considerations are unable to predict any influence of blade loading on ground effect. By combining momentum theory with blade element theory, it can be shown that (Ref. 3.43) increasing blade loading typically reduces ground effect such that a 10% increase in blade loading reduces the ige thrust increment by about 10%. Another interesting result from these predictions is that the increase in power required as a helicopter transitions oge is greater than the decrease in power due to the reduction in induced velocity. Figure 3.29, from Ref. 3.43, illustrates the point, showing the variation in power required as a function of forward speed, and reflects practical observations that a power increase is required as a helicopter flies off the ground cushion (Ref. 3.44). Further discussion of ground effect, particularly the effects on non-uniform inflow and hub moments, can be found in Ref. 3.45.

Rotor in-plane motion – lead-lag

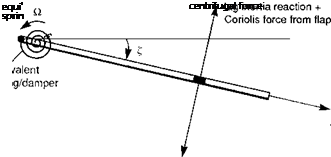
Rigid or elastic lead-lag blade motion attenuates the in-plane forces on the rotor. On articulated rotors, the rigid-blade lead-lag motion revolves about an offset hinge, necessary to enable the applied torque to rotate the rotor. On hingeless rotors, lead – lag takes the form of in-plane bending. Because the in-plane aerodynamic damping forces are low, it is usual to find mechanical dampers attached to the lead-lag hinge. Additional mechanical in-plane damping is even found on some hingeless rotors. A comprehensive discussion on the significance of lead-lag on blade stability and loads is provided by Johnson in Ref. 3.7. For most flight mechanics analysis, the presence of lead-lag motion contributes little to the overall response and stability of the helicopter. There is one aspect that is relevant and needs to be referred to, however. To aid the discussion, the coupled equations of flap/lead-lag motion are required; for the present purposes, we assume that the flap and lag blade inertias are equal and describe the
coupled motion in the simplified form:

Подпись:Подпись: (3.211)Ґ + kjp — 2ez = Mf

Z" + CzZ + k* Z + 2вв = Ml

We assume that both the flap (в) and lead-lag (Z) motion can be approximated by the centre-spring equivalent model as illustrated in Figs 3.6 and 3.22. The direct inertial forces are balanced by restoring moments; in the case of the lag motion, the centrifugal stiffening works only with an offset lag hinge (or centre-spring emulation of centrifugal stiffness). If the lag hinge offset is ez, then the frequency is given by

(3.212)

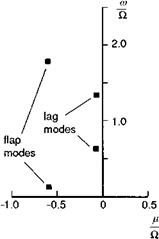
The natural lag frequency kz is typically about 0.25Й for articulated rotors; hingeless rotors can have subcritical (< Й, e. g., Lynx, Bo105) or supercritical (> Й, e. g., pro­pellers) lag frequencies, but kz should be far removed from Й to reduce the amount of in-plane lag response to excitation. The flap and lag equations above have a similar form. We have included a mechanical viscous lag damper Cz for completeness. Mf and ML are the aerodynamic flap and lag moments. Flap and lag motions are coupled, dynamically through the Coriolis forces in eqns 3.210 and 3.211, and aerodynami­cally from the variations in rotor blade lift and drag forces. The Coriolis effects are caused by blade elements moving radially as the rotor flaps and lags. Because of the lower inherent damping in lag, the Coriolis moment tends to be more significant in the lag equation due to flap motion. In addition, the lag aerodynamic moment ML will be strongly influenced by in-plane lift forces caused by application of blade pitch and vari­ations in induced inflow. The impact of these effects will be felt in the frequency range associated with the coupled rotor/fuselage motions. In terms of MBCs, the regressing and advancing lag modes will be located at (Й — kz) and (Й + kz) respectively. A typical layout of the uncoupled flap and lag modes is shown on the complex eigen­value plane in Fig. 3.23. The flap modes are well damped and located far into the left plane. In contrast, the lag modes are often weakly damped, even with mechanical

Fig. 3.23 Flap and lag mode eigenvalues

dampers, and are more susceptible to being driven unstable. The most common form of stability problem associated with the lag DoF is ground resonance, whereby the coupled rotor/fuselage/undercarriage system develops a form of ‘flutter’; the in-plane rotation of the rotor centre of mass resonates with the fuselage/undercarriage system.

Another potential problem, seemingly less well understood, arises through the coupling of rotor and fuselage motions in flight. Several references examined this topic in the early days of hingeless rotor development (Refs 3.38, 3.39), when the em­phasis was on avoiding any hinges or bearings at the rotor hub to simplify the design and maintenance procedures. Control of rotor in-plane motion and loads through feed­back of roll motion to cyclic pitch was postulated. This design feature has never been exploited, but the sensitivity of lag motion to attitude feedback control has emerged as a major consideration in the design of autostabilization systems. The problem is discussed in Ref. 3.6 and can be attributed to the combination of aerodynamic effects due to cyclic pitch and the powerful Coriolis moment in eqn 3.211. Both the regressing and advancing lag modes are at risk here. In Ref. 3.40, Curtiss discusses the physical origin of the couplings and shows an example where the advancing lag mode actually goes unstable at a relatively low value of gain in a roll rate to lateral cyclic feedback control system (-0.2°/°/s). In contrast, the roll regressing mode can be driven unstable at higher values of roll attitude feedback gain. The results of Ref. 3.40 and the later Bo105 study by Tischler (Ref. 3.41) give clear messages to the designers of autostabi­lizers and, particularly, high gain active control systems for helicopters. Designs will need to be evaluated with models that include the lead-lag dynamics before implemen­tation on an aircraft. However, the modelling requirements for specific applications are likely to be considerably more complex than is implied by the simple analysis outlined above. Pitch-flap-lag couplings, nonlinear mechanical lag damping and pre-cone are examples of features of relatively small importance in themselves, but which can have a powerful effect on the form of the coupled rotor/fuselage modes.

Of course, one of the key driving mechanisms in the coupling process is the development of in-plane aerodynamic loads caused by blade pitch; any additional
dynamic blade twist and pitch effects will also contribute to the overall coupled motion, but blade pitch effects have such a profound first-order effect on flapping itself that it is in this context that they are now discussed.

Rotor blade pitch

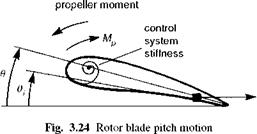
In previous analysis in this chapter the blade pitch angle was assumed to be prescribed at the pitch bearing in terms of the cyclic and collective applied through the swash plate. Later, in Section 3.4, the effects of blade elastic torsion are referred to, but there are aspects of rigid blade pitch motion that can be addressed prior to this. Consider a centrally hinged blade with a torsional spring to simulate control system stiffness, Ke, as shown in Fig. 3.24. For simplicity, we assume coincident hinges and centre of mass and elastic axis so that pitch-flap coupling is absent. The equation of motion for rigid blade pitch takes the form

Подпись: (3.213)

0ff + 0 — Mp + «2 9(

where the pitch natural frequency is given by

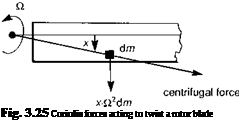
xQ — 1 + «2 (3.214)

Подпись: Fig. 3.25 Coriolis forces acting to twist a rotor blade

where Mp is the normalized applied moment and 0i is the applied blade pitch. The natural frequency for free pitch motion (i. e., with zero control system stiffness) is one – per-rev; on account of the so-called propeller moment contribution to the restoring moment. This effect is illustrated in Fig. 3.25 where mass elements along the chord line experience in-plane inertial moments due to small components of the large centrifugal force field. For rigid control systems, 0 — 0i. The control system stiffness is usually relatively high, giving values of me between 2 and 6 Й. In this range we usually find the first elastic torsion mode frequency, the response of which can dominate that of

the rigid blade component. A similar form to eqn 3.213 will apply to the first elastic mode, which will have a nearly linear variation along the blade radius. This aspect will be considered later in Section 3.4, but there are two aspects that are relevant to both rigid and elastic blade torsion which will be addressed here.

First, we consider the gyroscopic contribution to the applied moment Mp. Just as we found with flap motion earlier in this chapter, as the rotor shaft rotates under the action of pitch and roll moments, so the rotor blade will experience nose-up gyroscopic pitching moments of magnitude given by the expression

Mp(gym) = —2(p sin ft + q cos ft) (3.215)

Подпись: —2 P *2 —1 ’ Подпись: &61c Подпись: —2q I2-! Подпись: (3.216)

The induced cyclic pitch response can then be written as

where P and q are the helicopter roll and pitch rates, with the bar signifying normal­ization by Й. For low blade torsional or swash plate stiffness, the magnitude of the gyroscopic pitch effects can therefore be significant. More than a degree of induced cyclic can occur with a soft torsional rotor rolling rapidly (Ref. 3.42).

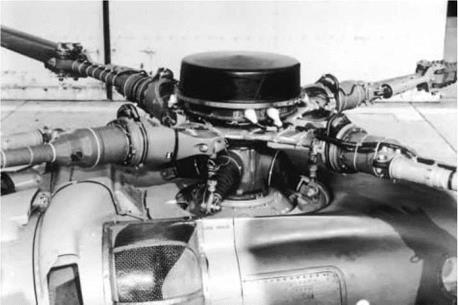
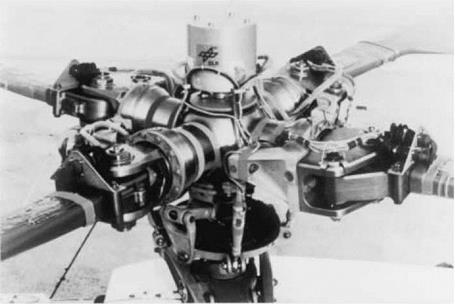
The second aspect concerns the location of the pitch bearing relative to the flap and lag hinges. If the pitch application takes place outboard of the flap and lag hinges, then there is no kinematic coupling from pitch into the other rotor DoFs. However, with an inboard pitch bearing, the application of pitch causes in-plane motion with a flapped blade and out-of-plane motion for a lagged blade. The additional motion also results in an increased effective pitch inertia and hence reduced torsional frequency. These effects are most significant with hingeless rotors that have large effective hinge offsets. On the Lynx, the sequence of rotations is essentially flap/lag followed by pitch, while the reverse is the case for the Bo105 helicopter (Figs 3.26(a) and (b)). The arrangement of the flap and lag real or virtual hinges is also important for coupling of these motions into pitch. Reference 3.7 describes the various structural mechanisms that contribute to these couplings, noting that the case of matched flap and lag stiffness close to the blade root minimizes the induced torsional moments (e. g., Westland Lynx).

As already noted, any discussion of blade torsion would be deficient without con­sideration of blade elastic effects and we shall return to these briefly later. However, the number of parameters governing the dynamics is large and includes the location of the elastic axis relative to the mass axis and aerodynamic centre, the stiffness distribution and any pre-cone and twist. Introducing this degree of complexity into the structural dynamics also calls for a consistent approach to the blade section aerodynamics, in­cluding chordwise pitching moments and unsteady aerodynamics. These are all topics for further discussion in Section 3.4.

Before we proceed with detailing the modelling of the other rotorcraft compo­nents, there is one final rotor-related aerodynamic effect to be considered – ground effect.