Category UNSTEADY INCOMPRESSIBLE POTENTIAL FLOW

POSSIBLE ADDITIONAL FEATURES OF PANEL CODES

MODELING OF PROPULSION EFFECTS. Many fluid-dynamic problems in­volve high-energy jets where the jet speed and stagnation pressure are
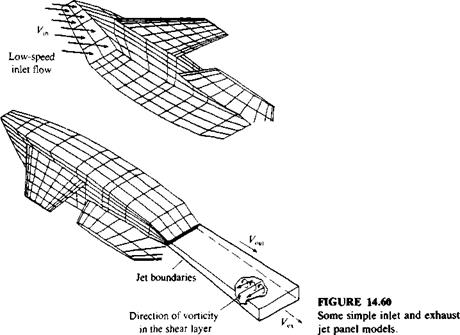
considerably higher than the corresponding free-stream values (as in the case of a jet airplane or a jet-assisted vertical take-off airplane). Even though the jet flow is compressible and its mixing process with the outer flow is highly viscous, there are several models for simulating the far-field effect of confined jets on the otherwise ‘ potential outer flow. One such model is described schematically in Fig. 14.60 and here the outer shear layer of the lifting jet is modeled by linearly varying (along the jet axis) doublet panels1211 (which are equal to a constant-strength vortex sheet). Lower-speed inlet or auxiliary exit flows can be simulated in many panel codes by simply allowing a transpiration velocity in the normal flow boundary condition, as shown for the inlet flow in Fig. 14.60. The method of including this transpiration velocity in the boundary condition is given by Eq. (14.4):

Подпись: (14.4)

image752

Э(Ф + Ф„)
дп

but here Vn is a prescribed average jet velocity. When the Dirichlet boundary condition is used then the source term of Eq. (9.12) (e. g., in the panel code VSAERO12 n) can be modified such that

a = n • Qo„ – F„ (14.21)

The inlet model of Fig. 14.60 is useful mainly to describe the principle of specifying the inlet inflow, but for good computational results the inlet must be

image753

FIGURE 14.61

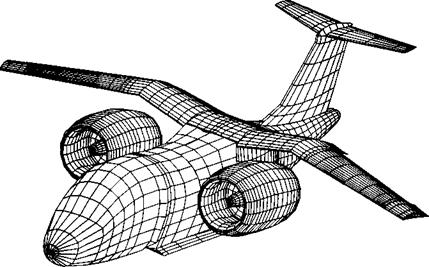
Detailed panel model of the tilt-nacelle airplane and its inlets, using 2546 panels per side. (Courtesy of S. Iguchi, M. Dudley and D. Ashby, NASA Ames Research Center).

modeled with more details, as shown in Fig. 14.61. In this case the nacelle inlet is modeled in detail by a large number of panels and the inflow is specified deep inside the nacelle, near an imaginary compressor inlet disc. When the jet is ejected at a large angle to the main flow direction, then the shape of the jet centerline (Fig. 14.62) is usually calculated with the use of some empirical formula that relies on the jet initial velocity and the velocity in the potential

image754

FIGURE 14.62

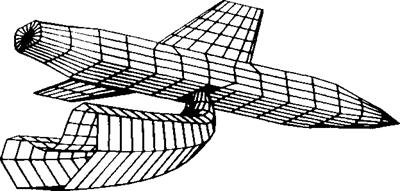
Panel model for the plume of the jet ejected normal to the flight direction. (Courtesy of George A. Howell, General Dynamics.)

field into which the jet flows. Consequently, an iterative process is used in some cases in which the jet boundary is treated as a wake (see wake rollup in Section 14.1).

Since a vortex ring model results in a large velocity near the jet outer boundary and a lower velocity at the center of the jet (which is incorrect and limits the use of such models to far-field effects only), more refined jet models have been tried. One approach is to model the wake boundary by using constant-strength doublets (similarly to a solid surface) and the jet entrainment that is obtained from empirical data is modeled by a surface source distribution

Inflow velocity

image755

FIGURE 14.63

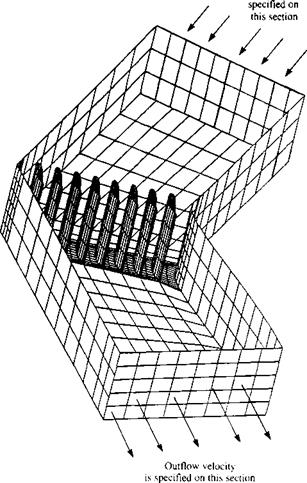
Panel model for the internal flow to study the aerodynamic of turning vanes inside a wind tunnel. (Courtesy of D. Ashby, NASA Ames Research Center).

on the jet boundaries (PMARC9 6). The jet centerline shape in this case, too, can be calculated again by using empirical formulas or by a time-stepping wake rollup routine (see Section 14.1).

INTERNAL FLOWS. In a situation when internal flows are modeled as in the case of channel flows, or when studying wind-tunnel/model combined flow – fields, then some methods allow the reversal of the direction of the normal n to the surface. For example, Fig. 14.63 depicts such a situation, where the turning vane geometry inside a wind tunnel is analyzed. For the basic problem, the free-stream velocity can be specified at the inflow plane as V„ = Q«, and some other velocity at the exit plane (usually reduced by the cross-section area ratio). When the Dirichlet boundary condition is applied to the region outside of the wind tunnel, the far-field boundary disappears and the influence coefficient matrix becomes singular such that the doublet solution is unique to within an arbitrary constant (also if the free-stream is set by prescribed sources at the inlet/exit planes then the other sources will be equal to zero—according to Eq. (9.12)). This difficulty may be overcome by specifying the doublet value on one of the panels (e. g., a value of zero on the wind-tunnel inlet plane). Also, an additional equation is added based on mass conservation of the inlet and exit flows. More details about this approach are provided in Ref. 9.7.

[1] –

FIGURE 4.14

Variation of two-dimensional lift curve slope with Mach number using Prandtl – Glauert formula.

[2] A quadrilateral is a flat surface with four straight sides. A rectilinear panel has straight but not necessarily flat sides and can be twisted!

[3] For convenience, therefore, in this chapter Ф is often referred to as a perturbation potential.

Modeling of Highly Swept Leading – Edge Separation

The modeling of leading-edge separation from highly swept wings is somewhat simpler than the modeling of the unswept leading-edge separation. The primary reason is that in this case the vorticity generated at the leading edge is immediately conveyed downstream by the chordwise flow and since there is no vorticity accumulation near the leading edge there is no time-dependent wake shedding (as in the unswept leading-edge case). Modeling is possible if the basic information about the location of the flow separation line and the strength of the separated shear layer is supplied to the potential-flow solution. Usually such information is generated by a local viscous solution, experiments, or even by using some parameters obtained from the potential-flow solution. For example, when modeling the flow over low aspect ratio delta wings with sharp leading edges, the location of the separation line is fixed along the sharp leading edge (recall that a sharper leading edge results in a stronger L. E. vortex and more vortex lift, Fig. 14.45). In regard to specifying the strength of the leading-edge shear layer (leading-edge wake), two of the more frequently used possibilities are:

1. Estimate vortex strength by using Eq. (14.15), which requires the calcula­tion of the velocity above and under the wake. In this case the effect of leading-edge radius can be included in the К coefficient such that К = 0.6 for a sharp leading edge and some smaller values of К may be used as the leading-edge radius increases.

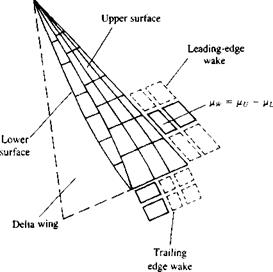
2. The second approach, which is simpler and seems to yield reasonable results in the range of a= 10-35°, is the treatment of the L. E. wake as a regular wake. The strength of the wake panel adjacent to the wake (Fig. 14.53) is then calculated by a “Kutta condition” as in Eq. (9.15):

Hw = t*u-I*L (14.20)

where ци and juL are the corresponding upper and lower surface doublet strengths along the separation line (see also Fig. 13.37).

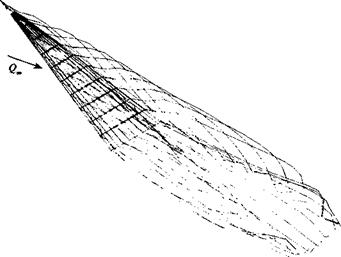
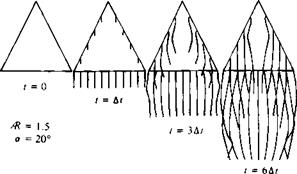
The shape of the separated wake can be calculated by the methods presented in Section 14.1 and in the following examples the calculations are based on the time-stepping method14 37,14 38,12 13 (which is based on the unsteady flow formulation of Chapter 13). The wake rollup is obtained by gradually releasing vortex wake panels from the sharp L. E., similarly to the wake-shedding process at the trailing edge, until the fully developed wake shape is obtained. This is shown schematically in Fig. 14.54 for several time steps and for simplicity only the longitudinal vortex lines are shown (but the wake is constructed by using vortex rings, as shown in Fig. 14.53). The vortex rollup is determined by the momentary velocity induced by the wing and its wakes (as described in Section 13.12, Eqs. (13.153) and (13.154)). Results for

FIGURE 14.53

image745Vortex ring (or constant-strength doublet) model for both trailing and leading edge wakes shed from slender delta wings.
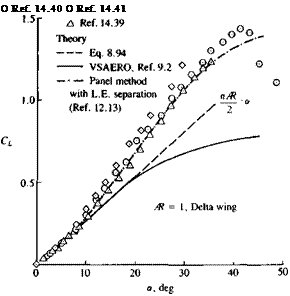
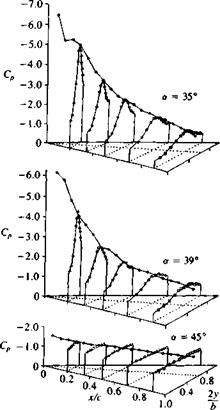
the lift curve of this delta wing (based on this model) are presented in Fig. 14.55. At the lower angles of attack (less than —10°), the lift curve slope is well predicted by the linear formulation of R. T. Jones (Eq. (8.94)) (CL = (л/2Ж«)). At higher incidences, however, the leading-edge vortices increase the lift, as indicated by a sample of experimental results (Refs. 14.39-14.41). This vortex lift is not predicted by the basic linear panel method (using only the trailing-edge wake) since the leading-edge wake and its vortex lift is not included. The addition of the separated L. E. vortex model (shown in Fig. 14.56) increases the wing’s lift and improves the comparison with the experimental data. At very high angles of attack (above 40°), however, vortex breakdown results in the wing’s lift loss, a condition that is not modeled here.

Modeling of Highly Swept Leading - Edge Separation

FIGURE 14.54

Sequence of vortex wake shedding and vortex rollup. From Ref. 14.37. Reprinted with permission. Copyright AIAA.


image746

Experiment


Подпись:FIGURE 14.55

Comparison between experimen­tal and calculated lift coefficient for a slender delta wing (using a panel method1213 with leading – edge vortex model).

image748

FIGURE 14.56

Simulation of leading-edge vortex rollup by releasing vortex ring panels from the leading and trailing edges.


image749

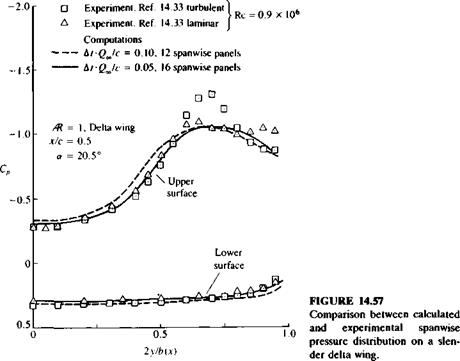
The spanwise pressure distribution at the x/c = 0.5 station is presented in Fig. 14.57. The wing model consists of 248 panels with 12 spanwise equally spaced panels, and the nondimensional time step is 0.1 chord (Qa„ At/с = 0.1). Results for a denser computation grid (328 panels, 16 spanwise panels, 6» A tic = 0.05) are shown by the solid line, and both computations show the suction peaks due to the leading-edge vortices. The experimental results with the turbulent boundary layer of Ref. 14.33 (Ле = 0.9х 106 for both experi­ments) indicate a secondary vortex near the leading edge that was not modeled here. In general, it was found that the lift of the delta wing was less sensitive to

image750

FIGURE 14.58

Vortex wake lines behind a slender delta wing moving forward in a coning motion.

image751 Подпись: FIGURE 14.59 Rolling moment versus coning rate for a slender delta wing in a coning motion.

a coarser grid and larger time steps than the pressure distribution over the wing’s surface. In cases when computer time saving is considered and larger time steps are applied, the spanwise pressure distribution will smear, but the lift will change by only a few percent.

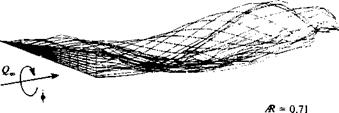
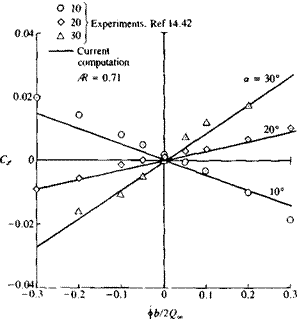
For a demonstration of more complex motions, the wake lines behind a delta wing with an aspect ratio of 0.71, undergoing a coning motion, are presented in Fig. 14.58. The wing angle of attack a was set relative to the x, y, z frame of reference (pitching along x/c = 0.6), and then the wing was rotated about the x axis at the rate <f>. Computed rolling moments are compared with the experimental data of Ref. 14.42 in Fig. 14.59. The slopes of the computed rolling moment curves, which change rapidly with variations of angle of attack, compare reasonably well with the experiments. For angles of attack higher than 30° and for roll rates <j>b/2Q<„ larger than 0.1, vortex breakdown bends the experimental curves and larger differences between the experiment and the computations are detected.

Flow Separation on Wings with Highly Swept Leading Edge—Experimental Observations

The high angle of attack separated flow pattern, based on numerous flow visualizations (see Refs. 14.29-14.32) over highly swept wings (e. g., a small-zR delta wing) in terms of the crossflow is depicted in Section BB of Fig. 14.27. If the leading-edge radius is small (sharp L. E) then such L. E. vortices will be present at angles of attack as low as 10°. Because of these vortices, the actual flowfield is entirely different from what would have been expected according to the attached-flow model of slender-wing theory (Section 8.2.2). Also, when the leading edge is sharp, the location of the separation line is fixed along the leading edge, and the flowfield appears not to be sensitive to changes in the Reynolds number.

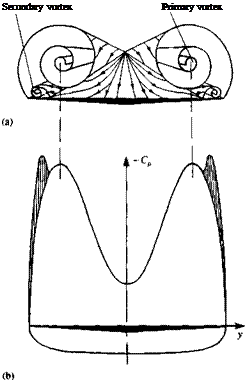
The effect of this vortical flow (leading-edge vortices) on the pressure distribution is shown in Fig. 14.41. The two large suction peaks on the upper surface of the wing are due to the high-speed flow induced by these vortices.

FIGURE 14.41

Подпись: Secondary vortex Primary vortex Schematic description of the pri­mary and secondary vortex pattern (in the crossflow plane) of the flow over a slender delta wing and the resulting pressure distribution. From Ref. 14.33 published by AGARD/NATO.
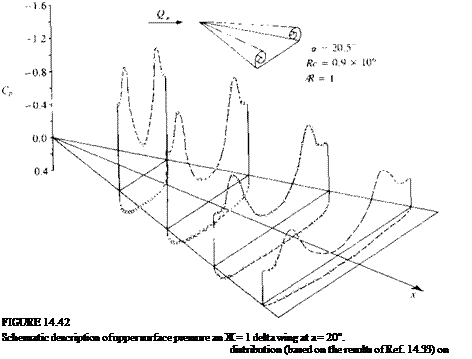
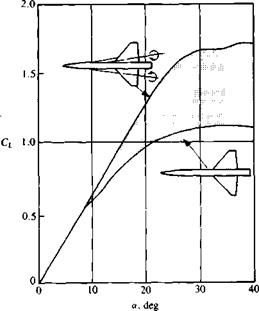
This high velocity creates a secondary shear flow near and on the wing’s upper surface and results in the presence of a secondary (and some times even a tertiary) vortex that is much smaller and weaker; its effect is shown in the figure. The above shape of the spanwise pressure distribution (see Ref. 14.33) is maintained along the chord (Fig. 14.42) but the suction force is the strongest near the wing apex. This spanwise pressure distribution is entirely different from the pressure difference data results of the linear theory in Fig. 8.21. Furthermore, the lift coefficient of the wing with leading-edge separation (up to a — 45°) is considerably larger than predicted by the linear theory (Eq. (8.94)). The difference between the linear value (of (л/2)Ака in the low angle of attack case) and the actual lift is often referred to as “vortex lift” (and shown in Fig. 14.43). So in this case of wings with highly swept leading edges, the lift is increased due to L. E. separation, unlike in the unswept wing case where the lift is reduced. This fact was realized by many aircraft designers and many modern airplanes have such highly swept lifting surfaces, called strokes (see Fig. 14.44). For example, if such a strake is added in front of a less swept back wing then the vortex originating from the strake will induce low pressures, similar to those in Fig. 14.42, on the upper surface of the main wing.

Flow Separation on Wings with Highly Swept Leading Edge—Experimental Observations

Flow Separation on Wings with Highly Swept Leading Edge—Experimental Observations

50


Flow Separation on Wings with Highly Swept Leading Edge—Experimental Observations

FIGURE 14.44

image735Effect of strakes on the lift of a slender wing/body configuration. From Skow, A. M., Titiriga, A. and Moore, W. A., “Forebody/Wing Vortex Interactions and their Influence on Departure and Spin Resistance”, published by AGARD/NATO in CP 247-High Angle of Attack Aerodynamics, 1978.
Therefore, the total gain in lift will surpass the lift of the strake alone, as shown in Fig. 14.44.

As mentioned earlier, in contrast to the unswept wing case, the lift of a slender wing is larger when the leading edge is sharper, as shown in Fig. 14.45 (here a — is used since there is a lift difference due to effective camber between wing A and wing B). In this case the lift of delta wing A is slightly larger than the lift of the inverted wing, and in both cases the lift is larger than in the case of a rounded leading edge. So in general, when the flow is turned more sharply (when viewed in the two-dimensional cross-section as in Fig.

14.27, section BB) the vortex will be stronger, resulting in more suction force. As the leading edge radius increases, the lift usually decreases and depends more on the Reynolds number. Also in this case of leading-edge separation, the “classical” suction force at the leading edge is lost and therefore the drag force will be larger than for the elliptic case of Section 8.2.2. Consequently, the resultant force due to the pressure difference on the lifting surface will act normal to the surface and therefore the induced drag can be estimated by

CD = CL tan a (14.19)

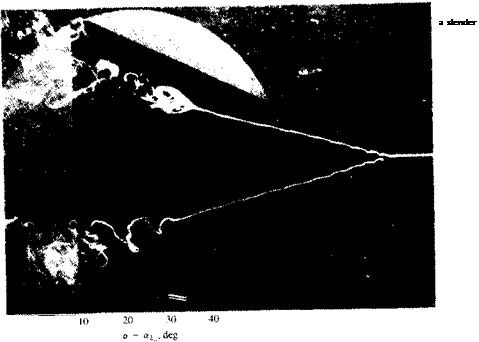
A more careful examination of Fig. 14.43 reveals that the highly swept wing stalls, too, at a fairly large angle of attack. This stall, though, is somewhat different from the unswept wing stall and is due to “vortex burst” (or breakdown). This condition is shown by the flow visualization of Fig. 14.46, and at a certain point its axial velocity in the vortex core is reduced and the

image736,image737
Flow visualization in water of leading-edge vortex burst. From Lambourne, N. C. and Bryer, U. W., ARC R & M 3282, 1962. Reproduced with the permission of the Controller of Her Majesty s

Stationary Office.

image739
image738

FIGURE 14.47

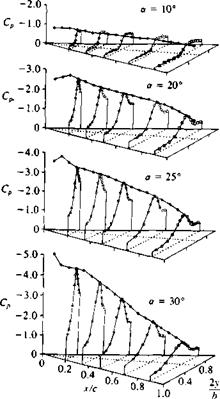
Upper-surface pressure distribution on a slender delta wing at various angles of attack and beyond stall. From Ref. 14.34. Reprinted with permission. Copyright AIAA.

vortex becomes unstable, its core bursts, and the induced suction on the wing disappears. The pressure distribution on the delta wing (from Ref. 14.34) for several angles of attack (shown in Fig. 14.47) shows this effect of vortex lift and vortex burst. So, as a result of the vortex burst the lift of the wing is reduced and a condition similar to stall is observed. Flow visualizations sometimes show the burst as a sudden spiral growth in the vortex core (see Fig. 14.46) and this is called “spiral burst”; in other instances it is seen as a bubble burst (hence it is called “bubble burst” or “bubble instability”). The onset of vortex burst was investigated by many investigators and the results for a delta wing can be summed up best by observing Fig. 14.48 from Polhamus.1435 (Incidently, Polhamus developed a method of estimating the vortex lift based on the leading-edge suction analogy and for more details the reader is referred to Ref. 14.35 or section 19.7 of Ref. 14.8.) The abscissa in Fig. 14.48 shows the wing aspect ratio, and the ordinate indicates the angle of attack range. The
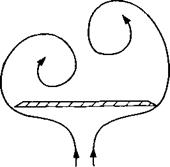
curve on the right-hand side indicates the boundary at which vortex burst will reach the wing’s trailing edge. The method of reading this figure can be demonstrated by taking the delta wing of Fig. 14.43 (Ж = 1) and, for example, gradually increasing its angle of attack. This gradual increase will cause the vortex burst, which is far behind the trailing edge, to move gradually forward. According to this figure, at about a = 35-40° the vortex burst will pass forward of the trailing edge and spoil the lift and initiate the wing stall. Also, for larger wing aspect ratios (less L. E. sweep) the burst will occur at lower angles of attack. As the wing becomes very slender the leading edge vortices become very strong and the burst is delayed. But for these wings another flow phenomenon, called “vortex asymmetry,” is observed. This situation occurs when the physical spanwise space is reduced, and consequently one vortex rises above the other (Fig. 14.49). Usually any random disturbance can cause this instability to develop and changes in the asymmetry from side to side are

image740

image741

FIGURE 14.49

Schematic description of the crossflow due to asymmetric leaaing edge vortices.

also possible. The onset of this condition is depicted by the left-hand curve in Fig. 14.48. For example, if the angle of attack on an Ж = 0.5 delta wing is gradually increased, then over a *20° the vortex asymmetry will develop. If the angle of attack is increased, say up to a = 40°, the lift will still grow and probably near a = 45° the vortex burst will advance beyond the trailing edge and wing stall will be initiated. In general the condition of an asymmetric vortex pattern is undesirable because of the large rolling moments caused by this asymmetry. Furthermore, the pattern of asymmetry is sensitive to disturbances and can arbitrarily flip from side to side. The presence of a vertical fin (e. g., a rudder) between the two vortices or a central body (as in missiles) can have a stabilizing effect and delay the appearance of this vortex asymmetry.

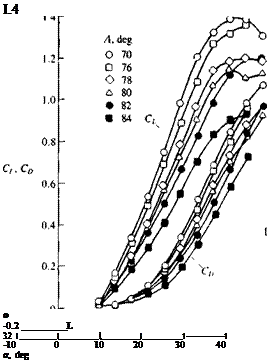
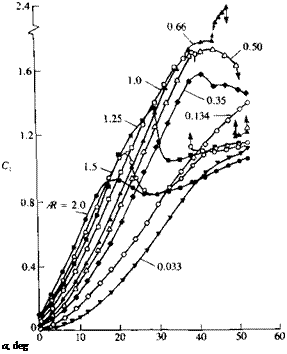
To conclude this discussion on experimental data of slender wings, a set of typical lift coefficient data is presented in Figs. 14.50 and 14.51. Note that in the data of Shanks14 36 leading-edge sweep angle rather than wing aspect ratio is presented (but for delta wings Ж = 4c tan Л where Л is the aft-sweep angle).

Подпись:Shanks, Ref. 14.36 NASA TND – 1822

FIGURE 14.50

Lift and drag coefficient versus angle of attack for several slender delta wings. (Adapted from Ref. 14.36; Re= 3.2 x 10⁵.)

FIGURE 14.51

Подпись: a, deg Normal force coefficient versus angle of attack for several slender flat rectangular wings. From Winter, H., "Flow Phenomena on Plates and Airfoils of Short Span,” NACA TM 798, 1937.
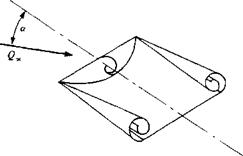
The lift of slender rectangular wings (Fig. 14.51) is enhanced too by the side-edge vortex lift, and the effect of the vortex lift on the wing is similar to the case of slender delta wings (mainly when wing Ж < 1, and the leading and side edges are sharp). In this case, though, the flowfield is somewhat more complex because of the presence of a leading-edge separation bubble that is noticeable for sharp leading edge wings (Fig. 14.52). This bubble is created by the time-dependent leading-edge vortex shedding (as in Fig. 14.27) but its effect is small compared to the vortex lift of the side-edge vortices (when Ж<1).

image744FIGURE 14.52

Schematic description of the leading- and side-edge vortex rollup on a slender rec­tangular thin wing.

Modeling of Unswept Leading-Edge Separation

If we follow the previous assumptions that for high Reynolds number flows the viscous effects are confined within thin shear layers, then the irrotational flow outside these regions can be modeled by inviscid flow methods. The primary objective of this approach is to explain the pressure distribution obtained in separated flow; in some cases also the skin friction can be estimated. It seems clear that the model must be time-dependent and a large number of such methods can be found in the literature. Two excellent survey papers by Leonard14 24 and Sarpkaya103 describe and classify a large portion of the available literature on this topic. Some steady-state, two-dimensional models for flow separation14 3 extend the method of viscous/inviscid interaction of Section 14.2 and model the bubble created by the separated flow with additional sources or simply assume that the pressure is constant there. However, since flow visualization clearly indicates that high Reynolds number flow separation involves time-dependent wake shedding, we shall elaborate a
bit more on this approach. Note that the following two-dimensional models are intended to simulate the flowfield at the symmetry plane of a three- dimensional separation cell (as shown in Fig. 14.31).

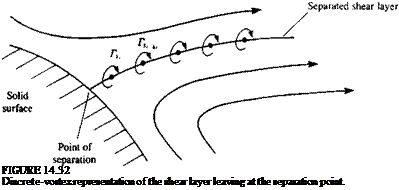
A typical two-dimensional time-dependent model for the separated flow over an airfoil can be constructed by taking any time-dependent potential flow solver (or any method of Chapter 11 with a time-dependent upgrade) and adding a separated shear layer model. Such a model is depicted schematically in Fig. 14.32, where the flow near a separation point is described. In order to solve the potential-flow problem, two additional unknowns characterizing the simplified effects of viscosity must be supplied to the potential flow solver and they are:

1. The location of the separation point or points. (Some information on the time dependent motion of this point, which may be very small, is valuable, too.)

2. The strength of the vortex sheet.

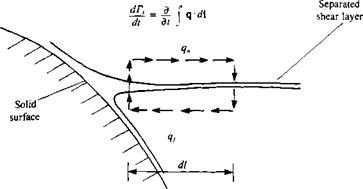
For example, let us use the unsteady thin-airfoil method of Section 13.10. It is assumed that the shape of the solid surface and location of the separation point, which is a function of the Reynolds number, are known (e. g., from experiments, flow visualizations, independent viscous calculations, etc.). The separated vortex sheet will be approximated by discrete vortices, as shown in Fig. 14.32 and their strength can be approximated by estimating dTJdt near the separation point (see Fig. 14.33), where the subscript s denotes “separated wake”. Using the definition of the circulation as in Eq. (2.36), the rate of circulation generation at the separation point is

Подпись: q • d

Подпись: FIGURE 14.32 Discrete-vortex representation of the shear layer leaving at the separation point.

l=d dt dt

image723

FIGURE 14.33

Nomenclature used to calculate the vorticity shed from a separation point.

The integration path can be approximated by the simple rectangle shown in Fig. 14.33, which is placed near the separation point such that its upper and lower segments are in the potential flow region. If the upper velocity qu outside the boundary layer, and the lower velocity q€ within the separated bubble are known, then the integration on an infinitesimal rectangle becomes

^f=sJt^udl~ 4* dV> “ (4* = = *(q“~q2^ < 14‘14)

Here the vertical segments of the rectangle approach zero and their effect on Г, is neglected. In practice, the upper velocity is taken as the potential velocity above the separation point and is known (at least from the previous time step), whereas the lower velocity is close to zero. In this case the strength of the latest separated vortex becomes

Ts=^{ql~q2e)b. t (14.15)

where К is a circulation reduction factor and values of 0.5-0.6 are usually used. This latest separated vortex is placed along the streamline that started at the separation point (say at a distance [(Чи + Яе)/2 At from the separation point).

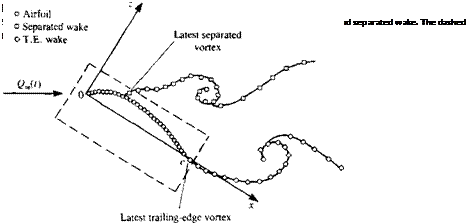
The momentary solution of the airfoil with the separated wake model is described schematically in Fig. 14.34. If the lifting airfoil is represented by N discrete bound vortices (circles in the figure) with unknown strength, then N equations representing the zero normal flow boundary condition can be specified on the N collocation points. The strength of the latest separated wake vortex TJ( is known from Eq. (14.15), whereas the strength of the latest vortex shed at the trailing edge TWt is calculated by using the Kelvin condition (Eq.

Подпись: dT dt Подпись:image724"

image725
Подпись: (13.51)):

(14.16)

So at each time step there are N + 1 unknown vortices Гь Г2,. . . , Г^, Г^, and N + 1 equations (N boundary conditions at the collocation point plus the Kelvin condition, Eq. (14.16)). The problem at each time step is solved exactly as described in Section 13.10, since the addition of the separated wake did not introduce any new additional unknown. Note that in this solution the Kutta condition is specified at the airfoil’s trailing edge (as a result of using the lumped-vortex element—see Section 13.10). The wake rollup at each time step can be performed in a manner similar to that described in Section 13.10 (see Eqs. (13.131) and (13.132)) and each vortex of the wake (both trailing edge and separated) will move with the local velocity (и, w), by the amount

(Ax, A. z)j = (u, w)j At (14.17)

Here the induced velocity (и, w), is the velocity induced by all the vortices (airfoil and wakes) in the field. Due to the singular nature of the vortices, instabilities can develop during the wake rollup routines and some methods10 3 use certain smoothing techniques to improve the wake rollup.

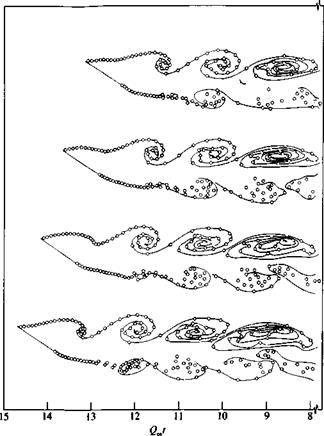
Results of such a calculation without using any wake rollup smoothing technique are presented in Fig. 14.35. The oscillation is obtained either by moving the separation point or changing the vortex strength. The front

image726

c

FIGURE 1435

Vortex wake rollup behind a separated flat plate. Front separation point was fixed at x/c = 0.05, a = 30°, and the time step is ixtQJc = 0.1. From Ref. 14.25. Reprinted with permission from Cambridge University Press.

separation point in this figure is fixed at a distance of 5% chord from the leading edge.14 25

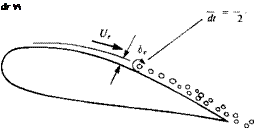
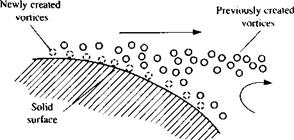
Another approach (e. g., see Ref. 14.24) is to solve the vorticity transport equation (Eq. (2.10)) by using discrete vortices. In this case the flow can be rotational and for thick bodies the Dirichlet boundary condition is applied to the Poisson equation for the stream function (V2V = £ = 0 inside a closed body). For example, the method of modeling the rotational boundary layer is described schematically in Fig. 14.36, where at a certain point in the boundary layer vortex elements are introduced. The strength and initial velocity of the newly introduced vortices can be estimated by assuming a certain effective boundary layer thickness de and outer velocity Ue (Ue is obtained from the

FIGURE 14.36

Подпись: dr V Model for forming discrete vortices in an attached boundary layer.
potential flow solution, whereas 6e can be estimated by using existing boundary layer data on flat plates). The initial velocity can then be approxi­mated as Uel2 and the vortex strength is calculated by using Eq. (14.14) with q€ = 0 on the surface:

Подпись:dt 2

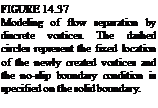
In some models one set of (bound) discrete vortices is placed around the solid surface in a fixed position and the strengths are calculated at each time step by applying the Dirichlet boundary condition on the surface (see Fig. 14.37). During the second time step these vortices are allowed to translate with the flow and a new set of “bound” vortices is created. Results of such a calculation14 26 are presented in Fig. 14.38. Note that in this method both the tangential and the normal velocity components on the body are zero since the flow is rotational. However, at each time step a large number of new vortices is being created, compared to only two per time step in the method of Ref.

14.25. Consequently, some vortex number reduction schemes (by combining several nearby vortices) and wake rollup reshaping methods can be found in the literature.10 3 14 24

Подпись: FIGURE 14.37 Modeling of flow separation by discrete vortices. The dashed circles represent the fixed loca-tion of the newly created vortices and the no-slip boundary condition is specified on the solid boundary.
image728

The extension of these two-dimensional models to three dimensions is somewhat more elaborate. For example, methods that are based on the stream function and solve two-dimensional rotational flows cannot be extended automatically to three dimensions (see Chapters 1 or 2). A possible simple

Modeling of Unswept Leading-Edge Separation

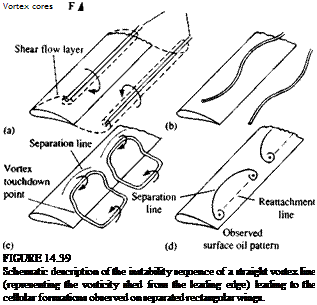
extension to the thin lifting surface of Section 13.12 was done in Ref. 14.27 mainly to explain the results of some flow visualizations obtained during high angle of attack testing of unswept wing general-aviation airplanes. An imaginary sequence leading to this model is described schematically in Fig. 14.39. The first frame (Fig. 14.39a) shows the time-averaged vortex core positions of the shear layers originating at the leading and trailing edges of a hypothetical two-dimensional flow. The figure shows only the most recent vortices, but the complete wake in the two-dimensional section will have a pattern similar to the Karman street shape of Fig. 14.27 (section AA). Also, if the wing geometry is purely two-dimensional (Ж = °°), then those vortex lines

Vort< "touch <j point

Подпись:Подпись:Подпись: .timage731"will be initially straight (hypothetically). However, a spanwise instability will develop14 28 similar to the instability of the trailing wake vortices (Fig. 14.4, and also Ref. 14.1), which will lead to the cellular patterns shown in Fig. 14.39c. Figure 14.39d shows the surface oil patterns appearing in Fig. 14.31, which can be explained by this simplistic model (note that the two edges of the mushroom shape correspond to the vortex ring “touch down” points).
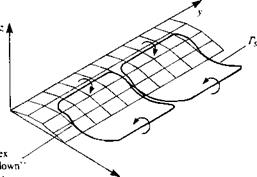
The addition of large-scale vortex rings14 27 to the panel model of a thin wing for simulating the large-scale effects of this separated flow are shown in Fig. 14.40. In this model the location and spanwise width of the separated flow cells must be specified (based ‘on flow visualizations). Once this information is supplied to the otherwise potential flow solver, the fluid dynamic loads on the lifting surface can be calculated and Ref. 14.27 showed that the lift variation as a result of the separation line location can be explained.

Flow Separation on Wings with Unswept Leading Edge—Experimental Observations

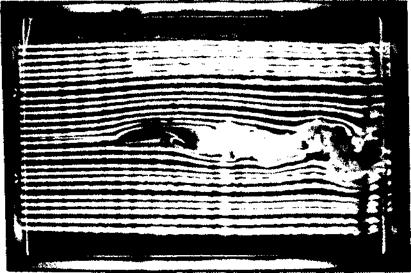
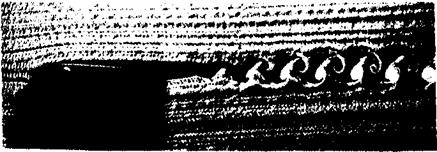
Flow visualization-based observations on two-dimensional airfoils indicate that when the angle of attack increases to the point where flow separation is initiated, a shear layer forms near the separation point. The vorticity in this layer seems to have a clockwise value, whereas the shear layer emanating from the trailing edge (wake) mostly has a counterclockwise vorticity (see schematic description in section AA of Fig. 14.27). These two layers roll up in opposite directions and eventually a periodic wake rollup pattern is observed (Fig. 14.28). This instability of the two shear layers originating from the upper and lower surface boundary layers is present even at zero angle of attack and results of flow visualizations14 21 with the hydrogen bubble technique are shown in Fig. 14.29. The first and most important observation is, then, that even for a stationary airfoil, when the flow separates, the problem becomes time – dependent. The frequency of this wake oscillation can be related to the wake spacing by the Strouhal number (Eq. (1.52)), which was observed to have values of approximately

1-0.2 (14.13)

oc

Here d is the spacing between the two shear layer separation points (shown in section AA in Fig. 14.27) and / is the shedding frequency. Time-dependent chordwise pressure measurements on a stalled airfoil are scarce, but a typical

image716

FIGURE 14.28

Smoke trace flow visualization of the separated flow over a two-element airfoil [Re = 0.3 x 10⁶).

time-averaged pressure distribution is shown in Fig. 14.30. The time-averaged effect of the flow separation is to reduce the lift (reduced circulation) and the pressure stays fairly constant in the region starting behind the separation point and ending at the trailing edge. Note the large difference between the attached, potential-flow calculations taken from Ref. 14.22 and the experimen­tal results of the separated flow.

image717

FIGURE 14.29

Hydrogen bubble flow visualization of the wake (created by the two shear layers of the boundary layer) behind NACA 0012 airfoil at ar = 0 and Rec = 21,000. (Courtesy of K. W. McAlister and L. W. Carr,14 21 U. S. Army Aeroflightdynamics Directorate, AVSCOM.)

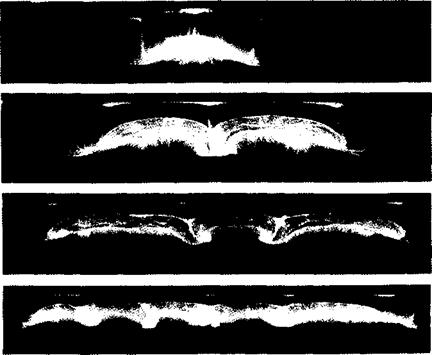
Surface oil flow visualizations14 23 with rectangular, finite aspect ratio wings (Fig. 14.31) indicate that in reality there is no “true two-dimensional flow separation.” Instead there are three-dimensional cells and at the central plane of each cell a flowfield similar to the ‘two-dimensional separation” of Fig. 14.27 AA and Fig. 14.28 can be observed. These cells seem to have some natural aspect ratio, which will adjust itself slightly to the actual wing planform shape. For example, for a rectangular wing with aspect ratio (Ж) of 3, one cell was visible; for Ж = 6 and 9 two and three cells were visible, respectively. When the wing span was further increased (to Ж = 12), five cells were observed and the size of some of the cells was somewhat smaller. In conclusion, therefore, the unswept leading edge problem appears to be always three-dimensional and time-dependent—and from the experimental point of view still not completely explored.

In the following section some of the modeling efforts for such flows, based on inviscid models, is presented. It is assumed that if the separated shear layer can be modeled then the rest of the flowfield is still close to being irrotational and therefore the pressures and loads can be estimated.

image721

FIGURE 14.31

Oil flow patterns developed on the upper surface of several stalled rectangular wings. For all wings angle of attack is a = 18.4°, Rec = 385,000, and the airfoil shape is a 14% Clark Y section. (Courtesy of A. Winkelman.14 23) Reprinted with permission. Copyright AIAA.

FLOW OVER WINGS AT HIGH ANGLES OF ATTACK

Many airplanes and other vehicles that use lifting surfaces face situations where a variable range of lift coefficient is required. For example, the lowest landing speed of a high-speed airplane is dictated by the highest (safe) lift coefficient. This is even more pronounced for supersonic aircraft, which must have swept leading edges (less than the Mach cone) and small wing area for supersonic cruise, but for landing at reasonably low speeds require very high lift coefficients. Therefore, it is very important to be able to generate high lift coefficients, even if wing stall is approached.

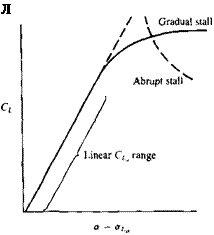
Since the primary function of wings is to generate lift, let us observe a typical lift curve of a wing, as shown in Fig. 14.26. At the lower angle of attack range (far from the stall angle) the lift slope versus angle of attack is well defined and predictable (linear CL<_ range in Fig. 14.26) and airplane lift can be controlled by changing a. However, when the angle of attack approaches the

Подпись: Л FIGURE 14.26

Lift curve and stall characteristics of two generic wings.

stall condition the wing lift will not react to a changes with the same intensity as in the so-called linear range. From an airplane point of view the stall should be gradual, as shown by the solid line, and not abrupt as indicated by the dashed line. Even more important is that the stall process will not generate strong rolling moments due to asymmetry (as a result of an earlier stall of either the left or the right wings) such that the airplane will be driven into a stall-spin.1418

A desirable wing stall pattern can be tailored by having larger section lift coefficients near the wing root. If this is done properly, stall will be initiated there and will gradually spread toward the wing tips, so that the overall stall will be similar to the solid line in Fig. 14.26. Additionally, local wing root flow separations at the beginning of the wing stall yield reasonably controllable rolling moments (assuming that roll control surfaces are located near the wing tips) and such an airplane can safely approach wing stall. This onset of root stall can be obtained by forward wing sweep (see spanwise loading of such wings in Fig. 12.17), by wing twist, etc. On the other hand, the effect of wing taper (see Fig. 12.19) or aft-sweep (Fig. 12.17) results in higher wing tip loading, which (if not corrected by twist, airfoil camber variation, etc.) can cause the high angle of attack flow separations to begin near the wing tips. This may cause a stall of the ailerons and loss of the aircraft lateral control.

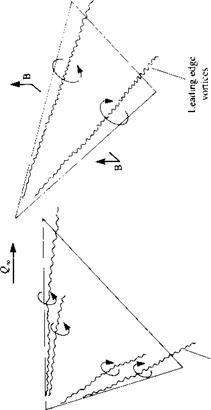
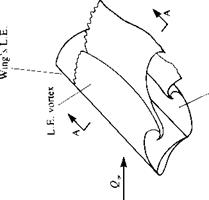
Leading edge sweep also has an important effect on the stalled flowfield over wings. This is illustrated schematically in Fig. 14.27, where typical separated flow patterns as observed by flow visualization are shown for unswept, moderately swept (up to 60°), and highly swept wings. (Note that the discussion in this section is focused mainly on airplane wings where the Reynolds number is considered to be high, e. g., Re > 106.) The unswept wing, shown in the left hand side of the figure, at large angles of attack behaves like a flat plate with two shear layers emanating from the leading and trailing edges. In the two-dimensional view of section AA, a time-dependent vortex shedding (sometimes called a “Karman vortex street”) is observed. In the case of the highly swept wings, shown in the right hand side of the figure, the cross-section flow field is shown schematically in section BB, and the flow separates at the two leading edges, resulting in two strong, concentrated vortices. These leading-edge vortices are located near the leading edge and the low pressure caused by the velocity induced by these vortices increases the wing’s lift. In the case of moderate leading-edge sweep, as shown in the center of Fig. 14.27, the leading-edge vortex becomes less visible, and sometimes even two such vortices per side may be observed.1419

At this point we must emphasize that the methods discussed in Chapters 2-13 are based on potential flow and they are applicable (with some viscous corrections, as in Section 14.2) to attached flows only. The drag force D in a real viscous flow, for example, will have a potential flow component Ц (which was zero in two dimensions) and a viscous flow part Д,:

image712

П


Подпись: FIGURE 14.27 J t. Ll , Schematic description of the flow patterns observed in the separated flow over unswept, moderately swept, and highly swept leading-edge wings.
Подпись: Unswept leading edge Moderately swept leading edge Highly swept leading edge

CQ

CQ

c

о


8

image714


image713image715

In attached flows most of the viscous drag is due to the skin friction; however, in the case of extensive separations the drag is due to “form drag” or “pressure drag,” which is much larger. (As an example, consider the case of a fully stalled airfoil where the attached lifting flow pattern is spoiled by a large separation bubble with a fairly constant negative pressure distribution.) For further information on the fluid dynamic drag of a particular configuration it is advised first to search through the considerable collection of experimental data provided in Fluid Dynamic Drag by Hoerner.1420

The analytical treatment of separated flow fields in order to determine the resulting pressure distribution is far more difficult and has not yet reached the level of confidence obtained for attached flows. Consequently, in the following four subsections, experimental evidence is provided on the problems of unswept and highly swept leading-edge separation along with some simple models for some special cases of flow separation. All of these simple models are in their early state of development and have not reached a level where they can be used as a predictive engineering tool (e. g., similar to some panel methods used within the attached flow domain). However, their importance lies in helping to understand and to explain some fairly complex flow phenomena.

High-Lift Considerations

Requirements such as short take-off and landing can be met by increasing the lift of the lifting surfaces. If this is done by increasing the wing’s lift coefficient then a smaller wing surface can be designed (meaning less cruise drag, less weight, etc.). Engineering solutions to this operational requirement within various lift coefficient ranges resulted in many ingenious approaches and a comprehensive survey is given by Smith.1413 A logical approach is to increase the lift coefficient of a lifting surface by delaying flow separation, but changing the wing area and shape in reaction to the changing flight conditions (e. g., airplane flaps) is also very common. In this section we shall briefly discuss some of the features of single and multielement high-lift airfoils.

image703

FIGURE 14.19

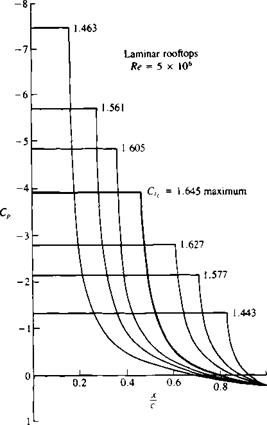
Family of possible airfoil upper-surface pressure distributions resulting in an attached flow on the upper surface (for Re = 5 x 10⁶). From Liebeck.14’11 Reprinted with permission. Copyright AIAA. (Courtesy of Douglas Aircraft Co.)

One approach is to develop a family of airfoil (upper surface) pressure distributions that will result in the most-delayed flow separation. In order to accomplish this the location of the separation point must be estimated, based on information from the potential flow and the boundary layer solutions. A simplified approach is to use a flow separation criterion such as the Stratford criterion (description of this criterion can be found in several aerodynamic books, e. g., Kuethe and Chow,14 8 sections 18.10 and 19.2). Using such a flow separation criterion, Liebeck14 10,14 11 developed the family of upper surface pressure distributions shown in Fig. 14.19. These curves depend on the Reynolds number, and in the case of Fig. 14.19, for a Reynolds number of

image704

FIGURE 14.20

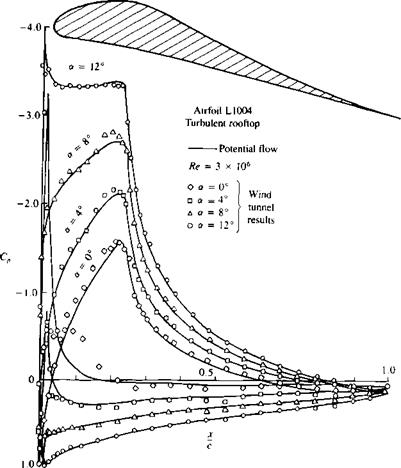
Shape of the L1004 airfoil and theoretical and experimental pressure distribution on it at various angles of attack. From Liebeck.14 10 Reprinted with permission. Copyright AIAA. (Courtesy of Douglas Aircraft Co.).

FIGURE 14.21

Подпись: a, deg

image706

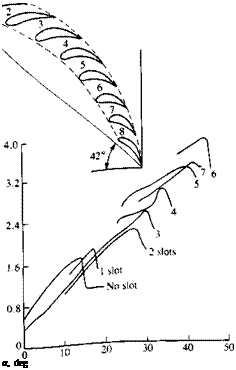
Lift coefficient versus angle of at­tack for the RAF 19 airfoil broken up to different numbers of ele­ments. (Note that a two-element airfoil has 1 slot, a three-element airfoil has 2 slots, etc.) From Ref. 14.13. Reprinted with permission. Copyright AIAA.

5 x 10⁶, airfoils having any of the described upper pressure distributions will have an attached flow on that surface. Note that the maximum lift coefficient will increase toward the center of the group and the bold curve represents the pressure distribution yielding the highest lift due to the upper surface pressure distribution.

At this point it is clear that if, based on the nature of the boundary layer, the shape of the desired pressure distribution can be sketched, then an inverse method is required to find the corresponding (or the closest) practical airfoil shape. Based on this need many inverse, or “design mode” airfoil design methods were developed (e. g., Refs. 14.7 and 14.9-14.11). The airfoil shape based on using one of these pressure distributions is shown in the inset to Fig. 14.20 along with the potential flow based solutions and experimental pressure distribution (maximum lift is C, = 1.8, at a = 14°, and at Re = 3 x 10⁶). Note that at the lower angles of attack (at possible cruise conditions) there is a favorable pressure gradient near the front of the airfoil where a laminar boundary layer can be maintained for low drag (transition is near the maximum thickness section; also, at cr = 0° a laminar separation bubble appears on the lower surface near the leading edge—causing the discrepancy between the measured and calculated data).

Another method of obtaining a high lift coefficient is to have a variable wing geometry, where both surface area and airfoil camber can be changed according to the required flight conditions. Mechanically, a multielement airfoil can be considered as such a device since by changing flap angles the lift coefficient can be altered without changing the wing angle of attack. But the multielement design will inherently possess high lift capabilities. This was realized early in the beginning of this century and Handley Page14 14 showed experimentally that the greater the number of the elements the greater is the

image708FIGURE 14.23

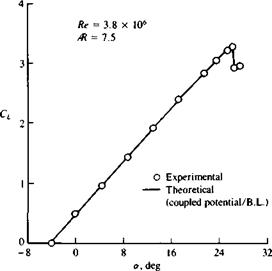
Lift coefficient versus angle of at­tack for a three-element wing shown in the inset to Fig. 14.22. Slat angle is —40°, trailing edge flap angle is 10°, and Re = 3.8 x 10⁶.

maximum lift coefficient. Figure 14.21 shows the results of Ref. 14.14 where the RAF 19 airfoil was broken up into different numbers of elements (note that a two-element airfoil will have one slot, a three-element airfoil two slots, etc.).

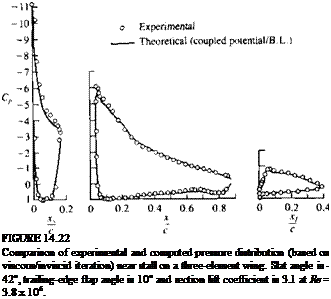
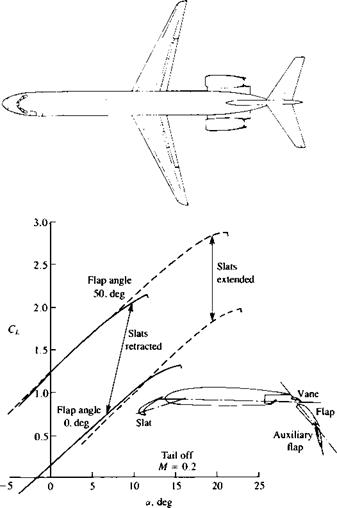
The pressure distribution and the lift versus angle of attack for a typical three-element wing section1415 are shown in Fig. 14.22; note that lift coefficients of over 3.0 can be obtained (Fig. 14.23). Since the overall effect of a flap is to increase the load on the element ahead of it, the leading edge slat

image709

FIGURE 14.24

Effect of leading-edge slats and trailing-edge flaps on the lift curve of a DC-9-30 airplane (tail off, M = 0.2). (Courtesy of Douglas Aircraft Co.).

(if not drooped) is the most likely to separate. Consequently, many airplanes will droop the leading edge slat at high lift coefficients to delay its flow separation. The effect of these devices is shown schematically in Fig. 14.24 and, in general, extending the slats will extend the range of angle of attack for maximum lift but will not increase the lift curve slope. Now, recall Example 3 of Section 5.4 about the flapped airfoil, which indicated that a flap at the trailing edge will have a large effect on the airfoil’s lift. This is clearly indicated in Fig. 14.24, where bringing the flap down by 50° results in an increase of the lift coefficient by close to 1.0.

The above discussion was mainly aimed at two-dimensional airfoil design, but as the wing aspect ratio becomes smaller the pressure distribution will be altered by the three-dimensional shape of the wing (see Fig. 12.31) and three-dimensional methods (either computational or experimental) must be used. Also, based on Figs. 14.21 and 14.22 it seems that with large aspect ratio wings, section lift coefficients of about 4 are possible and Smith14 13 estimates a hypothetical maximum section lift coefficient of Ал and shows a two-element airfoil with an estimated C, of about 5. For smaller aspect ratio wings a maximum lift coefficient of CLma = 1.2Ж is frequently quoted and this is probably a more conservative version of Hoerner’s14 16 CL<m = 1.94Ж formula. Hoerner also provides a limit on wing aspect ratio for this formula (p. 4-1) such that Ж < 6.

image710

FIGURE 14.25

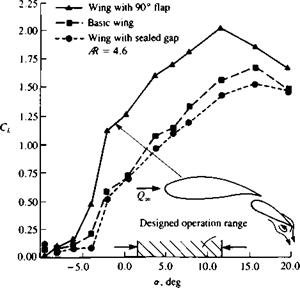
Effect of a small 90° flap on the lift of a two-element airfoil (Re = 0.3 x 10⁶). From Ref. 14.17. Reprinted with permission of ASME.

At this point it is worth mentioning a very simple trailing-edge flap that will usually increase the lift of a wing. This small trailing-edge flap is shown schematically in the inset to Fig. 14.25 and flow visualization indicates that due to the small vortex created at the pressure side the trailing edge upper surface boundary layer will be thinner. This in effect turns the trailing edge flow downward and increases the wing’s circulation. Experimental results14 11,14 17 usually show a consistent increase in lift due to this device, which in most cases is accompanied by a slight increase in drag. In some limited situations (as in Ref. 14.11 where it was attached to a high-drag Newman airfoil) a reduction in drag may be observed also. (A sketch of the Newman airfoil’s shape can be found in Ref. 14.11.)

Low-Drag Considerations

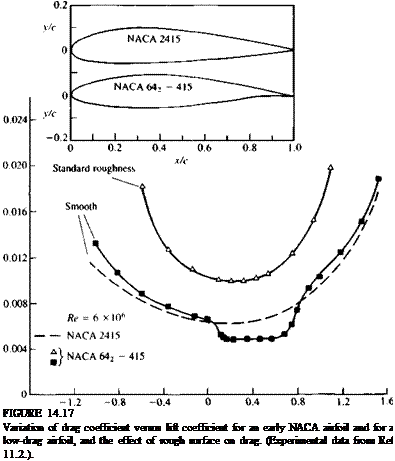
When low drag of the lifting surface is sought (e. g., for an airplane cruise configuration) then, as mentioned, large laminar boundary layer regions are desirable. In order to maintain a laminar boundary layer on an airfoil’s surface it must be as smooth as possible and also a favorable pressure gradient can delay the transition to a turbulent boundary layer (Ref. 14.8, pp. 363-364). A favorable (negative) pressure gradient occurs when the pressure is decreasing from the leading edge toward the trailing edge (thus adding momentum) and can be achieved by having a gradually increasing thickness distribution of the airfoil. This is demonstrated in the inset to Fig. 14.17, where an earlier NACA

C,

Подпись: FIGURE 14.17 Variation of drag coefficient versus lift coefficient for an early NACA airfoil and for a low-drag airfoil, and the effect of rough surface on drag. (Experimental data from Ref 11.2.).

2415 airfoil is compared with a NACA 642-415 low-drag airfoil. The inset to the figure clearly shows that the maximum thickness of the low-drag airfoil is moved to the 40% chord area, which is further downstream than the location of the maximum thickness for the NACA 2415 airfoil. The effect of this design on the drag performance is clearly indicated by the comparison between the drag-versus-lift plots of the two airfoils (at the same Reynolds number). In the case of the low-drag airfoil, a bucket-shaped low-drag area is shown that is a result of the large laminar flow regions. However, when the angle of attack is increased (resulting in larger C,) the boundary layer becomes turbulent and this advantage disappears. For comparison, the drag of a NACA 642-415 airfoil with a standard roughness112 is shown where the boundary layer is fully turbulent and hence its drag is considerably higher.

A large number of airfoil shapes together with their experimental

validation are provided in Ref. 11.2 (e. g., for the 6-series airfoils of Fig. 14.17 on pp. 119-123). Also, the airfoil shape numbering system is explained there in detail. For example, for the 642-415 airfoil the last two digits indicate the airfoil thickness (15%). The first digit (6) is the airfoil series designation and the second digit indicates the chordwise position of minimum low pressure in tenths of chord (or the intention to have about 40% laminar flow). As long as the boundary layer stays laminar in the front of the airfoil, its drag is low (see the bucket shape in Fig. 14.17) and the range of this bucket in terms of AC, is ±0.2 near the designed C, of 0.4 (hence the subscript 2, and the digit 4 after the dash).

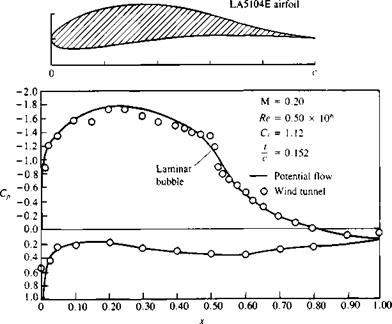
Most airplane-related airfoils operate with a Reynolds number larger then 106, but when the Reynolds number is below this number (as occurs in small-scale testing in wind tunnels, or low-speed gliders and airplanes, etc.) then it is possible to maintain large regions of laminar flow over the airfoil. This condition is more sensitive to stall and usually a larger laminar bubble exists. The effect of such a laminar bubble on the airfoil’s pressure distribution is shown in Fig. 14.18, where the plateau caused by the laminar bubble is clearly visible (see also Fig. 14.16). For further details about low Reynolds number airfoils the reader is referred to a review article on this topic by Lissaman.1412

image702

c

FIGURE 14.18

Signature of the laminar bubble on the pressure distribution of an airfoil. (Courtesy of Douglas Aircraft Co. and Robert Liebeck)

INFLUENCE OF VISCOUS FLOW EFFECTS ON AIRFOIL DESIGN

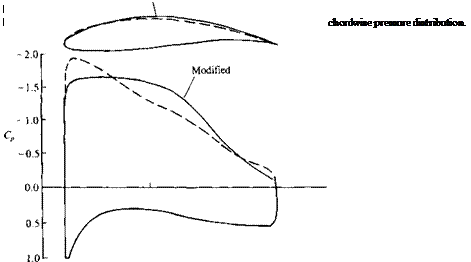
One of the earliest applications of panel methods (in their two-dimensional form), when combined with various boundary layer solution methods, was for airfoil shape design. Because of the simplicity of the equations, it was possible to develop inverse methods, where the programmer specifies a modified pressure distribution and then the computer program constructs the airfoil’s shape. Figure 14.14 depicts the sensitivity of the chordwise pressure distribu­tion to the airfoil’s upper surface shape and emphasizes the importance of such
inverse methods. For more details on these airfoil design methods, see, for example, Refs. 14.7, and 14.9-14.11; and here we will attempt only a brief discussion of some of the more dominant considerations.

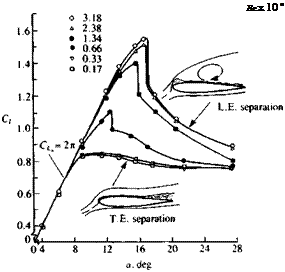
In order to estimate the effects of viscosity on airfoil design let us begin by observing the effect of Reynolds number on the performance of a two-dimensional airfoil. Figure 14.15 shows the lift coefficient versus angle of attack curve of a NACA 0012 airfoil and clearly the angle of attack at which

NACA 0012

Подпись: Re x 10 6

image699

FIGURE 14.15

Effect of Reynolds number on the lift coefficient of a symmetric NACA 0012 airfoil. From Erics­son, L. E. and Reding, J. P., “Further Considerations of Spilled Leading Edge Vortex Effects on Dynamic Stall”, Journal of Aircraft, Vol. 14, No. 6, 1977. Reprinted with permis­sion. Copyright AIAA. (Courtesy of L. E. Ericsson, Lockheed Mis­siles and Space Company, Inc.)
flow separation is initiated depends on the Reynolds number. Note that for the attached flow condition the lift slope is close to In, but at a certain angle (e. g., about a — 8° for Re = 0.17 x 10⁶) the lift does not increase with an increase in the angle of attack. This is caused by flow separation (see inset in the figure) and the airfoil (or wing) is “stalled.”

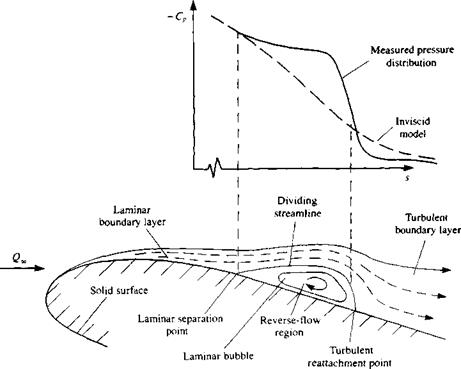
Let us, now, have a closer look at the boundary layer on the airfoil’s upper surface (that is, the suction side). If the free stream is laminar to begin with, then a laminar boundary layer will develop behind the front stagnation point (see Fig. 14.16). At a certain point the laminar flow will not be able to follow the airfoil’s upper surface curvature and a “laminar bubble” will form. If the Reynolds number is low (as in the lowest two curves in Fig. 14.15) then the laminar boundary layer will separate at this point. But if the Reynolds number increases, then the flow will reattach behind the “laminar bubble” and a transition to a turbulent boundary layer will take place. The effect of this “laminar bubble” on the upper surface pressure distribution is shown schematically in the upper inset to Fig. 14.16. Because of the modified

image700

FIGURE 14.16

Schematic description of the transition on an airfoil from laminar to turbulent boundary layer and the laminar bubble.

streamline shape the outer flow will have a higher velocity Ue, resulting in a plateau shape of the pressure distribution. Behind the bubble the velocity is reduced and the pressure increases, thus resulting in the sharp drop of the negative pressure coefficient.

Returning to Fig. 14.15 we can see that for increasing Reynolds numbers, as a result of the momentum transfer from the outer flow into the turbulent boundary layer, the airfoil separation is delayed up to increasingly higher angles of attack (upper curves in Fig. 14.15). This delay in the airfoil’s stall angle of attack (due to increased Reynolds number) results in higher lift coefficients and the maximum lift coefficient is called C, , whereas the flow separation now is a “turbulent separation.”

Another interesting observation is that for the low Reynolds number case, the flow starts to separate at the airfoil’s trailing edge, and gradually moves forward—this is called trailing-edge separation, and in this case abrupt changes in the airfoil’s lift are avoided. For the high Reynolds number cases the boundary layer becomes turbulent and the flow stays attached for larger angles of attack (e. g., cr=14° for Re = 3.18xl06 in Fig. 14.15). If gradual trailing-edge separation is needed at higher angles of attack (to avoid the abrupt lift loss) then this can be achieved also by having a more cambered airfoil section.

Some of the more noticeable considerations, from the airfoil designer’s point of view, become clear when observing the effects of the boundary layer with the aid of Figs. 14.11 and 14.15. The first observation is that the drag coefficient of the laminar boundary layer is smaller and for drag reduction purposes larger laminar regions must be maintained on the airfoil. However, when high lift coefficients are sought then an early tripping (causing of transition, for example by surface roughness, vortex generators, etc.) of the boundary layer can help to increase the maximum lift coefficient. Also, in many situations the same lifting surface must operate in a wide range of angles of attack and Reynolds number and the final design may be a result of a compromise between some opposing requirements. Consequently, to clarify some of the considerations influencing airfoil design, these two regimes of airfoil performance are discussed briefly in the following paragraphs.

14.2.1 The Boundary Layer Concept

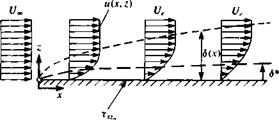
The concept of a boundary layer can be described by considering the flow past a two-dimensional flat plate submerged in a uniform stream, as shown in Fig.

14.5. Since the viscous-flow boundary conditions on the solid surface (Eqs.

FIGURE 14.5

image684Nomenclature used to describe the boundary layer on a flat plate at

zero incidence.

(1.28a and b)) require that the velocity be zero there, a thin layer exists where the velocity parallel to the plate reaches the outer velocity value Ue (Ue is the velocity outside of the boundary layer and in the case of the flat plate of Fig.

14.5 Ue = 14). This layer of rapid change in the tangential velocity is called the boundary layer and its thickness d increases with the distance x along the plate. The information about the velocity profiles inside the boundary layer can be obtained by solving the inner viscous flow problem (e. g., see Ref. 1.6) and from the outer potential-flow point of view the boundary condition of zero normal velocity can be moved from the plate to an imaginary distance 5* (see Fig. 14.5) that is called the displacement thickness. If the velocity distribution within the boundary layer is known (from a solution of the boundary layer equations) then <5 * can be calculated as

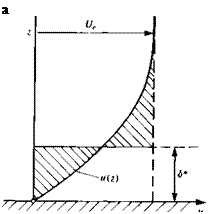
Подпись: <5*image685(14.3)

This displacement thickness is described schematically in Fig. 14.6 and it indicates the extent to which the surface would have to be displaced in order to be left with the same flow rate of the viscous flow, but with an inviscid velocity

Подпись: a FIGURE 14.6

Illustration of the displacement thickness d* in a boundary layer. (Note that the area enclosed by the two shaded triangular surfaces should be equal.)

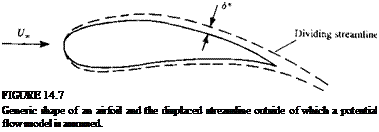
Подпись: FIGURE 14.7 Generic shape of an airfoil and the displaced streamline outside of which a potential flow model is assumed.

profile (of m(z) = Ue = const.). Consequently, the boundary of the surface for the potential-flow boundary conditions must be raised by 6*, as shown in Fig.

14.5. For a more complicated geometry, such as the airfoil shown in Fig. 14.7, the displaced streamline defines a modified geometry for the potential-flow solution that accounts for this displacement effect. A possible procedure for solving the coupled potential and boundary layer equations can be established as follows:

1. Solve the potential flow field over the body and obtain the surface pressure distribution.

2. Using this pressure distribution obtain the boundary layer solution of Eqs. (1.64) and (1.65).

3. Modify the surface boundary condition for the potential flow (e. g., specify it on the displacement surface between the viscous/inviscid regions, as in Fig. 14.7) and solve for the second iteration.

This iterative process can be repeated several times and there are some different approaches for modifying the potential-flow boundary conditions.

14.2.1 The Boundary Layer Concept Подпись: (14.4)

One approach (e. g., Refs 9.5 and 14.3) is to change the location of the dividing streamline (or the boundary) in order to account for the displacement thickness. The other approach (which was presented in Section 9.9) is not to change the geometry of the surface but to simulate the displacement by blowing normal to the surface (e. g. Refs. 12.11, or 14.4-14.7). This requires the modification of the boundary condition of Eq. (9.4) such that

d(Ue6*)

ds

Подпись: V = Подпись: (14.5)

and then the transpiration (or blowing) velocity V„ is found from the information provided by the boundary layer solution:

where s is the line along the surface and the minus sign is a result of n pointing

into the body. In the case of the Dirichlet boundary condition the source term of Eq. (9.12) (e. g., in the panel code VSAERO9 2,12 n) can be modified such that

Подпись: (14.6)W)

ds

This approach is based on the two-dimensional boundary layer model and when extended to three-dimensional flows, in practice, it is done along streamlines or along two-dimensional sections.

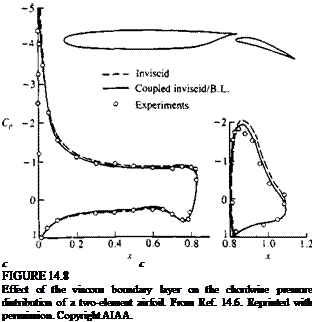
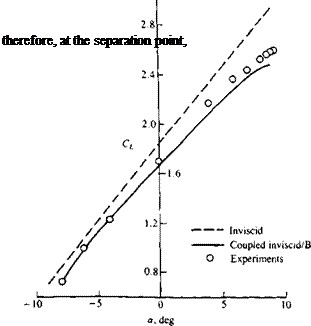
Based on such an iterative coupling between the inviscid and viscous solutions, the effect of the displacement thickness is presented in Fig. 14.8 for a two-element airfoil (shown in the inset). For the attached-flow case, the presence of the thin boundary layer reduces slightly the pressure difference (and hence the lift) obtained by the inviscid solution. This effect increases with the airfoil’s angle of attack (see lift coefficient data in Fig. 14.9) as the upper boundary layer becomes thicker, and eventually flow separation is initiated near the trailing edge (for a approximately larger than 5°, in Fig. 14.9).

Подпись: c c FIGURE 14.8 Effect of the viscous boundary layer on the chordwise pressure distribution of a two-element airfoil. From Ref. 14.6. Reprinted with permission. Copyright AIAA.

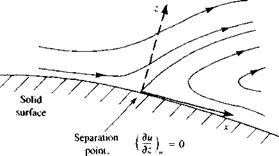
When the flow separates the streamlines do not follow the surface of the body, as shown schematically in Fig. 14.10. This is the result of an adverse (positive) pressure gradient (which may be caused by high surface curvature), which slows down the fluid inside the boundary layer to a point where the normal velocity gradient at the wall becomes zero. For laminar flows,

image689(14.7)

and behind this point reversed flow exists.

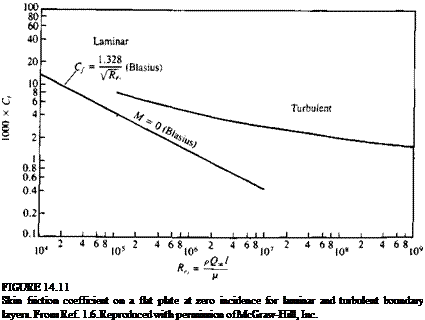
Additional information from the boundary layer solution includes the estimation of the skin friction on the solid boundary. Since the viscosity reduces the tangential velocity component to zero on the surface, as shown schematically in Fig. 14.5, there is a shear force xxz acting on the solid surface. Now, recall Eq. (1.12) for the shear force xXZw near the wall (assuming constant

image690

Подпись: FIGURE 14.9 Effect of the viscous boundary layer on the lift coefficient of the two-element airfoil of Fig. 14.8. From Ref. 14.6. Reprinted with permission. Copyright AIAA.
image691

FIGURE 14.10

Flow in the boundary layer near the point of separation.

image692 Подпись: (14.8)

viscosity and laminar flow)

Подпись: Cf =image693(14.9)

So, in principle, if the boundary layer equations are solved, the local friction on the surface can be readily obtained from the velocity gradient near the wall. Also, the skin friction coefficient strongly depends on the Reynolds number, and typical results for the flow over a flat plate are presented in Fig. 14.11. Of course our discussion has been limited so far to steady laminar flow and the skin friction coefficient for this laminar case is given by the line on the left side of Fig. 14.11. However, due to disturbances in the free stream or those generated in the viscous shear layers near the surface (e. g., due to surface roughness), the flow may become “turbulent” and the velocity will have time-dependent fluctuations. For example, in the case of a turbulent boundary layer over the two-dimensional flat plate of Fig. 14.5, the velocity m(z) at a given x location becomes time-dependent and will have the form

Подпись: (14.10a)

Подпись: FIGURE 14.11 Skin friction coefficient on a flat plate at zero incidence for laminar and turbulent boundary layers. From Ref. 1.6. Reproduced with permission of McGraw-Hill, Inc.

u(z, t) = u(z) + u’(z, t)

Similarly, the normal velocity component is

Подпись: (14.106)w(z, t) = w(z) + w'(z, t)

where m(z) and w(z) are the mean velocity components, and u'(z, t), w'(z, t) are the time dependent fluctuating parts. So, in principle, in an undisturbed flow, initially the boundary layer is laminar, as shown in Fig. 14.12, but as the distance x and the Reynolds number increase, the flow becomes turbulent. The region where this change takes place is called the region of transition.

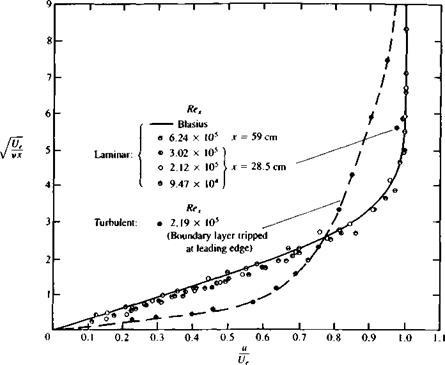
Figure 14.12 schematically indicates that due to the fluctuating velocity component (larger momentum transfer) the turbulent boundary layer is thicker. The typical boundary layer velocity profiles of Fig. 14.13 for turbulent and laminar flow reinforce this, too. Furthermore, when examining the turbulent boundary layer equations, the shear force becomes (Schlichting,1 6 p. 562)

image695

image696

(14.11)

and the second term is the Reynolds stress and represents additional stress due to axial momentum transfer in the vertical direction. A closer observation of the two velocity profiles of Fig. 14.13 shows that the velocity gradient for the turbulent case (duldz) appears to be larger near the wall. Now we can examine Fig. 14.11 again and it is clear that the skin friction coefficient for the turbulent boundary layer is considerably larger than for the laminar boundary layer at the same Reynolds number. So before proceeding to the next section, we can conclude that:

1. Displacement thickness is larger for turbulent than for laminar boundary layers.

2. The skin friction coefficient becomes smaller with increased Reynolds number (mainly for laminar flow, see Fig. 14.11).

3. At a certain Reynolds number range (transition) both laminar and turbulent boundary layers are possible. The nature of the actual boundary

image697

FIGURE 14.13

Velocity profiles on a flat plate at zero incidence for laminar and turbulent boundary layers. From Dhawan, S., “Direct Measurements of Skin Friction”, NACA Report 1121, 1953.

layer for a particular case depends on flow disturbances, surface roughness, etc.

4. The skin friction coefficient is considerably larger for the turbulent boundary layer.

5. Because of the vertical momentum transfer in the case of the turbulent boundary layer, flow separations will be delayed somewhat, compared to the laminar boundary layer (see Ref. 14.8, p. 415).