Category Fundamentals of Aerodynamics

Flow Over A Sphere

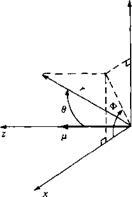
Consider again the flow induced by the three-dimensional doublet illustrated in Figure 6.3. Superimpose on this flow a uniform velocity field of magnitude in the negative

г direction. Since we are more comfortable visualizing a freestream which moves horizontally, say, from left to right, let us flip the coordinate system in Figure 6.3 on its side. The picture shown in Figure 6.4 results.

Examining Figure 6.4, the spherical coordinates of the freestream are

Vr = —Voo cos в [6.11a]

Vg = Voo sin в [6. lib]

Уф = 0 [6.11«]

Flow Over A Sphere

Adding Vr, Vg, and УФ for the free stream, Equations (6.11 a to c), to the representative components for the doublet given in Equation (6.10), we obtain, for the combined flow,

To find the stagnation points in the flow, set Vr — Vg = 0 in Equations (6.12) and

(6.13) . From Equation (6.13), Vg = 0 gives sin в = 0; hence, the stagnation points

Flow Over A Sphere

image474

Figure 6.4 The superposition of a uniform flow and a three-dimensional doublet.


are located at в = 0 and n. From Equation (6.12), with Vr = 0, we obtain

“•,51

where r = R is the radial coordinate of the stagnation points. Solving Equation

(6.15)

Подпись: R = Подпись: 2 nV* Подпись: 1/3 Подпись: [6.16]

for R, we obtain

Flow Over A Sphere Подпись: and Подпись: 2 JTV* Flow Over A Sphere

Hence, there are two stagnation points, both on the z axis, with (r, 6) coordinates

Подпись: V' = ‘(V““2^)COSe = = —(Voo - Voo)cos6 = 0 Подпись: JL 2n Подпись: 27rVoo ft Подпись: cos в
image475

Insert the value of r = R from Equation (6.16) into the expression for V, given by Equation (6.12). We obtain

Thus, Vr = 0 when r = R for all values of в and Ф. This is precisely the flow – tangency condition for flow over a sphere of radius R. Hence, the velocity field given by Equations (6.12) to (6.14) is the incompressible flow over a sphere of radius R. This flow is shown in Figure 6.5; it is qualitatively similar to the flow over the cylinder shown in Figure 3.19, but quantitatively the two flows are different.

Flow Over A Sphere Подпись: [6.17]

On the surface of the sphere, where r = R, the tangential velocity is obtained from Equation (6.13) as follows:

From Equation (6.16),

Подпись: [6.18]fi = 27Г Я3

Flow Over A Sphere

image476

Figure 6.5 Schematic of the incompressible flow over a sphere.


Substituting Equation (6.18) into (6.17), we have

image477

Vg = Voo Sin в


Подпись: or[6.19]

The maximum velocity occurs at the top and bottom points of the sphere, and its magnitude is | V~^. Compare these results with the two-dimensional circular cylinder case given by Equation (3.100). For the two-dimensional flow, the maximum velocity is IVoq. Hence, for the same V^, the maximum surface velocity on a sphere is less than that for a cylinder. The flow over a sphere is somewhat “relieved” in comparison with the flow over a cylinder. The flow over a sphere has an extra dimension in which to move out of the way of the solid body; the flow can move sideways as well as up and down. In contrast, the flow over a cylinder is more constrained; it can only move up and down. Hence, the maximum velocity on a sphere is less than that on a cylinder. This is an example of the three-dimensional relieving effect, which is a general phenomenon for all types of three-dimensional flows.

Подпись: Cp = 1 — I sin2 в

The pressure distribution on the surface of the sphere is given by Equations (3.38) and (6.19) as follows:

Подпись:[6.20]

Compare Equation (6.20) with the analogous result for a circular cylinder given by Equation (3.101). Note that the absolute magnitude of the pressure coefficient on a sphere is less than that for a cylinder—again, an example of the three-dimensional relieving effect. The pressure distributions over a sphere and a cylinder are compared in Figure 6.6, which dramatically illustrates the three-dimensional relieving effect.

Applied Aerodynamics: The Aerodynamic Coefficients—Their Magnitudes and Variations

With the present section, we begin a series of special sections in this book under the general heading of “applied aerodynamics.” The main thrust of this book is to present the fundamentals of aerodynamics, as is reflected in the book’s title. How­ever, applications of these fundamentals are liberally sprinkled throughout the book, in the text material, in the worked examples, and in the homework problems. The term applied aerodynamics normally implies the application of aerodynamics to the practical evaluation of the aerodynamic characteristics of real configurations such as airplanes, missiles, and space vehicles moving through an atmosphere (the earth’s, or that of another planet). Therefore, to enhance the reader’s appreciation of such applications, sections on applied aerodynamics will appear near the end of many of the chapters. To be specific, in this section, we address the matter of the aerody­namic coefficients defined in Section 1.5; in particular, we focus on lift, drag, and moment coefficients. These nondimensional coefficients are the primary language of applications in external aerodynamics (the distinction between external and internal aerodynamics was made in Section 1.2). It is important for you to obtain a feeling for
typical values of the aerodynamic coefficients. (For example, do you expect a drag coefficient to be as low as 10 5, or maybe as high as 1000—does this make sense?) The purpose of this section is to begin to provide you with such a feeling, at least for some common aerodynamic body shapes. As you progress through the remainder of this book, make every effort to note the typical magnitudes of the aerodynamic coefficients that are discussed in various sections. Having a realistic feel for these magnitudes is part of your technical maturity.

Question: What are some typical drag coefficients for various aerodynamic con­figurations? Some basic values are shown in Figure 1.39. The dimensional analysis described in Section 1.7 proved that Co — /(M, Re). In Figure 1.39, the drag – coefficient values are for low speeds, essentially incompressible flow; therefore, the Mach number does not come into the picture. (For all practical purposes, for an incompressible flow, the Mach number is theoretically zero, not because the velocity goes to zero, but rather because the speed of sound is infinitely large. This will be made clear in Section 8.3.) Thus, for a low-speed flow, the aerodynamic coefficients

Flat plate

(Broadside) length = d Cq = 2.0


Cylinder diameter – d CD = 1.2


Streamline

body

thickness – d CD = 0.12


Cylinder j

diameter = —d Q> = 1.2

10


Cylinder

diameter = d CD = 0.6


Figure 1.39 Drag coefficients for various aerodynamic shapes. (Source:

Talay, T. A., Introduction to the Aerodynamics of Flight, NASA SP-367, 1975.)


image70

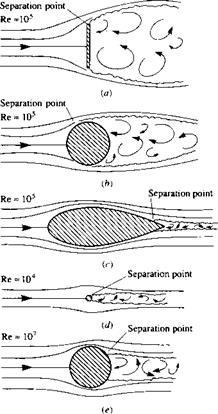
for a fixed shape at a fixed orientation to the flow are functions of just the Reynolds number. In Figure 1.39, the Reynolds numbers are listed at the left and the drag – coefficient values at the right. In Figure 1.39a, a flat plate is oriented perpendicular to the flow; this configuration produces the largest possible drag coefficient of any con­ventional configuration, namely, Co = D’/q^S = 2.0, where. S’ is the frontal area per unit span, i. e., S = (d)(1), where d is the height of the plate. The Reynolds number is based on the height d i. e., Re = рж V^d//i^ = 105. Figure 1.39b illustrates flow over a circular cylinder of diameter d; here, Co = 1.2, considerably smaller than the vertical plate value in Figure 1.39a. The drag coefficient can be reduced dramatically by streamlining the body, as shown in Figure 1.39c. Flere, Co = 0.12; this is an order of magnitude smaller than the circular cylinder in Figure 1.39£>. The Reynolds numbers for Figure 1.39a, b, and c are all the same value, based on d (diameter). The drag coefficients are all defined the same, based on a reference area per unit span of (d)(1). Note that the flow fields over the configurations in Figure 1.39a, b, and c show a wake downstream of the body; the wake is caused by the flow separating from the body surface, with a low-energy, recirculating flow inside the wake. The phenomenon of flow separation will be discussed in detail in Part 4 of this book, dealing with viscous flows. Flowever, it is clear that the wakes diminish in size as we progressively go from Figure 1.39a, b, and c. The fact that CD also diminishes progressively from Figure 1.39a, b, and c is no accident—it is a direct result of the regions of separated flow becoming progressively smaller. Why is this so? Simply consider this as one of the many interesting questions in aerodynamics—a question that will be answered in due time in this book. Note, in particular that the physical effect of the streamlining in Figure 1.39c results in a very small wake, hence a small value for the drag coefficient.

Consider Figure 1.39d, where once again a circular cylinder is shown, but of much smaller diameter. Since the diameter here is 0. Id, the Reynolds number is now 104 (based on the same freestream Too, px, and /i^ as Figure 1.39a, b, and c). It will be shown in Chapter 3 that Co for a circular cylinder is relatively independent of Re between Re = 104 and 105. Since the body shape is the same between Figure 1.39c/ and b, namely, a circular cylinder, then Co is the same value of 1.2 as shown in the figure. Flowever, since the drag is given by D’ = qxSCo, and S is one-tenth smaller in Figure 1.39 d, then the drag force on the small cylinder in Figure 139 d is one-tenth smaller than that in Figure 1.39b.

Another comparison is illustrated in Figure 1.39c and d. Here we are comparing a large streamlined body of thickness d with a small circular cylinder of diameter

O. ld. For the large streamlined body in Figure 1.39c,

D’ = qooSCo = 0.12 q^d

For the small circular cylinder in Figure 1.39d,

D’ = qooSCD — qoo(0.d)(.2) — O. Hq^d

The drag values are the same! Thus, Figure 1.3c and d illustrate that the drag on a circular cylinder is the same as that on the streamlined body which is ten times thicker—another way of stating the aerodynamic value of streamlining.

As a final note in regard to Figure 1.39, the flow over a circular cylinder is again shown in Figure 1.39c. However, now the Reynolds number has been increased to 107, and the cylinder drag coefficient has decreased to 0.6—a dramatic factor of two less than in Figure 139b and d. Why has Co decreased so precipitously at the higher Reynolds number? The answer must somehow be connected with the smaller wake behind the cylinder in Figure 1.39e compared to Figure 1.39b. What is going on here? This is one of the fascinating questions we will answer as we progress through our discussions of aerodynamics in this book—an answer that will begin with Section 3.18 and culminate in Part 4 dealing with viscous flow.

At this stage, pause for a moment and note the values of Co for the aerodynamic shapes in Figure 1.39. With Co based on the frontal projected area (S = <i(l) per unit span), the values of Cd range from a maximum of 2 to numbers as low as 0.12. These are typical values of Co for aerodynamic bodies.

Applied Aerodynamics: The Aerodynamic Coefficients—Their Magnitudes and Variations

Also, note the values of Reynolds number given in Figure 1.39. Consider a circular cylinder of diameter 1 m in a flow at standard sea level conditions = 1.23 kg/m3 and р. ж = 1.789 x 10⁻⁵ kg/m • s) with a velocity of 45 m/s (close to 100 mi/h). For this case,

Note that the Reynolds number is over 3 million; values of Re in the millions are typical of practical applications in aerodynamics. Therefore, the large numbers given for Re in Figure 1.39 are appropriate.

Applied Aerodynamics: The Aerodynamic Coefficients—Their Magnitudes and Variations Подпись: [1.59]

Let us examine more closely the nature of the drag exerted on the various bodies in Figure 1.39. Since these bodies are at zero angle of attack, the drag is equal to the axial force. Hence, from Equation (1.8) the drag per unit span can be written as

рТЕ a ТЕ

I rM cos 9dsu– I ti cos 0 ds/

JLE JLE

skin friction drag

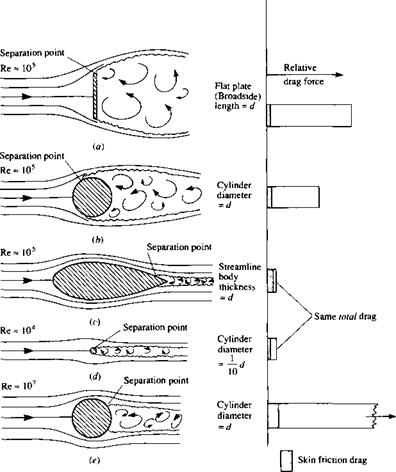
That is, the drag on any aerodynamic body is composed of pressure drag and skin friction drag; this is totally consistent with our discussion in Section 1.5, where it is emphasized that the only two basic sources of aerodynamic force on a body are the pressure and shear stress distributions exerted on the body surface. The division of total drag onto its components of pressure and skin friction drag is frequently useful in analyzing aerodynamic phenomena. For example, Figure 1.40 illustrates the comparison of skin friction drag and pressure drag for the cases shown in Figure 1.39. In Figure 1.40, the bar charts at the right of the figure give the relative drag force on each body; the cross-hatched region denotes the amount of skin friction drag, and the blank region is the amount of pressure drag. The freestream density and viscosity are the same for Figure 1.40a to e; however, the freestream velocity Vx is varied by

Applied Aerodynamics: The Aerodynamic Coefficients—Their Magnitudes and Variations

Larger


Pressure drag


Figure 1.40 The relative comparison between skin friction drag and pressure drag for various aerodynamic shapes. (Source: Talay, T. A., Introduction to the Aerodynamics of Flight, NASA SP-367, 1975.)


image71

the necessary amount to achieve the Reynolds numbers shown. That is, comparing Figure 1.40b and e, the value of is much larger for Figure 1.40c. Since the drag force is given by

D’ = PoovlscD

then the drag for Figure 1,40c is much larger than for Figure 1.40b. Also shown in the bar chart is the equal drag between the streamlined body of thickness d and

the circular cylinder of diameter 0. Id—a comparison discussed earlier in conjunction with Figure 1.39. Of most importance in Figure 1.40, however, is the relative amounts of skin friction and pressure drag for each body. Note that the drag of the vertical flat plate and the circular cylinders is dominated by pressure drag, whereas, in contrast, most of the drag of the streamlined body is due to skin friction. Indeed, this type of comparison leads to the definition of two generic body shapes in aerodynamics, as follows:

Blunt body = a body where most of the drag is pressure drag Streamlined body = a body where most of the drag is skin friction drag

In Figures 1.39 and 1.40, the vertical flat plate and the circular cylinder are clearly blunt bodies.

The large pressure drag of blunt bodies is due to the massive regions of flow sep­aration which can be seen in Figures 1.39 and 1.40. The reason why flow separation causes drag will become clear as we progress through our subsequent discussions. Hence, the pressure drag shown in Figure 1.40 is more precisely denoted as “pres­sure drag due to flow separation”; this drag is frequently called form drag. (For an elementary discussion of form drag and its physical nature, see Reference 2.)

Let us now examine the drag on a flat plate at zero angle of attack, as sketched in Figure 1.41. Here, the drag is completely due to shear stress; there is no pressure force in the drag direction. The skin friction drag coefficient is defined as

D’ D’

Cf =——— =————-

4oo$ 9ooC(l)

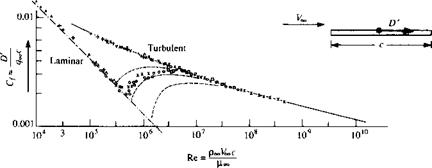
where the reference area is the planform area per unit span, i. e., the surface area as seen by looking down on the plate from above. C/ will be discussed further in Chapter 16. However, the purpose of Figure 1.41 is to demonstrate that:

image72

Figure 1.41 Variation of laminar and turbulent skin friction coefficient for a flat plate as a function of Reynolds number based on the chord length of the plate. The intermediate dashed curves are associated with various transition paths from laminar flow to turbulent flow.

1. Cf is a strong function of Re, where Re is based on the chord length of the plate, Re = PooVooc/^oo – Note that C/ decreases as Re increases.

2. The value of Cf depends on whether the flow over the plate surface is laminar or turbulent, with the turbulent C/ being higher than the laminar Cf at the same Re. What is going on here? What is laminar flow? What is turbulent flow? Why does it affect Cfl The answers to these questions will be addressed in Chapters 15, 17, and 18.

3. The magnitudes of Cf range typically from 0.001 to 0.01 over a large range of Re. These numbers are considerably smaller than the drag coefficients listed in Figure 1.39. This is mainly due to the different reference areas used. In Figure 1.39, the reference area is a cross-sectional area normal to the flow; in Figure 1.41, the reference area is the planform area.

A flat plate is not a very practical aerodynamic body—it simply has no volume. Let us now consider a body with thickness, namely, an airfoil section. An NACA 63-210 airfoil section is one such example. The variation of the drag coefficient, cj, with angie of attack is shown in Figure і.42. Here, as usual, cj is defined as

D’

Cd – ———-

*?ooC

where D’ is the drag per unit span. Note that the lowest value of cd is about 0.0045. The NACA 63-210 airfoil is classified as a “iaminar-flow airfoil” because it is designed to promote such a flow at small a. This is the reason for the “bucketlike” appearance of the Cd curve at low a; at higher a, transition to turbulent flow occurs over the airfoil

0.02 – 0.016 –

image73cd 0.012 – 0.008 – 0.004 –

-1.2 -0.8 -0.4 0 0.4 0.8 1.2

ci

______ I______ I I I I

-8 -4 0 4 8

a, degrees

Figure 1.42 Variation of section drag coefficient for an NACA 63-210 airfoil. Re = 3 x 10⁶.

surface, causing a sharp increase in cd. Hence, the value of cd = 0.0045 occurs in a laminar flow. Note that the Reynolds number is 3 million. Once again, a reminder is given that the various aspects of laminar and turbulent flows will be discussed in Part

4. The main point here is to demonstrate that typical airfoil drag-coefficient values are on the order of 0.004 to 0.006. As in the case of the streamlined body in Figures 1.39 and 1.40, most of this drag is due to skin friction. However, at higher values of a, flow separation over the top surface of the airfoil begins to appear and pressure drag due to flow separation (form drag) begins to increase. This is why cd increases with increasing a in Figure 1.42.

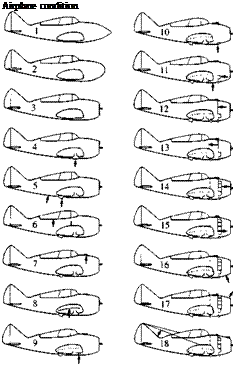
Let us now consider a complete airplane. In Chapter 3, Figure 3.2 is a photograph of the Seversky P-35, a typical fighter aircraft of the late 1930s. Figure 1.43 is a detailed drag breakdown for this type of aircraft. Configuration 1 in Figure 1.43 is the stripped-down, aerodynamically cleanest version of this aircraft; its drag coefficient (measured at an angle of attack corresponding to a lift coefficient of CL = 0.15) is

Condition

CD

ACo

ACd,

number

Description

(Cl= 0.15)

%a

1

Completely faired condition, long nose fairing

0.0166

2

Completely faired condition, blunt nose fairing

0.0169

3

Original cowling added, no airflow through cowling

0.0186

0.0020

12.0

4

Landing-gear seals and fairing removed

0.0188

0.0002

1.2

5

Oil cooler installed

0.0205

0.0017

10.2

6

Canopy fairing removed

0.0203

-0.0002

-1.2

7

Carburetor air scoop added

0.0209

0.0006

3.6

8

Sanded walkway added

0.0216

0.0007

4.2

9

Ejector chute added

0.0219

0.0003

1.8

10

Exhaust stacks added

0.0225

0.0006

3.6

11

Intercooler added

0.0236

0.0011

6.6

12

Cowling exit opened

0.0247

0.0011

6.6

13

Accessory exit opened

0.0252

0.0005

3.0

14

Cowling fairing and seals removed

0.0261

0.0009

5.4

15

Cockpit ventilator opened

0.0262

0.0001

0.6

i6

Cowling venturi installed

0.0264

0.0002

1.2

17

Blast tubes added

0.0267

0.0003

1.8

18

Antenna installed

0.0275

0.0008

4.8

Total

0.0109

“Percentages based on completely faired condition with long nose fairing.

Подпись: Airplane condition

Figure 1.43 The breakdown of various sources of drag on a late 1930s airplane, the Seversky XP-41 (derived from the Seversky P-35 shown in Figure 3.2). [Source: Experimental data from Coe, Paul J., "Review of Drag Cleanup Tests in Langley Full-Scale Tunnel (From 1935 to 1 945) Applicable to Current General Aviation Airplanes," NASA TN-D-8206, 1976.]

CD — 0.0166. Here, CD is defined as

QooS

where D is the airplane drag and S is the planform area of the wing. For configurations 2 through 18, various changes are progressively made in order to bring the aircraft to its conventional, operational configuration. The incremental drag increases due to each one of these additions are tabulated in Figure 1.43. Note that the drag coefficient is increased by more than 65 percent by these additions; the value of CD for the aircraft in full operational condition is 0.0275. This is a typical airplane drag-coefficient value. The data shown in Figure 1.43 were obtained in the full-scale wind tunnel at the NACA Langley Memorial Laboratory just prior to World War II. (The full-scale wind tunnel has test-section dimensions of 30 by 60 ft, which can accommodate a whole airplane—hence the name “full-scale.”)

The values of drag coefficients discussed so far in this section have applied to low-speed flows. In some cases, their variation with the Reynolds number has been illustrated. Recall from the discussion of dimensional analysis in Section 1.7 that drag coefficient also varies with the Mach number. Question: What is the effect of increasing the Mach number on the drag coefficient of an airplane? Consider the answer to this question for a Northrop T-38A jet trainer, shown in Figure 1.44. The drag coefficient for this airplane is given in Figure 1.45 as a function of the Mach number ranging from low subsonic to supersonic. The aircraft is at a small negative angle of attack such that the lift is zero, hence the CD in Figure 1.45 is called the zero – lift drag coefficient. Note that the value of Сд is relatively constant from M — 0.1 to about 0.86. Why? At Mach numbers of about 0.86, the Сд rapidly increases. This large increase in Сд near Mach one is typical of all flight vehicles. Why? Stay tuned; the answers to these questions will become clear in Part 3 dealing with compressible flow. Also, note in Figure 1.45 that at low subsonic speeds, Сд is about 0.015. This is considerably lower than the 1930s-type airplane illustrated in Figure 1.43; of course, the T-38 is a more modem, sleek, streamlined airplane, and its drag coefficient should be smaller.

We now turn our attention to lift coefficient and examine some typical values. As a complement to the drag data shown in Figure 1.42 for an NACA 63-210 airfoil, the variation of lift coefficient versus angle of attack for the same airfoil is shown in Figure 1.46. Here, we see c; increasing linearly with a until a maximum value is obtained near a = 14°, beyond which there is a precipitous drop in lift. Why does ci vary with a in such a fashion—in particular, what causes the sudden drop in ci beyond a = 14°? An answer to this question will evolve over the ensuing chapters. For our purpose in the present section, observe the values of q; they vary from about —1.0 to a maximum of 1.5, covering a range of a from —12 to 14°. Conclusion: For an airfoil, the magnitude of с/ is about a factor of 100 larger than q. A particularly important figure of merit in aerodynamics is the ratio of lift to drag, the so-called L/D ratio; many aspects of the flight performance of a vehicle are directly related to the L/D ratio (see, e. g., Reference 2). Other things being equal, a higher L/D means better flight performance. For an airfoil—a configuration whose primary

image75

Figure 1.44 Three-view of the Northrop T-38 jet trainer. (Courtesy of the U. S. Air Force.]

function is to produce lift with as little drag as possible—values of L/D are large. For example, from Figures 1.42 and 1.46, at a = 4°, q = 0.6 and q = 0.0046, yielding L/D = q0646 = 130. This value is much larger than those for a complete airplane, as we will soon see.

To illustrate the lift coefficient for a complete airplane, Figure 1.47 shows the variation of Cl with a for the T-38 in Figure 1.44. Three curves are shown, each for a different flap deflection angle. (Flaps are sections of the wing at the trailing edge which, when deflected downward, increase the lift of the wing. See Section 5.17 of Reference 2 for a discussion of the aerodynamic properties of flaps.) Note that at a given a, the deflection of the flaps increases CL. The values of Cl shown in Figure 1.47 are about the same as that for an airfoil—on the order of 1. On the other hand, the maximum L/D ratio of the T-38 is about 10—considerably smaller than that for an airfoil alone. Of course, an airplane has a fuselage, engine nacelles, etc., which are elements with other functions than just producing lift, and indeed produce only small amounts of lift while at the same time adding a lot of drag to the vehicle. Thus, the L/D ratio for an airplane is expected to be much less than that for an airfoil alone.

image76

Figure 1.45 Zero-lift drag coefficient variation with Mach number for the T-38. (Courtesy of the U. S. Air Force.)

image77

Figure 1.46 Variation of section lift coefficient for an NACA 63-210 airfoil.

Re = 3 x 10⁶. No flap deflection.

image78

Figure 1.47 Variation of lift coefficient with angle of attack for the T-38. Three curves are shown corresponding to three different flap deflections. Freestream Mach number is 0.4. (Courtesy of the U. S. Air Force.)

Moreover, the wing on an airplane experiences a much higher pressure drag than an airfoil due to the adverse aerodynamic effects of the wing tips (a topic for Chapter 5). This additional pressure drag is called induced drag, and for short, stubby wings, such as on the T-38, the induced drag can be large. (We must wait until Chapter 5 to find out about the nature of induced drag.) As a result, the L/D ratio of the T-38 is fairly small as most airplanes go. For example, the maximum L/D ratio for the Boeing B-52 strategic bomber is 21.5 (see Reference 48). However, this value is still considerably smaller than that for an airfoil alone.

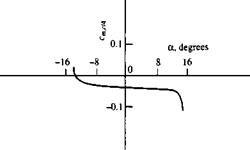
Finally, we turn our attention to the values of moment coefficients. Figure 1.48 illustrates the variation of cm<e/4 for the NACA 63-210 airfoil. Note that this is a neg­ative quantity; all conventional airfoils produce negative, or “pitch-down,” moments. (Recall the sign convention for moments given in Section 1.5.) Also, notice that its value is on the order of —0.035. This value is typical of a moment coefficient—on the order of hundredths.

Variation of section moment coefficient about the quarter chord for an NACA 63-210 airfoil. Re = 3 x 10⁶.


Figure 1.48


image79

With this, we end our discussion of typical values of the aerodynamic coefficients defined in Section 1.5. At this stage, you should reread this section, now from the overall perspective provided by a first reading, and make certain to fix in your mind the typical values discussed—it will provide a useful “calibration” for our subsequent discussions.

Numerical Solutions—Computational Fluid Dynamics (CFD)

The other general approach to the solution of the governing equations is numerical. The advent of the modem high-speed digital computer in the last third of the twentieth century has revolutionized the solution of aerodynamic problems and has given rise to a whole new discipline—computational fluid dynamics. Recall that the basic governing equations of continuity, momentum, and energy derived in this chapter are either in integral or partial differential form. In Anderson, Computational Fluid Dynamics: The Basics With Applications, McGraw-Hill, 1995, computational fluid dynamics is defined as “the art of replacing the integrals or the partial derivatives (as the case may be) in these equations with discretized algebraic forms, which in turn are solved to obtain numbers for the flow field values at discrete points in time and/or space.” The end product of computational fluid dynamics (frequently identified by the acronym CFD) is indeed a collection of numbers, in contrast to a closed-form analytical solution. However, in the long run, the objective of most engineering analyses, closed form or otherwise, is a quantitative description of the problem, i. e., numbers.

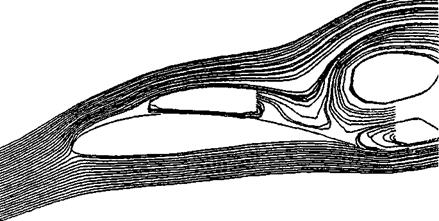
The beauty of CFD is that it can deal with the full non-linear equations of con­tinuity, momentum, and energy, in principle, without resorting to any geometrical or physical approximations. Because of this, many complex aerodynamic flow fields have been solved by means of CFD which had never been solved before. An example of this is shown in Figure 2.40. Here we see the unsteady, viscous, turbulent, com­pressible, separated flow field over an airfoil at high angle of attack (14° in the case

image183

Figure 3.40 Calculated streamline pattern for separated flow over an airfoil. Re = 300,000, = 0.5, angle of attack =14°.

shown), as obtained from Reference 56. The freestream Mach number is 0.5, and the Reynolds number based on the airfoil chord length (distance from the front to the back edges) is 300,000. An instantaneous streamline pattern that exists at a certain instant in time is shown, reflecting the complex nature of the separated, recirculating flow above the airfoil. This flow is obtained by means of a CFD solution of the two-dimensional, unsteady continuity, momentum, and energy equations, including the full effects of viscosity and thermal conduction, as developed in Sections 2.4, 2.5, and 2.7, without any further geometrical or physical simplifications. The equations with all the viscosity and thermal conduction terms explicitly shown are developed in Chapter 15; in this form, they are frequently labeled as the Navier-Stokes equations. There is no analytical solution for the flow shown in Figure 2.40; the solution can only be obtained by means of CFD.

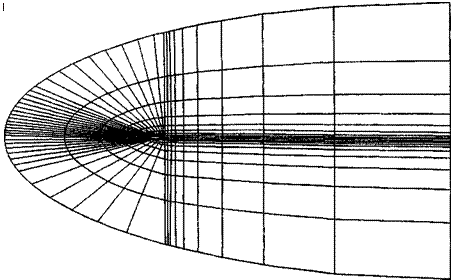
Let us explore the basic philosophy behind CFD. Again, keep in mind that CFD solutions are completely numerical solutions, and a high-speed digital computer must be used to carry them out. In a CFD solution, the flow field is divided into a number of discrete points. Coordinate lines through these points generate a grid, and the discrete points are called grid points. The grid used to solve the flow field shown in Figure 2.40 is given in Figure 2.41; here, the grid is wrapped around the airfoil, which is seen as the small white speck in the center-left of the figure, and the grid extends a very large distance out from the airfoil. This large extension of the grid into the main stream of the flow is necessary for a subsonic flow, because disturbances in a subsonic flow physically feed out large distances away from the body. We will learn why in subsequent chapters. The black region near the airfoil is simply the computer graphics way of showing a very large number of closely spaced grid points near the airfoil, for better definition of the viscous flow near the airfoil. The flow held properties, such as p, p, u, v, etc. are calculated just at the discrete grid points, and nowhere

image184

else, by means of the numerical solution of the governing flow equations. This is an inherent property that distinguishes CFD solutions from closed-form analytical solutions. Analytical solutions, by their very nature, yield closed-form equations that describe the flow as a function of continuous time and/or space. So we can pick any one of the infinite number of points located in this continuous space, feed the coordinates into the closed-form equations, and obtain the flow variables at that point. Not so with CFD, where the flow-field variables are calculated only at discrete grid points. For a CFD solution, the partial derivatives or the integrals, as the case may be, in the governing flow equations are discretized, using the flow-field variables at grid points only.

How is this discretization carried out? There are many answers to this equation. We will look at just a few examples, to convey the ideas.

Let us consider a partial derivative, such as du/dx. How do we discretize this partial derivative? First, we choose a uniform rectangular array of grid points as shown in Figure 2.42. The points are identified by the index і in the x direction, and the index j in the у direction. Point P in Figure 2.42 is identified as point (i, j). The value of the variable и at point j is denoted by и, j. The value of и at the point immediately to the right of P is denoted by u,41,; and that immediately to the left of P by Ui-ij. The values of и at the points immediately above and below point P are denoted by Uij+i and respectively. And so forth. The grid points in the x

direction are separated by the increment Ax, and the у direction by the increment Ay. The increments Ax and Ay must be uniform between the grid points, but Ax can be

Подпись: v

Figure 2.42 An array of grid points in a uniform, rectangular grid.

Numerical Solutions—Computational Fluid Dynamics (CFD) Подпись: З 3M ЗІ3 Numerical Solutions—Computational Fluid Dynamics (CFD) Подпись: [2.166]

a different value than Ay. To obtain a discretized expression for 3u/dx evaluated at point P, we first write a Taylors series expansion for m,_ L ; expanded about point P as:

Numerical Solutions—Computational Fluid Dynamics (CFD) Подпись: [2.167]

Solving Equation (2.166) (Эм/Эх),-.,-, we have

Equation (2.167) is still a mathematically exact relationship. However, if we choose to represent (Эм/Эх); j just by the algebraic term on the right-hand side, namely,

image185M j _|_ ] j LI j j

—– 1——- — Forward difference [2.1 68]

Ax

then Equation (2.168) represents an approximation for the partial derivative, where the error introduced by this approximation is the truncation error, identified in Equation

(2.167) . Nevertheless, Equation (2.168) gives us an algebraic expression for the partial derivative; the partial derivative has been discretized because it is formed by the values m/+i j and n,. / at discrete grid points. The algebraic difference quotient in Equation (2.168) is called a forward difference, because it uses information ahead of joint (/, j), namely ui+[ j. Also, the forward difference given by Equation (2.168) has first-order accuracy because the leading term of the truncation error in Equation

(2.167) has Ax to the first power.

Equation (2.168) is not the only discretized form for (du/dx)ij. For example, let us write a Taylors series expansion for Uj-j expanded about point P as

I (du , л л I (д2ц (-~Ax’>2 , (93“ (~A*)3

Подпись: dX3Подпись:= Щ.1 + (j-x) (-^) + (ailj – y-

Подпись: Solving Equation (2.169) for (du/dx)ij, we have 2"x Ax (3 3u
Подпись: 3 и  dx)i,j Подпись: *i,j ui-,j Ax Подпись: 3 2u dx2); .-T Numerical Solutions—Computational Fluid Dynamics (CFD) Подпись: [2.170]

[2.169]

Подпись: Truncation errorRearward difference

Hence, we can represent the partial derivative by the rearward difference shown in Equation (2.170), namely,

(

Эи и; ; — и,_і і _ _

— ) = — ———— — Rearward difference [2.171]

Э xJij Ax

Equation (2.171) is an approximation for the partial derivative, where the error is given by the truncation error labeled in Equation (2.170). The rearward difference given by Equation (2.171) has first-order accuracy because the leading term in the truncation error in Equation (2.170) has Ax to the first power. The forward and rearward differences given by Equations (2.168) and (2.171), respectively, are equally valid representations of (du/dx)jj, each with first-order accuracy.

Подпись: R/+i,y Подпись: и i—j — 2 Подпись: Ax -- Подпись: Э3и (Ax)3 ^x3/ ij 3 Подпись: [2.1 72]
image186

In most CFD solutions, first-order accuracy is not good enough; we need a discretization of (du/dx)jj that has at least second-order accuracy. This can be obtained by subtracting Equation (2.169) from Equation (2.166), yielding

Solving Equation (2.172) for (du/dx)ij, we have

Подпись: / Э3и (Ax)2 9*3/;j 3 + ' V Truncation error Подпись:/Эи Ui—j

3x / ■ . 2 Ax

4 7 C] ————- — —— ■

Central difference

Подпись: 3M  Uf +  j Ui—lj dx ) t j 2 Ax Подпись: Central difference Подпись: [2.174]

Hence, we can represent the partial derivative by the central difference shown in Equation (2.173), namely

Examining Equation (2.173), we see that the central difference expression given in Equation (2.174) has second-order accuracy, because the leading term in the trun­cation error in Equation (2.173) has (Ax)2. For most CFD solutions, second-order accuracy is sufficient.

So this is how it works—this is how the partial derivatives that appear in the gov­erning flow equations can be discretized. There are many other possible discretized

Numerical Solutions—Computational Fluid Dynamics (CFD)

forms for the derivatives; the forward, rearward, and central differences obtained above are just a few. Note that Taylor series have been used to obtain these discrete forms. Such Taylors series expressions are the basic foundation of finite-difference solutions in CFD. In contrast, if the integral form of the governing flow equations are used, such as Equations (2.48) and (2.64), the individual integrals terms can be discretized, leading again to algebraic equations that are the basic foundation of finite-volume solutions in CFD.


Example 2.7


[2.52]


This example is a simple illustration of how a CFD solution to a given flow can be set up, in this case for an unsteady, one-dimensional flow. Note that the unknown velocity and internal energy at grid point і at time t + At can be calculated in the same manner, writing the appropriate difference equation representations for the x component of the momentum equation, Equation (2.113a), and the energy equation, Equation (2.114).

The above example looks very straightforward, and indeed it is. It is given here only as an illustration of what is meant by a CFD technique. However, do not be misled. Computational fluid dynamics is a sophisticated and complex discipline. For example, we have said nothing here about the accuracy of the final solutions, whether or not a certain computational technique will be stable (some attempts at obtaining numerical solutions will go unstable—blow up—during the course of the calculations), and how much computer time a given technique will require to obtain the flow-field solution. Also, in our discussion we have given examples of some relatively simple grids. The generation of an appropriate grid for a given flow problem is frequently a challenge, and grid generation has emerged as a subdiscipline in its own right within CFD. For these reasons, CFD is usually taught only in graduate-level courses in most universities. However, in an effort to introduce some of the basic ideas of CFD at the undergraduate level, I have written a book, Reference 64, intended to present the subject at the most elementary level. Reference 64 is intended to be read before students go on to the more advanced books on CFD written at the graduate level. In the present book, we will, from time-to-time, discuss some applications of

CFD as part of the overall fundamentals of aerodynamics. However, this book is not about CFD; Reference 64 is.

The Aerodynamic Center: Additional Considerations

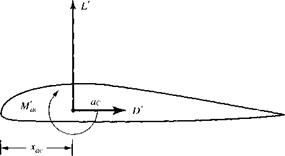
The definition of the aerodynamic center is given in Section 4.3; it is that point on a body about which the aerodynamically generated moment is independent of angle of attack. At first thought, it is hard to imagine that such a point could exist. However, the moment coefficient data in Figure 4.6, which is constant with angle of attack, experimentally proves the existence of the aerodynamic center. Moreover, thin airfoil theory as derived in Sections 4.7 and 4.8 clearly shows that, within the assumptions embodied in the theory, not only does the aerodynamic center exist but that it is located at the quarter-chord point on the airfoil. Therefore, to Figure 1.19 which illustrates three different ways of stating the force and moment system on an airfoil, we can now add a fourth way, namely, the specification of the lift and drag acting through the aerodynamic center, and the value of the moment about the aerodynamic center. This is illustrated in Figure 4.23.

image343

Figure 4.23 Lift, drag, and moments about the aerodynamic center.

image344

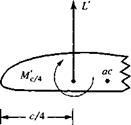
Figure 4.24 Lift and moments about the

quarter-chord point, and a sketch useful for locating the aerodynamic center.


For most conventional airfoils, the aerodynamic center is close to, but not neces­sarily exactly at, the quarter-chord point. Given data for the shape of the lift coefficient curve and the moment coefficient curve taken around an arbitrary point, we can calcu­late the location of the aerodynamic center as follows. Consider the lift and moment system taken about the quarter-chord point, as shown in Figure 4.24. We designate the location of the aerodynamic center by ciac measured from the leading edge. Here, xac is the location of the aerodynamic center as a fraction of the chord length c. Taking moments about the aerodynamic center designated by ac in Figure 4.24, we have

Подпись: [4.67]M’c = L'(cxac – cl A) + M’c/4 Dividing Equation (4.67) by q^Sc, we have

The Aerodynamic Center: Additional Considerations

or


[4.68]


The Aerodynamic Center: Additional Considerations

„ dci dcmcj 4

0 = — (xac – 0.25) H——— —-L-

da da


[4.70]


For airfoils below the stalling angle of attack, the slopes of the lift coefficient and


The Aerodynamic Center: Additional Considerations The Aerodynamic Center: Additional Considerations

moment coefficient curves are constant. Designating these slopes by

Equation (4.70) becomes

Подпись: or Подпись: ttln xx = - + 0.25 a0 Подпись: [4.711

0 = a0(*ac – 0.25) + m0

Hence, Equation (4.71) proves that, for a body with linear lift and moment curves, that is, where ao and mo are fixed values, the aerodynamic center exists as a fixed point on the airfoil. Moreover, Equation (4.71) allows the calculation of the location of this point.

Подпись: Example 4.3Consider the NACA 23012 airfoil studied in Example 4.2. Experimental data for this airfoil is plotted in Figure 4.22, and can be obtained from Reference 11. It shows that, at a = 4°, с-; = 0.55 and c„, t/4 = —0.005. The zero-lift angle of attack is —1.1°. Also, at a = —4°, cm cj4 = —0.0125. (Note that the “experimental” value of cmx/4 = —0.01 tabulated at the end of Example 4.2 is an average value over a range of angle of attack. Since the calculated value of 4 from thin airfoil theory states that the quarter-chord point is the aerodynamic center, it makes sense in Example 4.2 to compare the calculated c,„ ,./4 with an experimental value averaged over a range of angle of attack. However, in the present example, because c„,,( /4 in reality varies with angle of attack, we use the actual data at two different angles of attack.) From the given information, calculate the location of the aerodynamic center for the NACA 23012 airfoil.
Solution

Подпись: ao The Aerodynamic Center: Additional Considerations

Since ci = 0.55 at a = 4° and q = 0 at a = —1.1°, the lift slope is

Подпись: m0 The Aerodynamic Center: Additional Considerations

The slope of the moment coefficient curve is

Подпись: mo a0 Подпись: ■ 0.25 = Подпись: 9.375 x 10~4 0.1078 Подпись: 0.25 Подпись: 0.241

From Equation (4.71),

The result agrees exactly with the measured value quoted on page 183 of Abbott and Von Doenhoff (Reference 11).

The Aerodynamic Center: Additional Considerations

Definition of Total (Stagnation) Conditions

At the beginning of Section 3.4, the concept of static pressure p was discussed in some detail. Static pressure is a measure of the purely random motion of molecules in a gas; it is the pressure you feel when you ride along with the gas at the local flow velocity. In contrast, the total (or stagnation) pressure was defined in Section 3.4 as the pressure existing at a point (or points) in the flow where V = 0. Let us now define the concept of total conditions more precisely.

Consider a fluid element passing through a given point in a flow where the local pressure, temperature, density, Mach number, and velocity are p, T, p, M, and V, respectively. Here, p, T, and p are static quantities (i. e., static pressure, static

temperature, and static density, respectively); they are the pressure, temperature, and density you feel when you ride along with the gas at the local flow velocity. Now imagine that you grab hold of the fluid element and adiabatically slow it down to zero velocity. Clearly, you would expect (correctly) that the values of p, T, and p would change as the fluid element is brought to rest. In particular, the value of the temperature of the fluid element after it has been brought to rest adiabatically is defined as the total temperature, denoted by Tq. The corresponding value of enthalpy is defined as the total enthalpy h0, where ho = cpT0 for a calorically perfect gas. Keep in mind that we do not actually have to bring the flow to rest in real life in order to talk about the total temperature or total enthalpy; rather, they are defined quantities that would exist at a point in a flow if (in our imagination) the fluid element passing through that point were brought to rest adiabatically. Therefore, at a given point in a flow, where the static temperature and enthalpy are T and h, respectively, we can also assign a value of total temperature To and a value of total enthalpy ho defined as above.

For such a flow, Equation (7.56) can be used as a form of the governing energy equation.

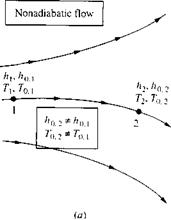
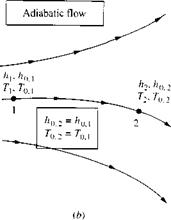
Keep in mind that the above discussion marbled two trains of thought: On the one hand, we dealt with the general concept of an adiabatic flow field [which led to Equations (7.51) to (7.53)], and on the other hand, we dealt with the definition of total enthalpy [which led to Equation (7.54)]. These two trains of thought are really separate and should not be confused. Consider, for example, a general nonadiabatic flow, such as a viscous boundary layer with heat transfer. A generic non-adiabatic flow is sketched in Figure 7.4a. Clearly, Equations (7.51) to (7.53) do not hold for such a flow. However, Equation (7.54) holds locally at each point in the flow, because the assumption of an adiabatic flow contained in Equation (7.54) is made through the definition of ho and has nothing to do with the general overall flow field. For example, consider two different points, 1 and 2, in the general flow, as shown in Figure 7.4a. At point 1, the local static enthalpy and velocity are h i and V, respectively. Hence, the local total enthalpy at point 1 is ho, і = h + V2/2. At point 2, the local static enthalpy and velocity are h2 and V2, respectively. Hence, the local total enthalpy at point 2 is hop = h2+ V}/2. If the flow between points 1 and 2 is nonadiabatic, then ho, Ф hop. Only for the special case where the flow is adiabatic between the two points would ho, — ho<2. This case is illustrated in Figure l. Ab. Of course, this is the special case treated by Equations (7.55) and (7.56).

Return to the beginning of this section, where we considered a fluid element passing through a point in a flow where the local properties are p. T, p, M, and V. Once again, imagine that you grab hold of the fluid element and slow it down to zero velocity, but this time, let us slow it down both adiabatically and reversibly. That is, let us slow the fluid element down to zero velocity isentropically. When the fluid element is brought to rest isentropically, the resulting pressure and density are defined as the total pressure po and total density po. (Since an isentropic process is also adiabatic, the resulting temperature is the same total temperature Го as discussed earlier.) As before, keep in mind that we do not have to actually bring the flow to rest in real life in order to talk about total pressure and total density; rather, they are defined quantities that would exist at a point in a flow if (in our imagination) the fluid element passing through that point were brought to rest isentropically. Therefore, at a given point in a flow, where the static pressure and static density are p and p, respectively, we can also assign a value of total pressure po, and total density po defined as above.

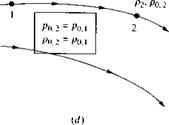
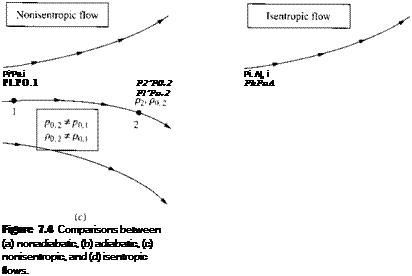
The definition of po and po deals with an isentropic compression to zero velocity. Keep in mind that the isentropic assumption is involved with the definition only. The concept of total pressure and density can be applied throughout any general nonisentropic flow. For example, consider two different points, 1 and 2, in a general

Definition of Total (Stagnation) Conditions

image510image511image514

Definition of Total (Stagnation) Conditions

flow field, as sketched in Figure 7.4c. At point 1, the local static pressure and static density are p and f>, respectively; also the local total pressure and total density are Po. i and (>{) і, respectively, defined as above. Similarly, at point 2, the local static pressure and static density are p2 and /ь. respectively, and the local total pressure and total density are po,2 and po.2. respectively. If the flow is nonisentropic between points 1 and 2, then p0.i ф p0 2 and po. i ф Ли, as shown in Figure 7.4c. On the other hand, if the flow is isentropic between points 1 and 2, then po. i = Po,2 and Po. i = Po.2, as shown in Figure 7.4d. Indeed, if the general flow field is isentropic throughout, then both po and po are constant values throughout the flow.

As a corollary to the above considerations, we need another defined temperature, denoted by T*, and defined as follows. Consider a point in a subsonic flow where the local static temperature is T. At this point, imagine that the fluid element is

speeded up to sonic velocity, adiabatically. The temperature it would have at such sonic conditions is denoted as T*. Similarly, consider a point in a supersonic flow, where the local static temperature is T. At this point, imagine that the fluid element is slowed down to sonic velocity, adiabatically. Again, the temperature it would have at such sonic conditions is denoted as T*. The quantity T* is simply a defined quantity at a given point in a flow, in exactly the same vein as T0, p0, and p0 are defined quantities. Also, a* = yJyRT*.

Finite Control Volume Approach

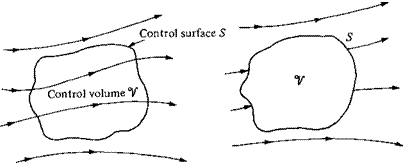
Consider a general flow field as represented by the streamlines in Figure 2.11. Let us imagine a closed volume drawn within a finite region of the flow. This volume defines a control volume V, and a control surface S is defined as the closed surface which bounds the control volume. The control volume may be fixed in space with the fluid moving through it, as shown at the left of Figure 2.11. Alternatively, the control volume may be moving with the fluid such that the same fluid particles are always inside it, as shown at the right of Figure 2.11. In either case, the control volume is a reasonably large, finite region of the flow. The fundamental physical principles are applied to the fluid inside the control volume, and to the fluid crossing the control surface (if the control volume is fixed in space). Therefore, instead of looking at the whole flow field at once, with the control volume model we limit our attention to just the fluid in the finite region of the volume itself.

2.3.1 Infinitesimal Fluid Element Approach

image106

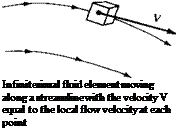
Consider a general flow field as represented by the streamlines in Figure 2.12. Let us imagine an infinitesimally small fluid element in the flow, with a differential volume dV. The fluid element is infinitesimal in the same sense as differential calculus; however, it is large enough to contain a huge number of molecules so that it can be viewed as a continuous medium. The fluid element may be fixed in space with the fluid moving through it, as shown at the left of Figure 2.12. Alternatively, it may be moving along a streamline with velocity V equal to the flow velocity at each point. Again, instead of looking at the whole flow field at once, the fundamental physical principles are applied to just the fluid element itself.

Figure 2.1 1 Finite control volume approach.

image108

d°V


image107

Volume d°V


Подпись: Infinitesimal fluid element moving along a streamline with the velocity V equal to the local flow velocity at each point Infinitesimal fluid element fixed in space with the fluid moving through it

Figure 2.12 Infinitesimal fluid element approach.

Uniform Flow: Our First Elementary Flow

In this section, we present the first of a series of elementary incompressible flows which later will be superimposed to synthesize more complex incompressible flows. For the remainder of this chapter and in Chapter 4, we deal with two-dimensional steady flows; three-dimensional steady flows are treated in Chapters 5 and 6.

Consider a uniform flow with velocity V7^ oriented in the positive a direction, as sketched in Figure 3.19. It is easily shown (see Problem 3.8) that a uniform flow is a physically possible incompressible flow (i. e., it satisfies V • V = 0) and that it is irrotational (i. e., it satisfies V x V = 0). Hence, a velocity potential for uniform flow can be obtained such that Уф = V. Examining Figure 3.19, and recalling Equation

(2.156) , we have

3 ф r,

— = и = Voo [3.49a]

3a

3 ф

and — = u = 0 [3.49b]

dy

Integrating Equation (3.49a) with respect to a, we have

Ф — УЖХ + f(y) [3.50]

where f(y) is a function of у only. Integrating Equation (3.49b) with respect to y, we obtain

ф = const + g(x) [3.51]

where g(x) is a function of a only. In Equations (3.50) and (3.51), ф is the same function; hence, by comparing these equations, g(x) must be V~^ a, and /(>’) must be constant. Thus,

Подпись: [3.52]ф = VooA + const

Note that in a practical aerodynamic problem, the actual value of ф is not significant; rather, ф is always used to obtain the velocity by differentiation; that is, Уф = V. Since the derivative of a constant is zero, we can drop the constant from Equation (3.52) without any loss of rigor. Hence, Equation (3.52) can be written as

Подпись: -©■ ф = const

[3.53]

Figure 3.19 Uniform flow.

Equation (3.53) is the velocity potential for a uniform flow with velocity Vqo oriented in the positive x direction. Note that the derivation of Equation (3.53) does not depend on the assumption of incompressibility; it applies to any uniform flow, compressible or incompressible.

Consider the incompressible stream function 1js. From Figure 3.19 and Equations (2.150a and b), we have

w v

dy

[3.54 a]

and

dfi _ v__Q

dx

[3.54b]

Integrating Equation (3.54a) with respect to у and Equation (3.54b) with respect to x, and comparing the results, wc obtain

Подпись: Ф = УооУ[3.55]

Equation (3.55) is the stream function for an incompressible uniform flow oriented in the positive x direction.

From Section 2.14, the equation of a streamline is given by i/r = constant. Therefore, from Equation (3.55), the streamlines for the uniform flow are given by i/f = Vooy = constant. Because is itself constant, the streamlines are thus given mathematically as у = constant (i. e., as lines of constant y). This result is consistent with Figure 3.19, which shows the streamlines as horizontal lines (i. e., as lines of constant y). Also, note from Equation (3.53) that the equipotential lines are lines of constant*, as shown by the dashed line in Figure 3.19. Consistent with our discussion in Section 2.16, note that the lines of ijr = constant and ф = constant are mutually perpendicular.

Equations (3.53) and (3.55) can be expressed in terms of polar coordinates, where x = r cos 9 and у = r sin 9, as shown in Figure 3.19. Hence,

Подпись:

Подпись: 1jr = V^r sin 9 Подпись: [3.57] Подпись: and

[3.56]

Consider the circulation in a uniform flow. The definition of circulation is given by

Г = – j> Vds [2.136]

Let the closed curve C in Equation (2.136) be the rectangle shown at the left of Figure 3.19; h and l are the lengths of the vertical and horizontal sides, respectively, of the rectangle. Then

V • ds = – Уооl – 0(h) + V^l + 0(h) = 0

or


Г = 0


[3.58]


image229

Equation (3.58) is true for any arbitrary closed curve in the uniform flow. To show this, note that Voo is constant in both magnitude and direction, and hence

because the line integral of ds around a closed curve is identically zero. Therefore, from Equation (3.58), we state that circulation around any closed curve in a uniform flow is zero.

The above result is consistent with Equation (2.137), which states that

Подпись: 5 [2.137]

We stated earlier that a uniform flow is irrotational; that is, V x V = 0 everywhere. Hence, Equation (2.137) yields Г = 0.

Note that Equations (3.53) and (3.55) satisfy Laplace’s equation [see Equation

(3.41) ], which can be easily proved by simple substitution. Therefore, uniform flow is a viable elementary flow for use in building more complex flows.

Effect of Aspect Ratio

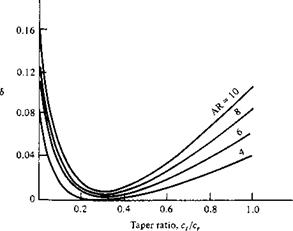
Returning to Equations (5.61) and (5.62), note that the induced drag coefficient for a finite wing with a general lift distribution is inversely proportional to the aspect ratio, as was discussed earlier in conjunction with the case of the elliptic lift distribution. Note that AR, which typically varies from 6 to 22 for standard subsonic airplanes

image432

Figure 5.1 8 Induced drag factor S as a function of taper ratio. (Source: McCormick, B. W., Aerodynamics, Aeronautics, and Flight Mechanics, John Wiley & Sons, New York, 1979.)


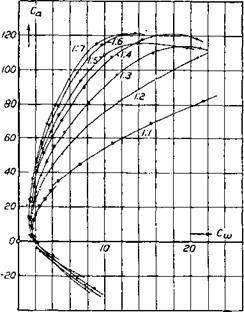
and sailplanes, has a much stronger effect on Cdj than the value of <5, which from Figure 5.18 varies only by about 10 percent over the practical range of taper ratio. Hence, the primary design factor for minimizing induced drag is not the closeness to an elliptical lift distribution, but rather, the ability to make the aspect ratio as large as possible. The determination that Cdj is inversely proportional to AR was one of the great victories of Prandtl’s lifting-line theory. In 1915, Prandtl verified this result with a series of classic experiments wherein the lift and drag of seven rectangular wings with different aspect ratios were measured. The data are given in Figure 5.19. Recall from Equation (5.4), that the total drag of a finite wing is given by

Подпись:Подпись: CD — cd +C2

^L

neAR.

Подпись: and Effect of Aspect Ratio Подпись: [5.64a] [5.64b]

The parabolic variation of CD with CL as expressed in Equation (5.63) is reflected in the data of Figure 5.19. If we consider two wings with different aspect ratios ARi and AR2, Equation (5.63) gives the drag coefficients CDд and C0,2 for the two wings as

Assume that the wings are at the same Cl. Also, since the airfoil section is the same for both wings, Cd is essentially the same. Moreover, the variation of e between the

image433

Figure 5.1 9 Prandtl’s classic rectangular wing data for seven different aspect ratios from 1 to 7; variation of lift coefficient versus drag coefficient. For historical interest, we reproduce here Prandtl’s actual graphs. Note that, in his nomenclature, Ca = lift coefficient and Cw = drag coefficient. Also, the numbers on both the ordinate and abscissa are 100 times the actual values of the coefficients. (Source: Prandtl, L., "Applications of Modern Hydrodynamics to Aeronautics,"

NACA Report No. 116, 1921.)


Подпись: C2, Cn. і — Co,2 H 7ГЄ Подпись: 1 AR^ Подпись: 1 AR2 Подпись: [5.65]

wings is only a few percent and can be ignored. Hence, subtracting Equation (5.64b) from (5.64a), we obtain

Equation (5.65) can be used to scale the data of a wing with aspect ratio AR2 to correspond to the case of another aspect ratio AR|. For example, Prandtl scaled the data of Figure 5.19 to correspond to a wing with an aspect ratio of 5. For this case,

Equation (5.65) becomes

Сд, і = Co,2 H———– f – — —c—^ [5.66]

же 5 AR2/

Inserting the respective values of Cd,2 and AR2 from Figure 5.19 into Equation (5.66), Prandtl found that the resulting data for Сд, ь versus Cl collapsed to essentially the same curve, as shown in Figure 5.20. Hence, the inverse dependence of Cd, і on AR was substantially verified as early as 1915.

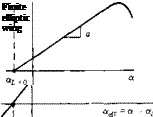
There are two primary differences between airfoil and finite-wing properties. We have discussed one difference, namely, a finite wing generates induced drag. However, a second major difference appears in the lift slope. In Figure 4.4, the lift slope for an airfoil was defined as a0 = dci/da. Let us denote the lift slope for a finite wing as a = dCL/da. When the lift slope of a finite wing is compared with that of its airfoil section, we find that a < a0- To see this more clearly, return to Figure 5.4, which illustrates the influence of downwash on the flow over a local airfoil section of a finite wing. Note that although the geometric angle of attack of the finite wing is a, the airfoil section effectively senses a smaller angle of attack, namely, aetf, where acff = a — a,-. For the time being, consider an elliptic wing with no twist; hence, a, and acff are both constant along the span. Moreover, q is also constant along the span, and therefore CL = ci. Assume that we plot Cl for the finite wing versus aeff, as shown at the top of Figure 5.21. Because we are using аеп the lift slope corresponds

Figure 5.30 Data of Figure 5.19

scaled by Prandtl to an aspect ratio of 5.

to that for an infinite wing ao. However, in real life, our naked eyes cannot see aeff; instead, what we actually observe is a finite wing with a certain angle between the chord line and the relative wind; that is, in practice, we always observe the geometric angle of attack a. Hence, CL for a finite wing is generally given as a function of a, as sketched at the bottom of Figure 5.21. Since a > aeff, the bottom abscissa is stretched, and hence the bottom lift curve is less inclined; it has a slope equal to a, and Figure 5.21 clearly shows that a < a(). The effect of a finite wing is to reduce the lift slope. Also, recall that at zero lift, there are no induced effects; i. e., a, = CDJ = 0. Thus, when Cl = 0, a = aeff. As a result, a/ =0 is the same for the finite and the infinite wings, as shown in Figure 5.21.

The values of a о and a are related as follows. From the top of Figure 5.21,

dCL

d(a — ctj)

Integrating, we find

Подпись: [5.67]CL = ao(a — at) + const

Substituting Equation (5.42) into (5.67), we obtain

image434"

image435,image436 Подпись: Infinite wing

[5.68]

Подпись: Figure 5.21Lift curves for an infinite wing versus a finite elliptic wing.

Differentiating Equation (5.68) with respect to a, and solving for dCi/da, we obtain

Подпись: [5.09]dCb _ _ do

da 1 + qq/^AR

Equation (5.69) gives the desired relation between a0 and a for an elliptic finite wing. For a finite wing of general planform, Equation (5.69) is slightly modified, as given below:

1 + (a0/7rAR)(l + r)

In Equation (5.70), г is a function of the Fourier coefficients A„. Values of r were first calculated by Glauert in the early 1920s and were published in Reference 18, which should be consulted for more details. Values of r typically range between 0.05 and 0.25.

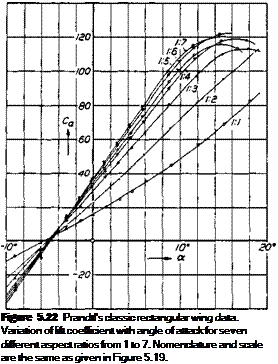
Подпись: Figure 5.22 Prandtl's classic rectangular wing data. Variation of lift coefficient with angle of attack for seven different aspect ratios from 1 to 7. Nomenclature and scale are the same as given in Figure 5.19.

Of most importance in Equations (5.69) and (5.70) is the aspect-ratio variation. Note that for low-AR wings, a substantial difference can exist between a0 and a. However, as AR oo, a ao – The effect of aspect ratio on the lift curve is dramat­ically shown in Figure 5.22, which gives classic data obtained on rectangular wings byPrandtlin 1915. Note the reduction in dCi/da as AR is reduced. Moreover, using the equations obtained above, Prandtl scaled the data in Figure 5.22 to correspond to an aspect ratio of 5; his results collapsed to essentially the same curve, as shown in

Figure 5.23. In this manner, the aspect-ratio variation given in Equations (5.69) and (5.70) was confirmed as early as the year 1915.

Road Map for This Chapter

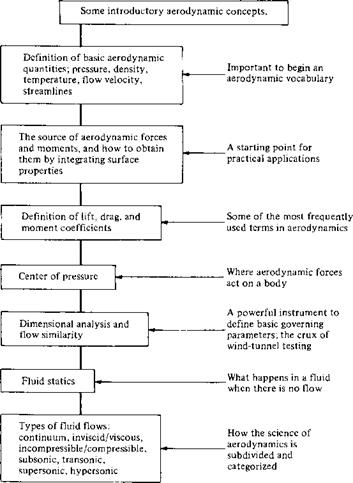
When learning a new subject, it is important for you to know where you are, where you are going, and how you can get there. Therefore, at the beginning of each chapter in this book, a road map will be given to help guide you through the material of that chapter and to help you obtain a perspective as to how the material fits within the general framework of aerodynamics. For example, a road map for Chapter 1 is given in Figure 1.6. You will want to frequently refer back to these road maps as you progress through the individual chapters. When you reach the end of each chapter, look back over the road map to see where you started, where you are now, and what you learned in between.

1.3 Some Fundamental Aerodynamic Variables

A prerequisite to understanding physical science and engineering is simply learn­ing the vocabulary used to describe concepts and phenomena. Aerodynamics is no exception. Throughout this book, and throughout your working career, you will be adding to your technical vocabulary list. Let us start by defining four of the most frequently used words in aerodynamics: “pressure,” “density,” “temperature,” and “flow velocity.”1

Consider a surface immersed in a fluid. The surface can be a real, solid surface such as the wall of a duct or the surface of a body; it can also be a free surface which we simply imagine drawn somewhere in the middle of a fluid. Also, keep in mind that

image13

Figure 1 .6 Road map for Chapter 1.


the molecules of the fluid are constantly in motion. Pressure is the normal force per unit area exerted on a surface due to the time rate of change of momentum of the gas molecules impacting on (or crossing) that surface. It is important to note that even though pressure is defined as force “per unit area,” you do not need a surface that is exactly 1 ft2 or 1 m2 to talk about pressure. In fact, pressure is usually defined at a point in the fluid or a point on a solid surface and can vary from one point to another. To see this more clearly, consider a point В in a volume of fluid. Let

dA — elemental area at В

dF = force on one side of dA due to pressure

Then, the pressure at point В in the fluid is defined as

dF

~dA


p = lim


dA


0


The pressure p is the limiting form of the force per unit area, where the area of interest has shrunk to nearly zero at the point B.[1] Clearly, you can see that pressure is a point property and can have a different value from one point to another in the fluid.

Another important aerodynamic variable is density, defined as the mass per unit volume. Analogous to our discussion on pressure, the definition of density does not require an actual volume of 1 ft[2] or 1 m3. Rather, it is a point property that can vary from point to point in the fluid. Again, consider a point В in the fluid. Let

dv = elemental volume around В dm — mass of fluid inside dv Then, the density at point В is

dm

p = lim—— dv —»■ 0

dv

Therefore, the density p is the limiting form of the mass per unit volume, where the volume of interest has shrunk to nearly zero around point B. (Note that dv cannot achieve the value of zero for the reason discussed in the footnote concerning dA in the definition of pressure.)

Temperature takes on an important role in high-speed aerodynamics (introduced in Chapter 7). The temperature Г of a gas is directly proportional to the average kinetic energy of the molecules of the fluid. In fact, if KE is the mean molecular kinetic energy, then temperature is given by ICE = |kT, where к is the Boltzmann constant. Hence, we can qualitatively visualize a high-temperature gas as one in which the molecules and atoms are randomly rattling about at high speeds, whereas in a low-temperature gas, the random motion of the molecules is relatively slow. Temperature is also a point property, which can vary from point to point in the gas.

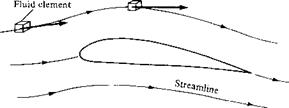
The principal focus of aerodynamics is fluids in motion. Hence, flow velocity is an extremely important consideration. The concept of the velocity of a fluid is slightly more subtle than that of a solid body in motion. Consider a solid object in translational motion, say, moving at 30 m/s. Then all parts of the solid are simul­taneously translating at the same 30 m/s velocity. In contrast, a fluid is a “squishy” substance, and for a fluid in motion, one part of the fluid may be traveling at a different velocity from another part. Hence, we have to adopt a certain perspective, as follows. Consider the flow of air over an airfoil, as shown in Figure 1.7. Lock your eyes on a specific, infinitesimally small element of mass in the gas, called a fluid element, and watch this element move with time. Both the speed and direction of this fluid element can vary as it moves from point to point in the gas. Now fix your eyes on a specific fixed point in space, say, point В in Figure 1.7. Flow velocity can now be defined as follows: The velocity of a flowing gas at any fixed point В in space is the velocity of an infinitesimally small fluid element as it sweeps through B. The flow velocity V has both magnitude and direction; hence, it is a vector quantity. This is in contrast to p, p, and T, which are scalar variables. The scalar magnitude of V is frequently

В

image14

Figure 1.7

Illustration of flow velocity and streamlines.


used and is denoted by V. Again, we emphasize that velocity is a point property and can vary from point to point in the flow.

Referring again to Figure 1.7, a moving fluid element traces out a fixed path in space. As long as the flow is steady, i. e., as long as it does not fluctuate with time, this path is called a streamline of the flow. Drawing the streamlines of the flow field is an important way of visualizing the motion of the gas; we will frequently be sketching the streamlines of the flow about various objects. A more rigorous discussion of streamlines is given in Chapter 2.

Substantial Derivative

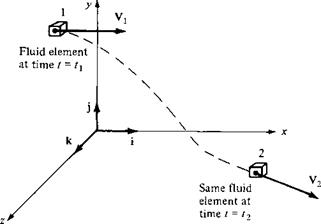
Consider a small fluid element moving through a flow field, as shown in Figure 2.24. This figure is basically an extension of Figure 2.14, in which we introduced the concept of a fluid element moving through a specified flow field. The velocity field is given by V = ui + vj + uik, where

и — u(x, y, z, t) v = v(x, y, z, t) w — w(x, y, z, t)

In addition, the density field is given by

p = p(x, y, z, t)

At time t, the fluid element is located at point 1 in the flow (see Figure 2.24), and its density is

Pi = P(x, Vi, Zi, fi)

image144

Figure 2.24 Fluid element moving in a flow field —illustration for the substantial derivative.


At a later time f2 the same fluid element has moved to a different location in the flow field, such as point 2 in Figure 2.24. At this new time and location, the density of the fluid element is

Pi = P(x2, У2, Z2, tl)

Since p = p{x, у, г, t), we can expand this function in a Taylor series about point 1 as follows:

Подпись: 8p . . Tx 1Подпись:Подпись: Pi = Pi +(Уі ~ Уі) + (Z2 – Z)

ґдр

+ ( — I (h — fi) + higher-order terms dt ) у

Dividing by t2 — t, and ignoring the higher-order terms, we have Pi – Pi / dp x2 x / dp / У2 ~ Уі / dp Z2-Z1 / Эр

t2-t dx)xt2-ti уЗуД V t2 – ft / 3z / ] t2 t 3f/j

[2.101]

Consider the physical meaning of the left side of Equation (2.101). The term (p2 — P)/(h — t) is the average time rate of change in density of the fluid element as it moves from point 1 to point 2. In the limit, as t2 approaches t, this term becomes

p2 – pi Dp

hm ———- = —

h—’t2 — t Dt

Here, Dp/Dt is a symbol for the instantaneous time rate of change of density of the fluid element as it moves through point 1. By definition, this symbol is called the substantial derivative D/Dt. Note that Dp/Dt is the time rate of change of density

of a given fluid element as it moves through space. Here, our eyes are locked on the fluid element as it is moving, and we are watching the density of the element change as it moves through point 1. This is different from (dp/dt), which is physically the time rate of change of density at the fixed point 1. For (dp/dt), we fix our eyes on the stationary point 1, and watch the density change due to transient fluctuations in the flow field. Thus, Dp/Dt and dpjdt are physically and numerically different quantities.

Returning to Equation (2.101), note that

Substantial Derivative

Thus, taking the limit of Equation (2.101) as t2 t, we obtain

Substantial Derivative

dp dp dz + dt


[3.103]


Examine Equation (2.102) closely. From it, we can obtain an expression for the substantial derivative in cartesian coordinates:

Подпись:[3.103]

Furthermore, in cartesian coordinates, the vector operator V is defined as

Подпись:Подпись: + j3 3

——- 1- к —

dy dz

Hence, Equation (2.103) can be written as

D

Dt


[3.104]


Equation (2.104) represents a definition of the substantial derivative in vector notation; thus, it is valid for any coordinate system.

Focusing on Equation (2.104), we once again emphasize that D/Dt is the sub­stantial derivative, which is physically the time rate of change following a moving fluid element; 3/31 is called the local derivative, which is physically the time rate of change at a fixed point; V • V is called the convective derivative, which is physically the time rate of change due to the movement of the fluid element from one location to another in the flow field where the flow properties are spatially different. The sub­stantial derivative applies to any flow-field variable, e. g., Dp/Dt, DT/Dt, Du/Dt. For example,

DT З T dT dT d T dT

—– =——— b (V • V)T =——— f – и——- b V—— b w —

Dt dt dt dx dy dz

local comcclive

derivative derivative

Again, Equation (2.105) states physically that the temperature of the fluid element is changing as the element sweeps past a point in the flow because at that point the flow-field temperature itself may be fluctuating with time (the local derivative) and because the fluid element is simply on its way to another point in the flow field where the temperature is different (the convective derivative).

Consider an example which will help to reinforce the physical meaning of the substantial derivative. Imagine that you are hiking in the mountains, and you are about to enter a cave. The temperature inside the cave is cooler than outside. Thus, as you walk through the mouth of the cave, you feel a temperature decrease—this is analogous to the convective derivative in Equation (2.105). However, imagine that, at the same time, a friend throws a snowball at you such that the snowball hits you just at the same instant you pass through the mouth of the cave. You will feel an additional, but momentary, temperature drop when the snowball hits you—this is analogous to the local derivative in Equation (2.105). The net temperature drop you feel as you walk through the mouth of the cave is therefore a combination of both the act of moving into the cave, where it is cooler, and being struck by the snowball at the same instant—this net temperature drop is analogous to the substantial derivative in Equation (2.105).